
- SPEECH
Patient monetary policy amid a rocky recovery
Speech by Fabio Panetta, Member of the Executive Board of the ECB, at Sciences Po
Paris, 24 November 2021
The long and rocky road out of the pandemic is creating challenges for monetary policy. Following years of too-low inflation and policy oriented at addressing deflationary risks, we are now in an environment of two-way inflation risks and heightened short-term volatility (Chart 1). Markets are indicating increasing uncertainty about the inflation outlook, and investors’ expectations of lift-off dates have become more dispersed.
In this environment, central banks must clarify their reaction function, so that market expectations remain aligned with their policy intentions. This, in turn, requires a clear framework for thinking about inflation developments and what conditions would warrant a monetary policy response.
We are facing a unique combination of shocks that reflect the exceptional nature of the recovery from the pandemic: supply bottlenecks, surging energy prices and labour market frictions. We cannot say exactly when these factors will normalise. But in order to design our policy action, we need to gauge their implications for inflation in the medium term. Our focus needs to be on the risk that inflation in the medium term turns out persistently lower or higher than our 2% target, rather than on short-run developments.
Today, I will argue that globally we are seeing a mix of demand and supply shocks, but in the euro area supply constraints dominate to a much greater degree than in some other major economies. This is leading to a temporary spike in the price level, which acts as a “tax” on consumption and a brake on production, over time generating effects akin to an adverse demand shock.
In this context, so long as higher short-run inflation does not feed into inflation expectations and wage and price-setting in a destabilising way, monetary policy should remain patient.[1] We should not exacerbate the risk of supply shocks morphing into a demand shock and threatening the recovery by prematurely tightening monetary policy – or by passively tolerating an undesirable tightening in financing conditions.
We should remain focused on completing the recovery, returning GDP to its pre-crisis trend, as the condition for achieving self-sustained inflation at our target in the medium term. To this end, we should keep using all of our instruments for as long as warranted, with the necessary flexibility to support the transmission of our policy stance throughout the euro area on its uncertain path out of the pandemic.
Chart 1 Euro area core inflation
(month-on-month percentage changes, annualised, seasonally and working-day adjusted)
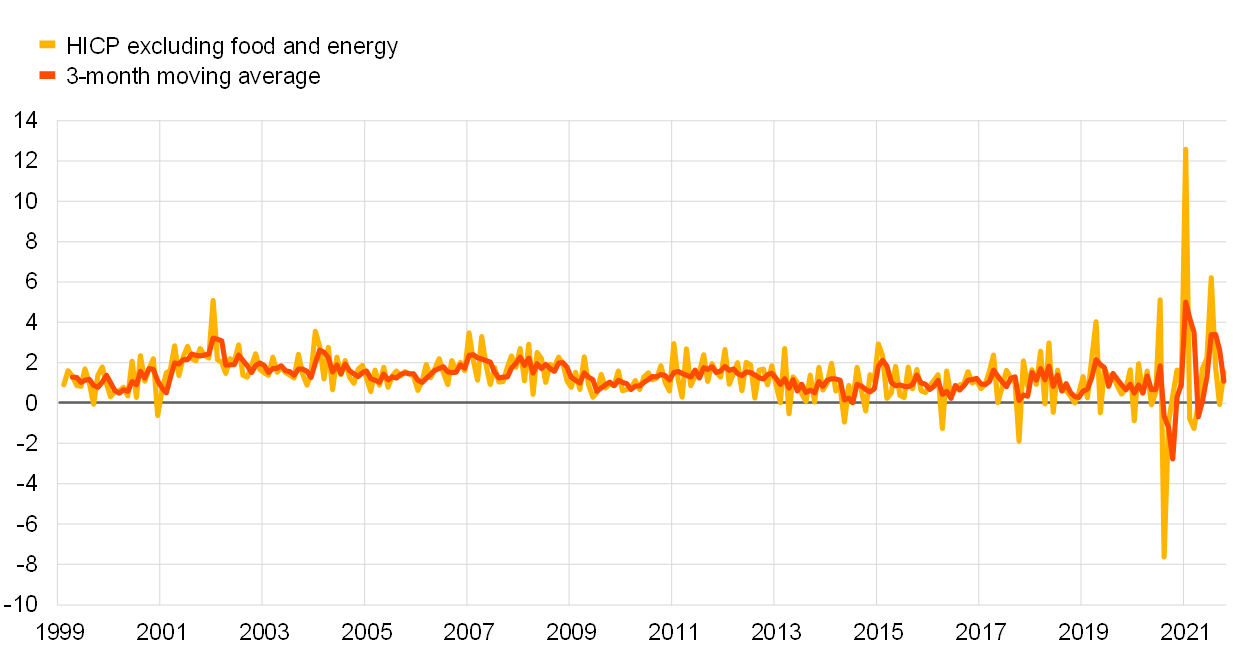
Source: ECB
Three types of inflation: the good, the bad and the ugly
For illustrative purposes, we can identify three different types of inflation.
The first is “good” inflation, which comes about when demand is robust, output is at potential, employment is high, inflation is converging towards 2% and inflation expectations are anchored at 2%.[2] Such inflation is consistent with wages rising at a pace that reflects our target and productivity gains, thereby supporting real disposable income. It does not distort economic decisions and creates a buffer in nominal interest rates that allows monetary policy to address subsequent negative shocks.
After a deep recession like the one caused by the pandemic, monetary policy should accompany the economy towards a strong recovery as a necessary condition for “good” inflation. In the euro area, with monetary policy holding down nominal yields, real yields have eased, leading to a fast recovery and strong employment gains.[3]
The second type, “bad” inflation, occurs when negative supply shocks raise prices and depress economic activity. This outcome is typically seen, for example, following a sharp supply shock that raises energy prices, which for the euro area is equivalent to a terms of trade “tax” and compresses real disposable income. Such inflation typically falls once the supply shock is reabsorbed.
A central bank would usually aim to be patient and look through “bad” inflation. A premature tightening of monetary policy could turn the supply shock into a prolonged recession, thereby depressing demand and undermining price stability in the medium term. This is a key reason for the flexible medium-term horizon of the ECB’s monetary policy strategy.[4]
The third type of inflation is “ugly” inflation, which arises when above-target inflation – regardless of its drivers – de-anchors inflation expectations and becomes persistent through wage and price-setting behaviour. In this situation inflation can spiral upwards. A central bank committed to price stability must therefore act decisively to break the circuit if it observes clear signals that this is about to materialise.
The nature of current euro area inflation
So, which type of inflation are we seeing today?
The data suggest the current picture is dominated by a bout of “bad” inflation generated outside the euro area, whereas we are far from seeing abnormally large domestic demand.
The euro area is facing an inflation spike which results from a mixture of purely temporary factors, such as base effects (Chart 2, left-hand side),[5] and from global supply shocks that are hitting the economy at a time when demand worldwide is normalising. The dominant driver at present is the surge in energy prices globally.[6] In October, energy contributed 2.2 percentage points to inflation, the largest contribution in the history of the euro area (Chart 2, right-hand side).[7] This is pushing up short-run inflation, which has still not reached its peak.
Two observations are worth emphasising.
First, 80% of headline inflation reflects shocks generated abroad, mainly because the euro area is a net importer of energy and commodities (Chart 3, left-hand side). In fact, headline inflation exceeds domestically-generated inflation[8] to an extent never seen before (Chart 3, right-hand side). Higher import prices are compressing household real disposable income and increasing firms’ production costs.[9]
Second, although strong global demand is exacerbating pandemic-related bottlenecks worldwide, in the euro area, this is mostly translating into a negative supply shock, which is pushing up core inflation. This shock is especially visible in longer supplier delivery times, which are in turn reducing the availability and increasing the price of durables (Chart 4, left-hand side).[10] Quantitatively, survey indicators suggest that in the euro area most (about two-thirds) of the rise in suppliers’ delivery times is due to supply factors.
The supply shock is hitting our economy at an earlier stage of its recovery; in fact, the euro area is lagging behind the global recovery in demand. Services consumption remains well below its pre-crisis level;[11] and durable goods consumption is showing nothing like the boom that is ongoing in the United States (Chart 5). This may explain why, despite the global nature of supply bottlenecks, core inflation on a two-year basis – i.e. stripping out base effects – is much lower than in the United States (Chart 4, right-hand side).
So, applying the reaction function to “bad” inflation that I laid out earlier, monetary policy should remain patient. A premature tightening would restrain spending before demand has returned to trend. We could end up with a demand shortfall when supply normalises and inventories build up,[12] resulting in too-low medium-term inflation and employment.
We should therefore not react by curbing the recovery in our domestic demand – or put it at risk by tolerating unwarranted spillovers to financing conditions from abroad.[13]
Chart 2
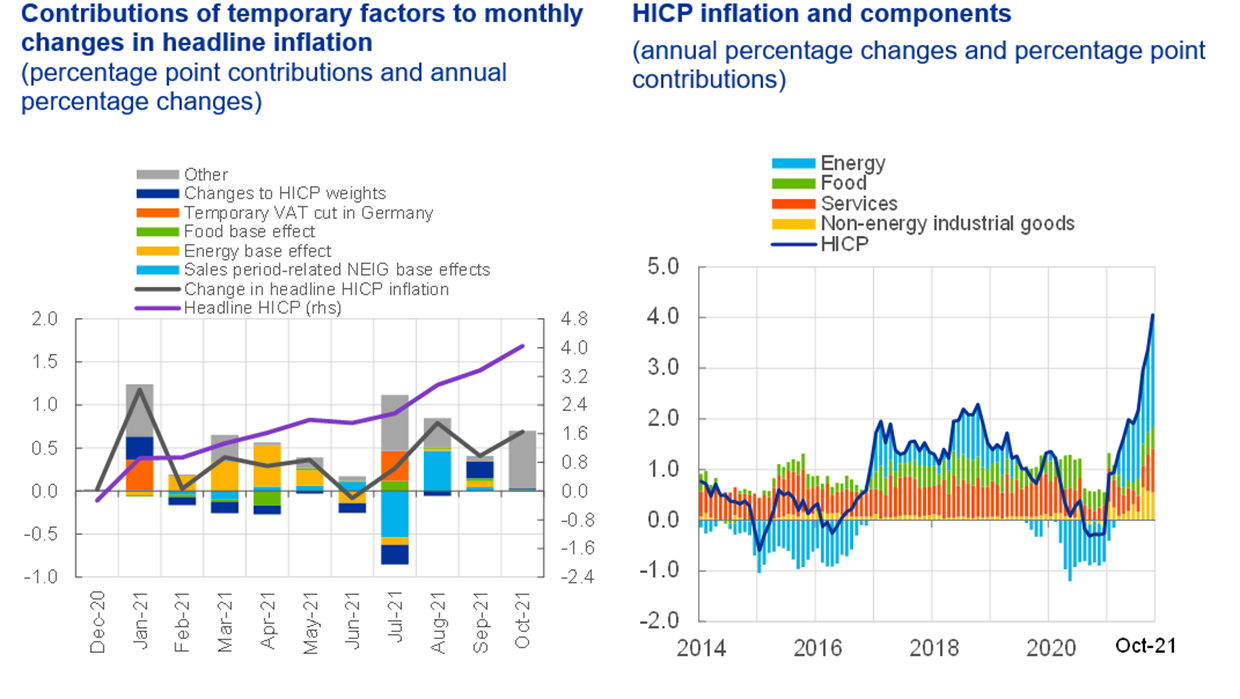
Left-hand panel. Source: Eurostat, Deutsche Bundesbank, September NIPE and ECB staff calculations.
Note: The latest observations are for October 2021.
Right-hand panel. Source: Eurostat and ECB staff calculations.
Chart 3
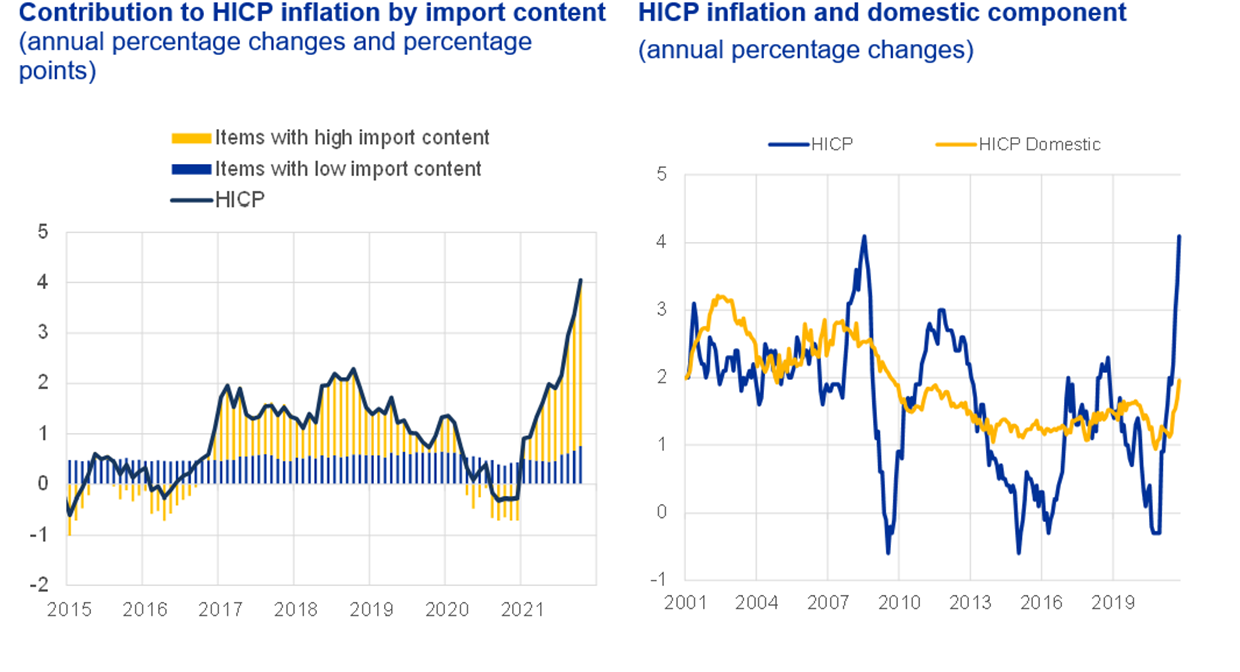
Left-hand panel. Sources: WIOD, Eurostat and ECB staff calculations. Note: The latest observations are for October 2021.
Right-hand panel. Sources: WIOD, Eurostat and ECB staff calculations. Note: The latest observations are for October 2021.
Chart 4
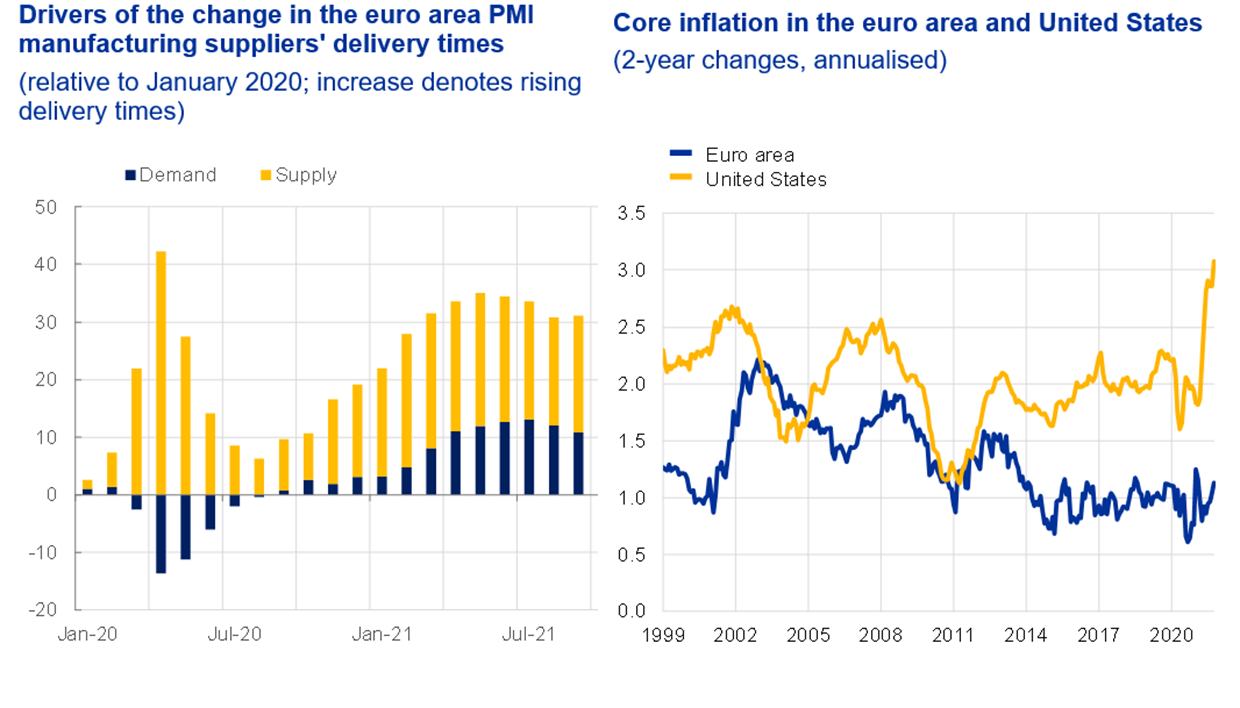
Left-hand panel. Sources: ECB and Eurostat.
Right-hand panel. Sources: Eurostat and Federal Reserve System.
Chart 5 Individual consumption – durables and services
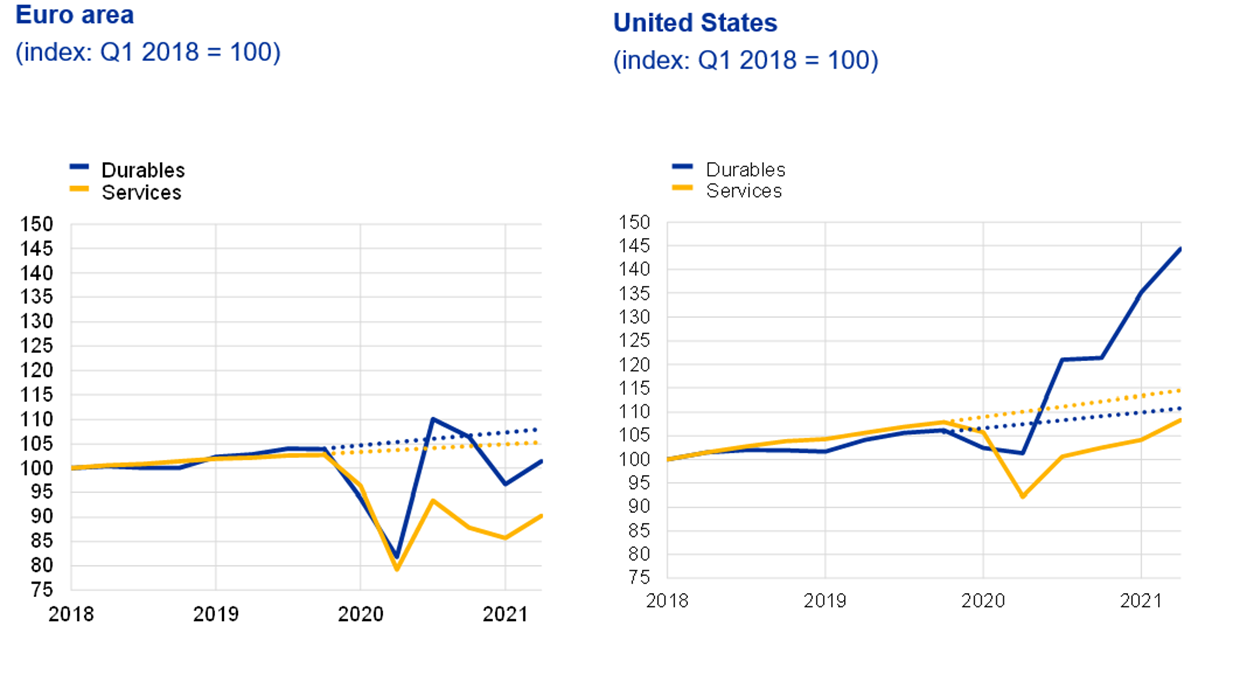
Sources: ECB and Federal Reserve System.
Notes: Dotted lines denote linear trend (Q1 2018-Q4 2019). Durables and services for the euro area are approximated using a bottom-up aggregation of available country-level data.
Assessing the medium-term balance of risks
That said, we should not ignore the risks to medium-term inflation, as the forces driving up inflation today could turn out to be more persistent than expected. If this were to happen, it would exacerbate risks in both directions.
On the one hand, “bad” inflation could eventually turn into “ugly” inflation if persistent upward price pressures were to de-anchor inflation expectations and destabilise wage and price-setting. This would be an argument for a tightening of monetary conditions.
On the other hand, “bad inflation”, acting as a “tax” on demand, could ultimately move the economy further away from full capacity utilisation, depressing medium-term underlying inflation. This might require an easing of monetary policy.
Provided the risks are not excessive on both sides, a steady hand – preserving the prevailing stance of monetary policy – should be the preferred course of action.
So how can we evaluate the medium-term balance of risks from today’s standpoint?
Risks of persistent inflation dynamics
To begin with, we need to assess whether we are likely to see propagation mechanisms that could transform the current price level shock into destabilising inflation dynamics, in particular a wage-price spiral.
Typically, a sustained increase in wages requires the economy to be operating persistently above potential. This is not currently the case in the euro area. Estimates of the output gap suggest that it will take time before it is convincingly positive (Chart 6, left-hand side).
And although the labour market is recovering, there is still slack: we have half a million fewer jobs than before the pandemic, approximately 2.4 million workers are still under job retention schemes[14] and hours worked are down by around 4% from their pre-pandemic levels[15] (Chart 6, right-hand side). Moreover, in the second quarter of this year, there were 1.4 million fewer workers in the labour force than in the last quarter of 2019. Some of those who were discouraged from working or looking for work during the pandemic may seek to rejoin the labour force as the recovery takes hold.[16]
Wage pressures could still emerge before the economy reaches full capacity if there are widespread matching inefficiencies in the labour market – for instance owing to structural changes triggered by the pandemic – or if the inflation spike impacts wage bargaining dynamics. But neither appears to be the case today.
First, we see no real evidence of a broad-based skill mismatch across the economy. We are seeing high job vacancy rates, especially in the high-contact services that have recently reopened, but we are also seeing strong growth in employment. This suggests that the economy is largely following the normal movement along the Beveridge curve[17] seen during recoveries, undergoing a typical matching process (Chart 7, left-hand side).[18]
Second, negotiated wage increases are subdued despite the inflation spike, suggesting that in their bargaining with employers unions may be prioritising non-wage factors, such as job security (Chart 7, right-hand side). This may reflect prudence following recent crises and amid renewed uncertainty, or structural factors related to labour-saving investments in digitalisation and automation.[19]
Modest wage demands also suggest that inflation expectations remain well anchored. That picture is corroborated by market-based and survey-based measures – at both medium- and longer-term horizons – which show no signs of de-anchoring. What we see is rather inflation expectations re-anchoring towards our 2% target from below, especially when filtering out risk premia (Chart 8). An increase in risk premia in inflation compensation is common in response to a supply shock.[20]
The fact that we do not see wage-price spirals is not too surprising. Workers, employers and financial investors know that the ECB would decisively counter any destabilising increase in medium-term inflation. And this commitment matters: when central banks are credible, commodity and energy prices are poor predictors of future core inflation.[21]
Wage growth is expected to pick up as the recovery matures, but we should not be alarmed if we see signs of a one-off catch-up in wages next year.[22] Over the medium term it is desirable that we see increases in unit labour costs[23] that are consistent with our inflation target, since this is critical for 2% inflation to become self-sustained.
But for now unit labour cost dynamics remain subdued. And as productivity is expected to increase after the pandemic, the effects of increasing wages on unit labour cost growth will tend to be tempered.[24]. Higher wages would instead help sustain consumer demand.
Chart 6
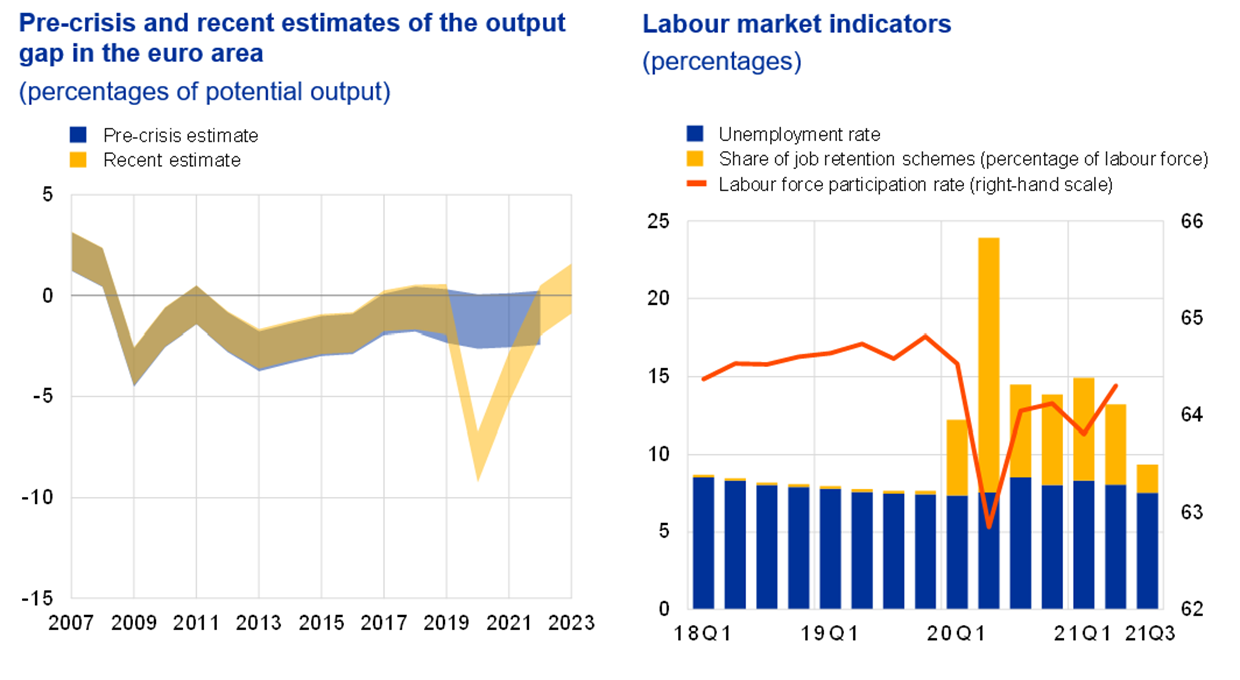
Left-hand panel. Sources: Eurostat, Deutsche Bundesbank, September NIPE and ECB staff calculations.
Note: The latest observations are for October 2021.
Right-hand panel. Sources: ECB calculations based on data from Eurostat, Federal Employment Agency Germany, ifo Institute Munich, Ministère du Travail, de l’Emploi et de l’Insertion, Instituto Nazionale Previdenza Sociale (INPS), and Ministerio de Inclusión, Seguridad Social y Migraciones.
Notes: The latest observations are for the third quarter of 2021 for Germany, Spain and France and the second quarter of 2021 for Italy for the number of workers in job retention schemes (JRS); the third quarter of 2021 for the unemployment rate; and the second quarter of 2021 for the labour force participation rate.
Chart 7
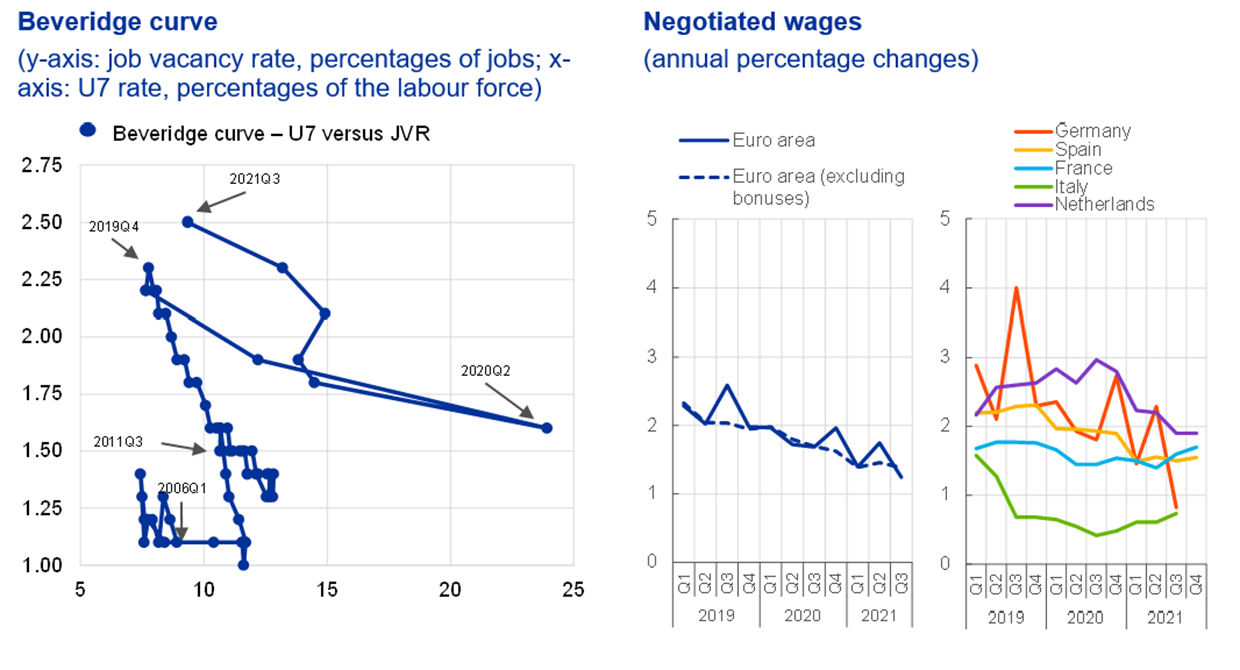
Left-hand panel. Sources: ECB calculations based on data from Eurostat, Federal Employment Agency Germany, ifo Institute Munich, Ministère du Travail, de l’Emploi et de l’Insertion, Instituto Nazionale Previdenza Sociale (INPS), and Ministerio de Inclusión, Seguridad Social y Migraciones.
Notes: The highlighted area marks the coronavirus (Covid-19) crisis period from the first quarter of 2020 to the second quarter of 2021. The latest observations are for the third quarter of 2021 for Germany, Spain and France and the second quarter of 2021 for Italy for the number of workers in job retention schemes (JRS); and the third quarter of 2021 for the unemployment rate and job vacancy rate.
Right-hand panel. Notes: The latest observations are for the third quarter of 2021 based on July and August data for the euro area and Germany, the third quarter of 2021 based on full quarter data for Italy and the fourth quarter of 2021 based on October data for Spain, France and the Netherlands.
Chart 8

Left-hand panel. Sources: Refinitiv, SPF and ECB calculations.
Notes: Average estimates based on two affine term structure models following Joslin, Singleton and Zhu (2011) applied to ILS rates adjusted for the indexation lag as in Camba-Mendez and Werner (2017). Survey expectations from the Survey of Professional Forecasters (SPF) refer to the point estimate and mean respectively of the reported probability distributions for year-on-year expectations five years ahead. The latest observations are for the fourth quarter of 2021 (SPF) and 19 November 2021 (market data, monthly model).
Right-hand panel. Sources: Refinitiv, Consensus Economics and ECB calculations.
Notes: Average estimates based on two affine term structure models following Joslin, Singleton and Zhu (2011) applied to ILS rates adjusted for the indexation lag as in Camba-Mendez and Werner (2017). The latest observations are for October 2021 (Consensus Economics) and 19 November 2021 (market data, monthly model).
Risks to economic activity
The downside risks to economic activity may be growing. We should monitor the risk that a long-lasting negative supply shock prevents the economy from reaching full capacity.
Globally, supply bottlenecks now appear to be slowing the recovery (Chart 9, left-hand side).[25] That drag is affecting forward-looking indicators of activity in the euro area, which are plateauing and in some cases already pointing downwards (Chart 9, right-hand side). It may soon become visible in actual GDP growth. Supply-side disruptions and the uncertainty regarding the economic outlook also look to be weighing on the already unsatisfactory recovery in investment in major economies (Chart 10, left-hand side).
In parallel, the rise in energy prices will likely pull back demand in the euro area: a 10% rise in oil prices typically reduces consumption by 0.28% over three years,[26] and oil prices have risen by around 60% in 2021.[27] Since energy demand has a low price elasticity,[28] this could spill over into lower spending on non-essential services.[29] In addition, rising energy prices may have important effects on firms’ employment decisions.[30]
Governments have adopted compensatory measures in the euro area – although with significant differences across countries – but they are likely to only partly offset the negative impact on real disposable income. And the lower income households, which spend most[31] on utilities, perceive those support measures to be the least adequate (Chart 10, right-hand side). The main offsetting factor will therefore need to come from continued improvements in the labour market and the underlying strength of the economy.
Finally, we should not forget that, regrettably, another major wave of infections is under way in the euro area, triggering renewed restrictions, some already introduced, with others potentially on the way. This could weigh on economic activity and, in particular, consumer confidence, further holding back wage demands.
So, if the sources of higher inflation today do last longer, there is little or no evidence at this stage to suggest that they would feed into wage-price spirals or a de-anchoring of inflation expectations in the euro area. There are, instead, signs that they could weaken the recovery and reduce underlying inflation pressures. And we should not forget that in the last decade insufficient domestic demand growth in the euro area resulted in inflation that was persistently below our aim and in the accumulation of a price level gap that remains significant (Chart 11).
All in all, on the basis of the available information, there seems to be little chance of sustained inflation above 2% in the medium term.
Chart 9
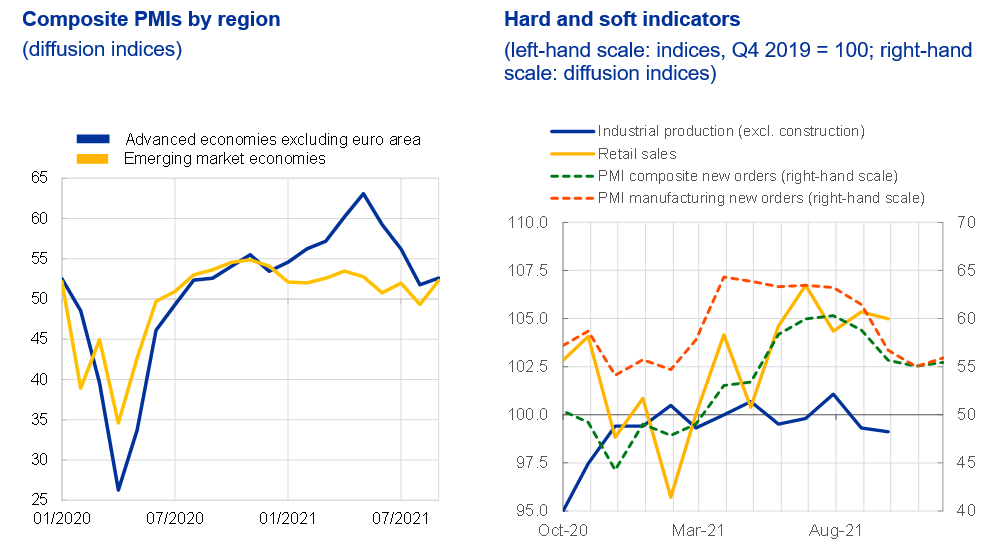
Left-hand panel. Sources: Markit and ECB calculations. Note: The latest observations are for September 2021.
Right-hand panel. Sources: Eurostat and Markit. Notes: September 2021 for industrial production and retail sales, November 2021 for PMI new orders.
Chart 10
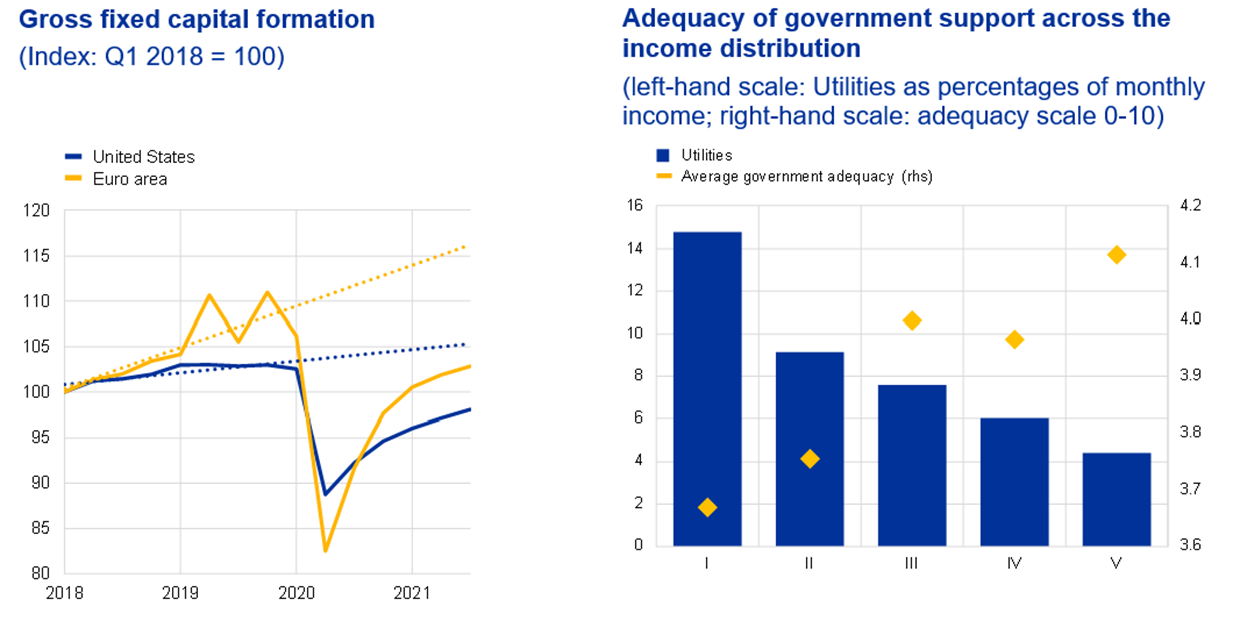
Left-hand panel. Sources: ECB and Federal Reserve System.
Right-hand panel. Sources: ECB Consumer Expectations Survey (CES) and ECB staff calculations.
Note: Utilities refers to the amount spent on utilities reported in July and October 2021 over the net monthly income. Net savings refers to the accumulated net savings from January 2020 to March 2021 over the net monthly income earned during the same period.
Chart 11 Harmonised Index of Consumer Prices (HICP)
(all-items, January 1999=100)
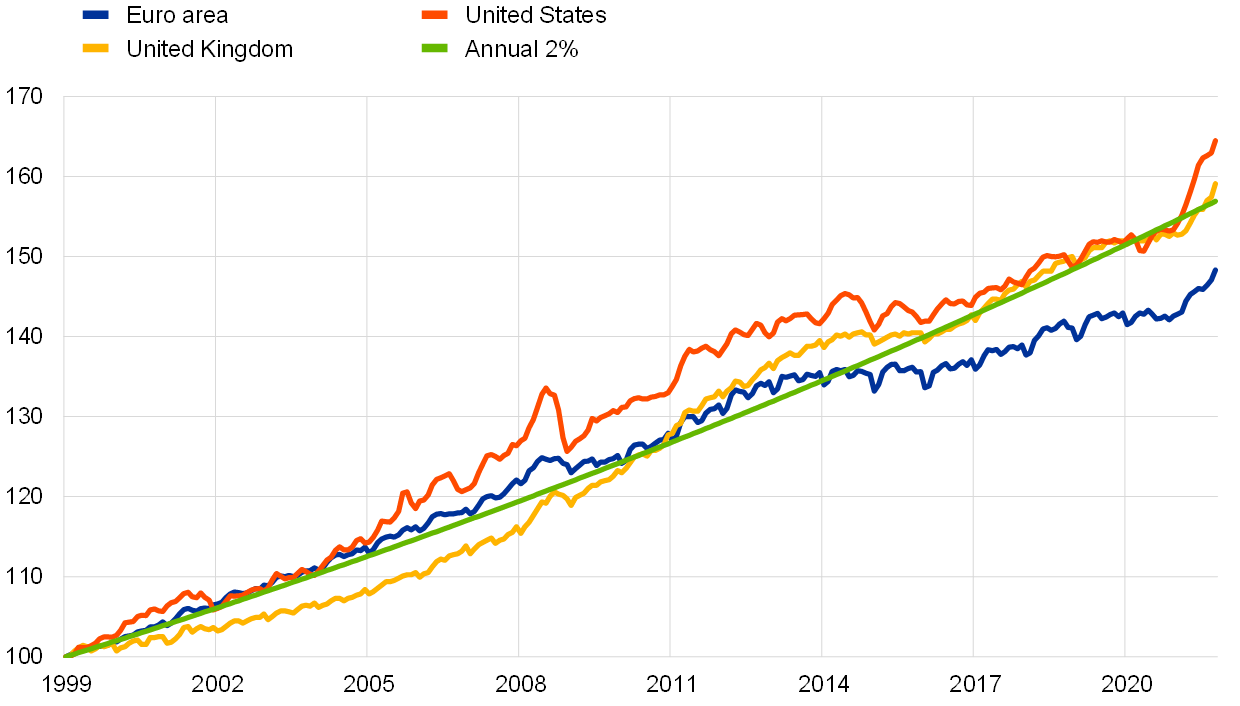
Source: Eurostat.
Outlook for monetary policy
What are the monetary policy implications of the medium-term picture?
Most importantly, we still need to complete the recovery. A major achievement of the European crisis response was to provide a common answer to a common shock. Now, we need common policies to support a common recovery, underpinning the sustained return of inflation to our target. Next Generation EU provides the fiscal support for the recovery, but continued monetary stimulus is necessary to cement progress. If we lose patience now, we will put at risk everything we have achieved so far.
Until we see tangible evidence that upside risks to medium-term inflation are materialising, we should continue to look through the current inflation spike. We should not be afraid of wage growth that is consistent with our inflation target. And we should not ignore risks on the downside, especially as we face an asymmetry of tools in reacting to negative shocks given the proximity of our policy rates to their effective lower bound.
Indeed, one of the main innovations of our strategy review is that, owing to this asymmetry, we need to be forceful and persistent in our monetary action to bring medium-term inflation sustainably to our target – even if it requires a moderate transitory overshoot.[32]
This persistence is reflected in our forward guidance on interest rates, which clarifies that until we see inflation lastingly reach 2% over the second half of the projection horizon, we will not start raising rates. Our forward guidance also includes sufficient realised progress in underlying inflation as a condition, precisely to ensure that on-target inflation will be durable and to look through supply shocks. That condition is not close to being met.
In the vicinity of the lower bound the stance of monetary policy is also defined by the volume and distribution of asset purchases, which help control benchmark rates at the longer end of the yield curve. Three observations matter here.
First, the surge in the number of infections and the renewed introduction of pandemic-related restrictions in some euro area countries mean that the pandemic is not over yet.
Second, an inappropriate, sharp reduction of purchases would be tantamount to a tightening of the policy stance. Net asset purchases will continue to be an essential ingredient of our monetary policy stance even if the pandemic emergency purchase programme comes to an end. They need to be calibrated to help ensure we reach our target, avoiding an undesirable, premature increase in long-term interest rates.
Third, so that we can continue to transmit our policy impulses across the entire euro area, the flexibility that has served us well in past months should become an integral element of our asset purchases.[33] This will enable us to act – if necessary – in an environment where the exit from the pandemic may have asymmetric effects. We should not tolerate any financial fragmentation which could impede the transmission of monetary policy throughout the euro area. We have learned from the past decade that this is crucial for price stability in a monetary union.
Conclusion
Let me conclude.
In Europe, we are no longer facing one-way inflation risks to the downside. This is to the credit of the successful macroeconomic response, of which monetary policy was a key component.
But now is not the time to be declaring victory. We should not be distracted by short-term volatility or transient factors related to the atypical economic situation we are seeing. Rather, based on empirical evidence, we must continually assess the underlying strength of the economy and the two-way risks created by supply shocks.
For now, our policy stance needs to remain focused – through all of our instruments – on the objective of ensuring a lasting return of inflation to our medium-term target of 2%. Only a determined and predictable policy that accompanies demand back to its pre-crisis trend will guarantee price stability in the medium term, in line with our mandate.
For monetary policy today, patience is the most courageous form of action.
- See Lagarde, C. (2021), “Commitment and persistence: monetary policy in the economic recovery”, Keynote speech at the 31st Frankfurt European Banking Congress 2021 “From Recovery to Strength”, 19 November.
- Evidence accumulated since 2003 suggests that nominal rigidities remain a prevalent feature of the euro area, with some differences as regards prices and wages. Price-setting may have become more flexible and there is no evidence for any especially strong downward rigidities in price-setting. At the same time, persistent downward nominal wage rigidity (DWR) provides a strong argument for a positive inflation buffer to “grease the wheels” of the euro area economy – also in order to avoid the risk of macroeconomic adjustments being managed in terms of quantities (unemployment) rather than prices when DWR is binding and particularly when productivity growth is low. See Consolo, A., Koester, G., Nickel, C., Porqueddu, M. and Smets, F. (2021), “The need for an inflation buffer in the ECB’s price stability objective – the role of nominal rigidities and inflation differentials”, Occasional Paper Series, No 279, ECB, September.
- Panetta, F. (2021), “Mind the gap(s): monetary policy and the way out of the pandemic”, Speech at an online event organised by Bocconi University, 2 March.
- In its recent review of the monetary policy strategy of the ECB, the Governing Council confirmed the medium-term orientation of its strategy and acknowledged that the appropriate monetary policy response to a deviation of inflation from the target depends on the origin, magnitude and persistence of the deviation.
- Base effects are statistical effects with a temporary impact on inflation. For example, to stimulate demand during the pandemic, German VAT rates were temporarily reduced in July 2020. The subsequent normalisation of (increase in) VAT rates in January 2021 led to a temporary increase in annual HICP inflation in the second half of the year equal to approximately 1.2 percentage points for Germany and 0.35 percentage points for the euro area as a whole. This base effect will be reabsorbed from January 2022.
- According to ECB staff estimates, energy is the main reason for the higher-than-projected headline inflation seen in recent months.
- The previous high was 1.67 percentage points in July 2008.
- More domestically-generated inflation refers to the items in the HICP that are characterised by a direct and indirect import content in consumption expenditure of less than 15%. See Fröhling, A., O'Brien, D. and Schaefer, S. (2021), “A new measure for domestic inflation in the euro area”, mimeo.
- See Bokan, N., Dossche, M. and Rossi, L. (2018), “Oil prices, the terms of trade and private consumption”, Economic Bulletin, Issue 6, ECB.
- The mechanism described in the text applies mainly to non-energy industrial goods but also to services. In addition, base effects related to the negative inflation in some sectors during the pandemic are also affecting services price inflation.
- See also Moëc, G. (2021), “Second-guessing the second-round effects”, AXA IM Research and Strategy Insights, No 108, 11 October.
- The euro area flash manufacturing PMI for November showed a record build-up of warehouse stocks for the second month running as firms increased their efforts to build precautionary stocks in response to ongoing shortages and lengthy lead times.
- See also Panetta, F. (2021), “Monetary autonomy in a globalised world”, Welcome address at the joint BIS, BoE, ECB and IMF conference on “Spillovers in a “post-pandemic, low-for-long” world”, Frankfurt am Main, 26 April.
- Workers in job retention schemes who do not work for more than three months are not considered employed. As many workers in job retention schemes do actually work, the figures on employment include some of the workers covered by job retention schemes.
- Based on data for the second quarter of 2021.
- In particular, the pandemic has led to a decline in the participation rate of older workers, who contributed most to the upward trend in labour participation in the euro area before the pandemic. See Bodnár, K. and O’Brien, D. (2021), “Labour supply developments in the euro area during the COVID-19 pandemic”, Economic Bulletin, Issue 7, ECB.
- The Beveridge curve captures the negative relationship between the unemployment rate and the job vacancy rate. The underlying intuition is that, as vacancies (vacant job positions) increase, the number of people unemployed decreases. The shape and the position of the curve also provide important information about the functioning of the labour market. See Consolo, A. and Dias da Silva, A. (2019), “The euro area labour market through the lens of the Beveridge curve”, Economic Bulletin, Issue 4, ECB.
- See Blanchard, O.J. and Diamond, P., “The Beveridge Curve”, Brookings Papers on Economic Activity, Vol. 1989, No 1, 1989, Washington DC, pp. 1-76.
- In addition, the likelihood of wage-setting schemes triggering second-round effects based on inflation indexation looks to be limited, particularly when it comes to energy inflation. See Koester, G. and Grapow, H. (2021), “The prevalence of private sector wage indexation in the euro area and its potential role for the impact of inflation on wages”, Economic Bulletin, Issue 7, ECB.
- See Chen, A., Engstrom, E. and Grishchenko, O. (2016), “Has the inflation risk premium fallen? Is it now negative?”, FEDS Notes, , April.
- Evans, C. and Fisher, J. (2011), “What are the implications of rising commodity prices for inflation and monetary policy?”, Chicago Fed Letter, No 286, May.
- A one-off catch-up in wages is a phenomenon that is likely to arise. Ultimately the terms of trade “tax” determined by higher energy prices – to the extent that it is not sterilised by public interventions – will have to be absorbed by the factors of production (labour and capital, through wages and profits) in proportions that depend on the respective bargaining power in the labour market.
- Unit labour costs are compensation per employee adjusted for productivity.
- After the pandemic, productivity might increase owing to conjunctural factors (productivity is typically procyclical) or structural adjustments, for instance as a result of higher levels of digitalisation.
- ECB estimates find that the supply shocks that have emerged since October 2020 have slowed down world exports by almost 3 percentage points since October 2020 and industrial production by more than 1 percentage point. See Frohm, E., Gunnella, V., Mancini, M. and Schuler, T. (2021), “The impact of supply bottlenecks on trade”, Economic Bulletin, Issue 6, ECB. Given the euro area’s deep integration into global value chains, these supply shocks weigh on euro area activity more than that of the rest of the world.
- Relative to the baseline without an oil price shock.
- Average of the elasticities used in the ECB-BASE model and the New Multi-Country Model. These elasticities are based on oil prices increasing 10% from EUR 55 per barrel. Brent crude was USD 51.09 on 31 December 2020.
- See Labandeira, X., Labeaga, J.M. and López-Otero, X. (2016), “A meta-analysis on the price elasticity of energy demand”, EUI Working Papers, No 2016/25, Robert Schuman Centre for Advanced Studies, European University Institute.
- Evidence from the ECB’s Consumer Expectations Survey shows that households which perceive government support measures aimed at easing the burden of higher energy prices to be less adequate have also revised down their expected spending on holidays over the next year.
- Recent evidence finds that rising electricity prices negatively impact employment, with the impact unevenly distributed across sectors and countries and more pronounced for financially constrained firms. See Bijnens, G., Hutchinson, J., Konings, J. and Saint Guilhem, A. (2021), “The interplay between green policy, electricity prices, financial constraints and jobs: firm-level evidence”, Working Paper Series, No 2537, ECB, April. .
- As a share of their income.
- Our strategy review recognises that we are well- equipped to deal with risks on the upside, but in a situation where growth weakens and inflation undershoots our target over the medium term, the effective lower bound would limit our policy space. See Bianchi, F., Melosi, L. and Rottner, M. (2021), “Hitting the Elusive Inflation Target”, NBER Working Paper, No 26279, September.
- See also Panetta, F. (2021), “Monetary-fiscal interactions on the way out of the crisis”, Keynote speech at the Conference of the Governors of Mediterranean Central Banks on “Central banks at the frontline of the COVID-19 crisis: weathering the storm, spurring the recovery”, 28 June.
Evropská centrální banka
Generální ředitelství pro komunikaci
- Sonnemannstrasse 20
- 60314 Frankfurt am Main, Německo
- +49 69 1344 7455
- media@ecb.europa.eu
Reprodukce je povolena pouze s uvedením zdroje.
Kontakty pro média-
24 November 2021