Economic and monetary policy in EMU: from unconventional times to sustainable and balanced growth
Speech by Peter Praet, Member of the Executive Board of the ECB, at the OECD Chief Economist Talks, Paris, 3 May 2018
Euro area real GDP has now been expanding for five years.[1] The latest incoming information points towards some moderation in the pace of economic growth, in part reflecting a pull-back from the high growth rates observed at the end of last year. Temporary factors may also be at work. We will also need to monitor whether, and if so, to what extent, these developments reflect a more durable softening in demand.
The latest economic data and survey results have generally surprised to the downside, suggesting some loss of momentum in economic activity. This slowdown follows a very strong 2017, with the latest national accounts release showing that quarterly GDP growth in the fourth quarter of 2017 stood at 0.7% quarter on quarter, the same growth rate as in the two previous quarters.
A deceleration from the exceptionally high growth rates observed in the second half of 2017 had been expected. However, the slowdown has come sooner than anticipated. The downward surprise in incoming information has been broad-based, as it can be observed in both hard data and survey indicators across most sectors and countries.
While the overall slowdown in recent economic indicators has been significant, transitory factors are likely to have played a role. These exceptional factors include the cold weather conditions, influenza, the timing of Easter and school holidays, and industrial strikes in some countries. These developments may have been particularly relevant for the retail and construction sector. In addition, concerns about trade protectionism may also have dampened business sentiment and expectations.
Nevertheless, the recent slowdown could also be a sign that supply-side constraints are becoming increasingly binding, albeit only in some sectors and in some countries. For instance, in the capital goods sector, capacity utilisation and backlogs/supply delivery times stand at all-time highs. Whereas in the construction sector, an increasing number of firms are indicating that a shortage of labour is limiting their production.
While these factors are likely to hold back economic activity in the near term, recent information remains consistent with a solid and broad-based expansion in domestic demand. Sentiment indicators remain in expansionary territory and are still well above long-term averages for most sectors and countries. Moreover, the underlying momentum is still supported by favourable financing conditions, a robust labour market and steady income and profit growth.
Finally, signs that the past euro appreciation is dampening export growth remain limited. Extra-euro area export growth slowed down in the first two months of the year, albeit from very high levels. Moreover, over the same period, extra-euro area industrial new orders continued to expand. At the same time, the sharp decline in some sentiment indicators relating to the export sector is a source of concern. It lends support to the view that risks relating to global factors – including the threat of increased protectionism – have become more prominent.
Inflation developments, however, remain subdued, and we have not yet met the Governing Council’s three criteria – convergence, confidence and resilience – for a sustained adjustment in the path of inflation, which is our stated condition for ceasing our net asset purchases. Overall, an ample degree of monetary stimulus remains necessary for underlying inflation pressures to continue to build up and support headline inflation developments over the medium term. Hence, we must be patient, persistent and prudent in our monetary policy.
The financial crisis that erupted in 2008 posed unprecedented challenges for central banks across the world in the pursuit of their statutory mandates. A main feature of central banks’ response to the crisis was the deployment of additional, and in some cases novel, monetary policy instruments. One of these instruments was what’s known as “quantitative easing”. In the case of the euro area, this tool has not been used in isolation, but rather as part of a comprehensive package of complementary measures taken to combat the disinflationary forces that intensified in mid-2014. Our monetary policy has effectively contributed to euro area macroeconomic adjustment through the staunch pursuit of our price stability mandate.
Today I will first look at the impact of our policies on financial conditions and macroeconomic variables over the past few years, to illustrate their beneficial effect on the euro area economy. The correct measure of the efficacy of unconventional monetary policy measures has been the subject of some debate in recent times. In particular, the durability of the imprint that such unconventional policies have left on financial conditions has been called into question. Overall, diverse empirical approaches to quantifying the impact of our package of measures support the same conclusion: the actions we took have had a strong and lasting effect on market conditions, and more importantly, achieved a potent pattern of propagation to the broad economy. We cannot yet declare “mission accomplished” on the inflation front, but we have made substantial progress on the path towards a sustained adjustment in inflation.
Monetary policy, however, is only one side of the story. Price stability is a necessary, but not a sufficient condition for sustained and balanced growth in Europe. The run-up to the crisis proved that macroeconomic imbalances can grow amid price stability (see Charts 1 and 2), highlighting the need to keep economic policy high on Europe’s agenda.
Chart 1: Price level
(1999m1=100, trend= year-on-year HICP inflation at 2%)

Sources: Eurostat and ECB calculations.
Latest observations: March 2018 (monthly data).
Chart 2: Current account
(as % of GDP)
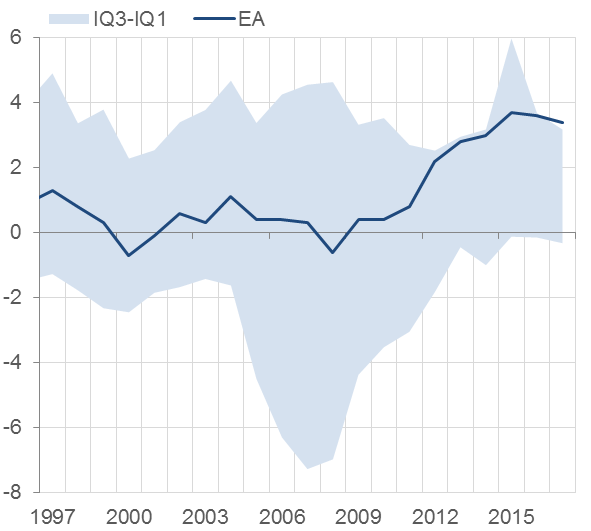
Sources: OECD and ECB calculations.
Note: The grey shaded area shows the 25-75% range among euro area aggregate (EA12) countries.
Latest observations: 2017 (annual data).
In the second part of my talk I will therefore concentrate on economic policies and their essential role in ensuring a smooth functioning of Economic and Monetary Union (EMU). I will look back at the experience of the euro area since 1999 and illustrate the emergence of macroeconomic imbalances by focusing on three countries: Spain, Germany and France.
The crisis acted as a litmus test for Europe’s institutional framework, revealing the need for a number of institutional reforms. Lessons have been learned and significant progress towards strengthening EMU has been achieved, including elevating the responsibility of banking supervision from the national to the European level, the creation of the European Stability Mechanism as a permanent crisis management institution, and improvements in the EU surveillance framework for economic policies.[2] Progress towards completing the banking union and the capital markets union has rightly emerged as one of the immediate priorities in strengthening EMU,[3] not least as such progress is seen as crucial in supporting macroeconomic adjustment in a monetary union.
Today it is fair to say that the euro area has lived up to the challenges posed by the existential crisis and euro area countries have displayed a strong commitment to EMU. Macroeconomic adjustment in EMU has made significant progress, with countries implementing significant growth-enhancing reforms and correcting external imbalances, but this process has been difficult and is not yet complete. Countries most affected by the crisis were confronted with significant hardship, even though financial support provided by the EU and its Member States to countries facing acute financing difficulties prevented catastrophic outcomes, and cushioned some of its impact by providing time for economic adjustment. Looking forward, in order to sustain a high level of social welfare in the long term, euro area countries need to ensure that macroeconomic adjustment occurs smoothly and to prevent the build-up of durable imbalances.
The impact of the ECB’s non-standard measures
By mid-2014, the euro area economy was facing disinflationary pressures that risked spiralling into outright deflation. With the deposit facility rate held at zero since July 2012, our ability to provide the necessary degree of monetary stimulus using conventional policy measures was very limited.
Under these conditions, the focus of providing monetary accommodation shifted from an approach based on adjusting key ECB interest rates to one that more directly affects the whole constellation of interest rates across the yield curve. Specifically, the instruments we have employed since June 2014 are negative interest rates on the deposit facility; a reinforced form of forward guidance on the evolution of key interest rates in the future; targeted longer-term refinancing operations (TLTROs); and the asset purchase programme (APP).
With policy rates at exceptionally low levels, the APP soon became the primary instrument for calibrating the monetary policy stance. How effective have our asset purchases been in helping the ECB to accomplish its statutory objective in the medium term? Answering this question is inherently difficult because of the complex interaction of our APP with other policy instruments as well as our evolutionary communication about the purchase programme, through which we signalled our intention to start buying bonds and, later, to recalibrate the size and duration of our bond-buying programme in advance. Hence, in assessing the impact of the APP, we must also take into account the other policy tools used since mid-2014, because the instruments were designed to be complementary and mutually reinforcing.
The four instruments that have determined the stance of our monetary policy since mid-2014 have been designed to reap the full benefits of their complementarities. Two examples highlight the role played by complementarities in policy design. First, the negative interest rate policy has supported the portfolio rebalancing channel of our APP by encouraging banks to lend to the broad economy instead of hoarding liquidity.[4] Second, the APP has supported rate forward guidance through the signalling channel. Generally, asset purchases are thought to provide a strong signal that policy rates will remain low for an extended period of time. For the ECB, this effect is reinforced by the sequencing of our instruments through which we have indicated that our policy rates will likely remain at their current levels “well past the horizon of our net asset purchases”.
Our overall assessment – and that of a growing body of empirical literature – is that non-standard measures have had a sizeable and lasting impact on broad financing conditions.[5] These improvements are not limited to the asset classes included in our APP, but have spilled over to other market segments (Charts 3 and 4). In addition, easier market funding conditions have been passed through to bank lending rates.[6] Importantly, these findings are based on a range of econometric techniques and are therefore robust to the limitations associated with any individual methodology.
Chart 3: Term structure of interest rates (percentages per annum)
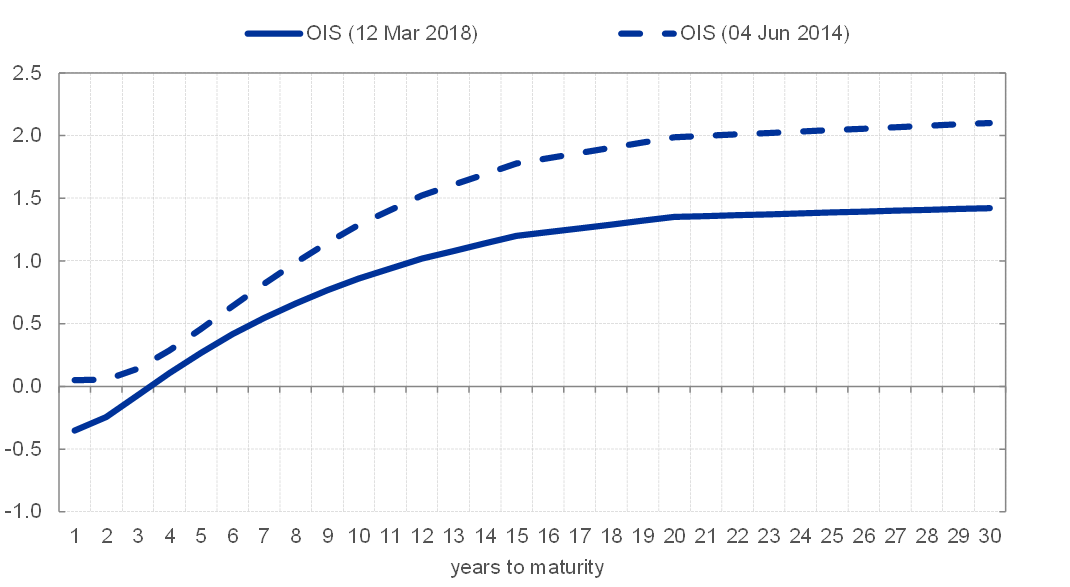
Sources: Bloomberg, ECB, ECB calculations. Latest observation: 7 March 2018.
Chart 4: Impact of ECB measures on key financing conditions (contributions in basis points and percent)
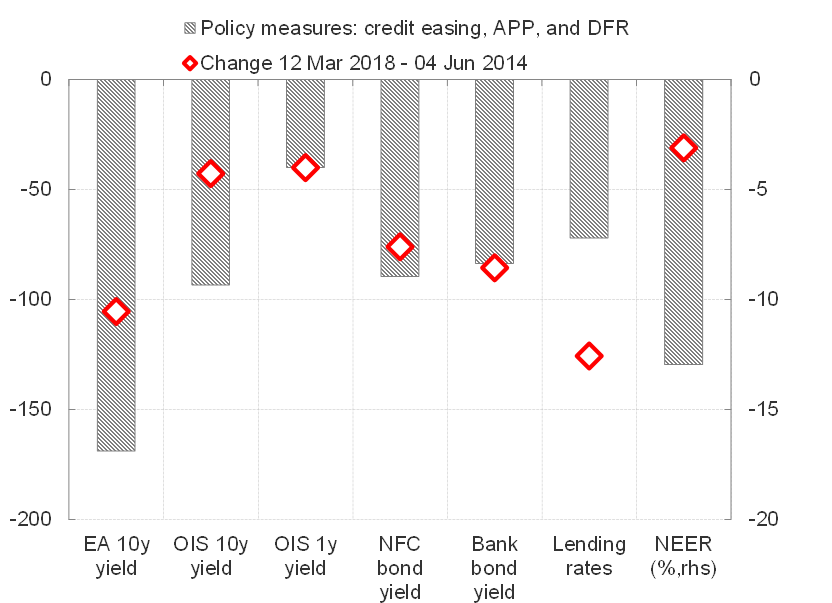
Sources: ECB, ECB calculations.[7]
Event studies – which measure the impact of central banks’ bond purchases in a narrow interval around the time of the announcement – play a part in informing our view on the efficacy of our purchases. But we also use model counterfactuals to complement the impact metrics that we derive from event studies, and to test whether or not the impact of our announcements endures beyond the very short term. In this context, dynamic term structure models of the type that have become standard in contemporary fixed income finance, augmented with a factor capturing central bank bond holdings, have consistently confirmed the inference we draw from event studies. They indicate that our purchases have had a sizeable and durable influence on long-term yields.[8]
At present, the current and anticipated size of our APP portfolio – which has been increased in various recalibration steps and is expected to be maintained “for an extended period of time” after the end of net asset purchases – is still putting downward pressure on euro area long-term yields. The longer the expected period of reinvestment, the stronger the downward pressure on yields. If one takes current surveys of market participants’ views about the time over which the ECB is anticipated to roll over its APP securities, and assumes the modal expectation of a two-year period, one finds that the downward pressure that APP asset holdings – current and expected – are exerting on longer-term interest rates is in the order of 100 basis points (Chart 5).
Chart 5: Reinvestments as an ongoing source of monetary policy support
Panel A: Expected reinvestment horizon after net asset purchases (percent of respondents)

Source: Bloomberg (2 March 2018). Note: Answers from 48 respondents to the question “How Long for Reinvestments After End of Asset Purchases”.
Panel B: Estimated effect on euro area ten-year term premium of APP for different reinvestment scenarios (basis points)
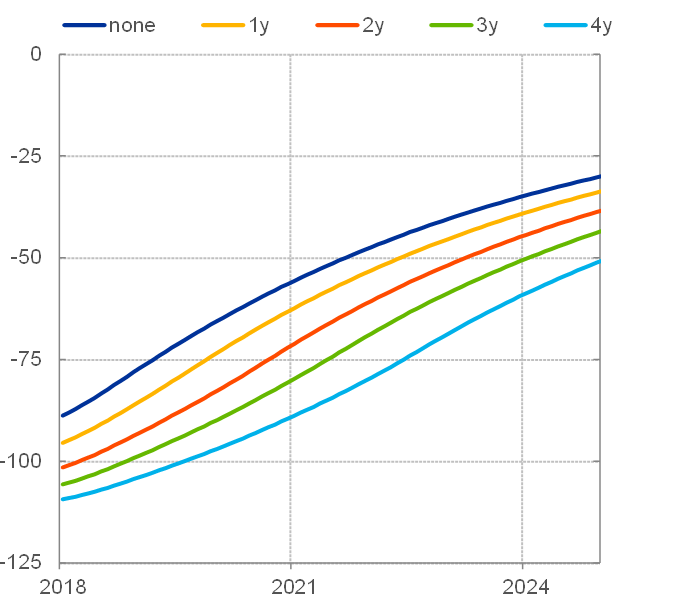
Source: Eser, Lemke, Nyholm, Radde, and Vladu (mimeo).[9]
Downward pressure on yields is expected to be very persistent and to decline only gradually, but consistently, as we move forward in time, because of what is referred to as the “portfolio ageing” effect. The effects of our purchases of long-dated assets on market yields are principally due to the fact that we withdraw duration from private hands, and as the securities we hold in our portfolio draw closer to maturity and “lose duration” progressively, the overall amount of duration contained in our portfolio has a tendency to melt away. And this gradual loss of duration will reduce downward pressure on yields (see Chart 5, Panel B).[10]
There has been a strong pass-through of our non-standard measures to financing conditions. For example, model-based counterfactual simulations attribute more than half of the 126 basis point decline in lending rates to non-financial corporations since June 2014 directly to our non-standard measures (see Chart 4). The APP has supported the provision of loans to customers at better terms and conditions.[11] Banks themselves – when asked to assess the effects of our measures on their intermediation business – have reported that the APP has positively impacted their market financing conditions.
As a consequence of this generalised easing in financing conditions, our measures have had substantial macroeconomic effects. Taking into account all of the monetary policy measures taken between mid-2014 and October 2017 and the March 2018 ECB staff macroeconomic projections, staff have estimated that the overall impact on both growth and inflation in the euro area is around 1.9 percentage points in cumulative terms for the period between 2016 and 2020. Importantly, our measures have also been successful in reducing the fragmentation of the euro area financial system stemming from the sovereign debt crisis. They have ensured very favourable borrowing conditions in the euro area as a whole.
To sum up, the available evidence strongly supports the conclusion that the APP – together with our other non-standard measures – has been effective and probably decisive in warding off troublesome macroeconomic outcomes. It has certainly propelled the economic recovery into a robust and broad-based expansion. And it has very likely prevented the disinflationary pressures of 2014 from spiralling into a self-reinforcing deflationary vortex (see Chart 6). We cannot yet declare “mission accomplished” on the inflation front, but we have made substantial progress on the path towards a sustained adjustment in inflation.
Chart 6: Probability density functions (PDF) of euro area inflation
Panel A: Option-implied PDF of euro area inflation over the next two years
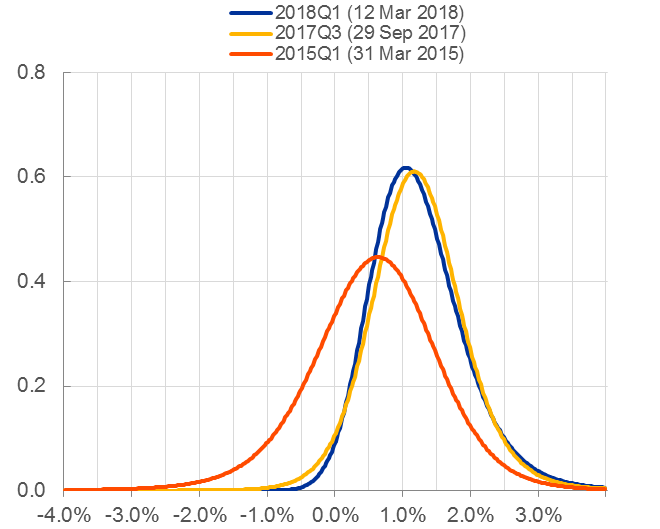
Sources: Bloomberg, Reuters, ECB calculations.[12]
Panel B: Survey-implied PDF of euro area inflation in two years’ time

Source: ECB Survey of Professional Forecasters.
The emergence of macroeconomic imbalances
Monetary policy has been very successful in supporting domestic demand and inflation, but it cannot address the structural problems that were at the root of the crisis. Monetary policy was able to buy time to facilitate the adjustment of macroeconomic imbalances and to address the deficiencies in the euro area’s institutional framework.
The crisis has demonstrated how persistent losses in competitiveness can translate into macroeconomic imbalances, eventually leading to a painful adjustment. Spain’s experience during the crisis is instructive in this regard.
With the start of Monetary Union, the disappearance of exchange rate risk premia and the unprecedented fall in interest rates facilitated capital inflows and encouraged risk-taking behaviour, resulting in a rapid rise in private debt and a property boom. The expectation of higher levels of income led to excessive consumption and investment relative to the supply capacity of the Spanish economy. This continuous demand pressure generated a positive inflation differential vis-à-vis the rest of the euro area, leading to a strong appreciation of the real exchange rate and an erosion of price competitiveness.[13]
When the crisis hit, the subsequent adjustment was severe – with unemployment at levels above 25%, a rapid erosion of the fiscal position and a number of bank failures – leading to a significant contraction in both domestic demand and real GDP. Similar developments were observed in other current account deficit countries, such as Portugal, Ireland and Greece.
For countries with large current account deficits, the adjustment was painful. The correction of euro area macroeconomic imbalances was particularly asymmetric, with the bulk of the adjustment falling on current account deficit countries through a strong contraction in domestic demand, with limited support from a higher demand contribution from current account surplus countries, despite those countries being less affected by the crisis. Growth in the surplus countries, including Germany, became even more export-oriented.
An important lesson from the crisis was that the euro area had insufficient tools at its disposal to, on the one hand, prevent the build-up of unsustainable asset price booms and, on the other hand, mitigate their impact if they occured. The answer to such problems lies, ex ante, in better macroprudential and microprudential policies and better regulation of the financial system and, ex post, in better resolution institutions. Strengthening Europe’s financial framework, including the establishment of the banking union, is the right way to address this source of macroeconomic imbalances. The banking union will make the adjustment process less asymmetrical between creditors and debtors. It is of the utmost importance to complete the banking union without delay.
Macroeconomic imbalances in the euro area can also be attributed to factors other than the financial cycle, such as durably diverging competitiveness positions. The importance of such economic factors already featured prominently in the theory of optimal currency areas, as pioneered by Mundell in 1961. Competitiveness imbalances are one of the most visible symptoms of insufficient macroeconomic adjustment mechanisms in the euro area.[14] Developments in Germany and France – two countries which together represent nearly half of euro area GDP, and have seen broadly similar movements in GDP and prices (see Charts 7 and 8) since the start of Monetary Union – are instructive in this regard.
Chart 7: Price level
(1999=100)

Sources: AMECO and ECB calculations.
Latest observations: 2017 (annual data).
Chart 8: Domestic demand and GDP
(1999 Q1=100)

Sources: Eurostat and ECB calculations.
Note: DD stands for domestic demand.
Latest observations: Q4 2017 (quarterly data).
Germany, at the start of Monetary Union, was considered the “sick man of Europe”. At the time, the country was still recovering from the high costs associated with its reunification, and its conversion rate was widely considered to be overvalued.[15] The national policy response was a prolonged period of union-backed wage moderation[16] together with a significant labour market overhaul which aimed, among other things, to improve job search efficiency and employment flexibility.[17] The result was striking: from 1999 to 2008, nominal unit labour costs were virtually unchanged for the economy as a whole (see Chart 9) and were thus growing significantly below the level that the so-called “golden wage rule” would suggest.[18] This resulted in a strong export performance, but weak domestic demand. The economic policies Germany pursued before the crisis largely explain why it emerged relatively unscathed from the Great Recession. Exports recovered swiftly and currently stand at an all-time high, roughly equalling half of the country’s GDP. Exports to countries outside the euro area recovered particularly strongly. Meanwhile, the contribution of domestic demand to GDP continued on its downward path, in part on account of subdued wage growth and a tight fiscal policy (see Chart 12).
Chart 9: Unit labour costs
(1999=100)
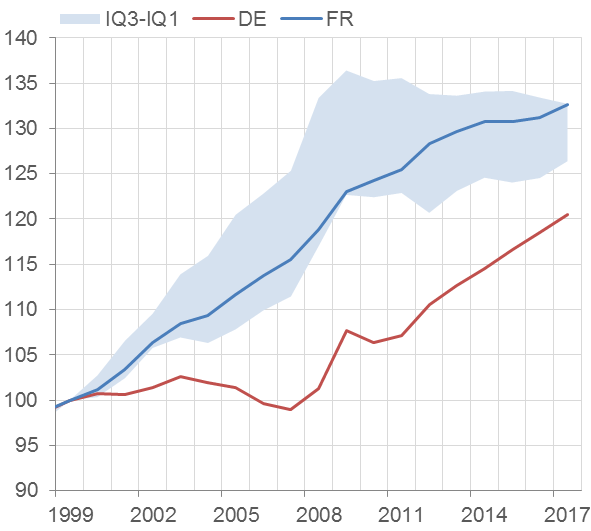
Sources: Ameco and ECB calculations.
Note: The grey shaded area shows the 25-75% range among EA12 countries.
Latest observation: 2017 (annual data).
Chart 10: World export market shares
(Goods, 1999=100)
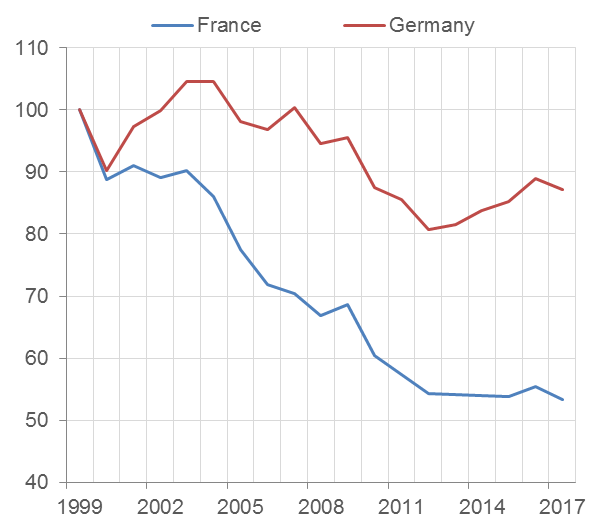
Sources: IMF DOTS and ECB calculations.
Note: World export market share calculated as the share of a country’s exports in world exports.
Last observation: 2017 (annual data).
In contrast to Germany, France entered Monetary Union in much better shape. Growth in the initial years was strong and unemployment declined by more than a fourth within five years.[19] Wage increases remained moderate, even below euro area averages, and unit labour costs moved according to the golden wage rule, i.e. at an average annual rate below, but close to, 2% (see Chart 9). However, with German unit labour costs remaining virtually unchanged over the period, a significant competitiveness gap built up. This was further aggravated by the crisis, during which French wages remained relatively sticky, in spite of the sharp fall in productivity.[20] The consequences were especially detrimental for the French export sector, which suffered significant losses in market share (see Chart 10), despite the substantial squeeze in profit margins. At the same time, the contribution of domestic demand to growth became increasingly important, supported by fiscal policy (see Chart 11) and sticky wage developments.
Chart 11: France: net lending/borrowing
(as % of GDP)

Sources: Eurostat and ECB calculations.
Note: Data refers to four quarter sums.
Latest observation: Q3 2017.
Chart 12: Germany: net lending/borrowing
(as % of GDP)

Sources: Eurostat and ECB calculations.
Note: Data refers to four quarter sums.
Latest observation: Q3 2017.
As a result, there is now a striking divergence between France and Germany on a number of macroeconomic dimensions: in Germany, the domestic demand-to-GDP ratio is now among the lowest across advanced economies, whereas in France, it is among the highest. The opposite is true for exports (see Charts 13 and 14).
Chart 13: Domestic demand
(as % of GDP)

Sources: Global Financial database, Eurostat and ECB calculations.
Note: The shaded area shows the 25-75% interquartile range (IQ3-IQ1) of the following countries: AT, DE, BE, FR, IT, ES, PT, EL, NL, FI, US, UK, SE, JP, CA, AU, DK, NO, CH. Latest observation: 2017.
Chart 14: Exports
(as % of GDP)
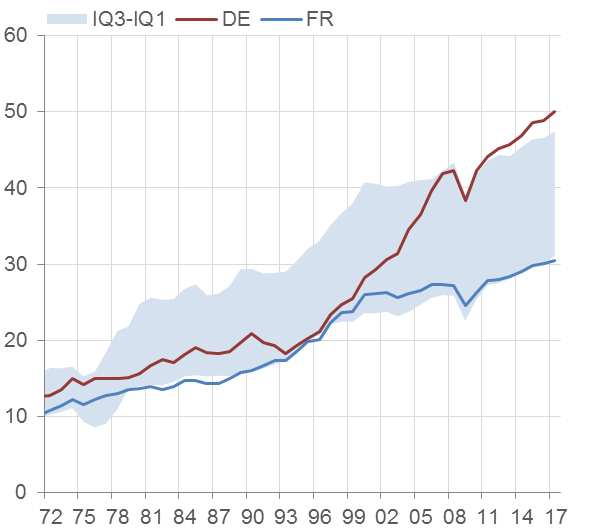
Sources: Global Financial database, Eurostat and ECB calculations.
Note: The shaded area shows the 25-75% interquartile range (IQ3-IQ1) of the following countries: AT, DE, BE, FR, IT, ES, PT, EL, NL, FI, US, UK, SE, JP, CA, AU, DK, NO, CH. Latest observation: 2017.
The recent economic policy orientations and plans set out by the German and French authorities are steps in the right direction. France has already, in recent years, made important progress in addressing these challenges. For example, the European Commission considers that the country has made at least some progress in addressing 72% of its country-specific recommendations since 2011. Substantial progress has been achieved in decreasing the cost of labour and reforming labour laws. There has also been significant progress in implementing reform recommendations related to the long-term sustainability of public finances, skills and lifelong learning, and the business environment.[21] These reforms, together with those that are still planned, could yield sizeable growth benefits and improve competitiveness. These recent developments give reason to hope that cross-country interdependencies within Monetary Union will be better internalised in national decision-making processes.
Some lessons for the future
Our monetary policy measures are bearing fruit, and the growth outlook confirms our confidence that inflation will converge towards our aim of below, but close to, 2% over the medium term.
Monetary policy alone cannot prevent the build-up of divergences in a monetary union. The nature of EMU makes macroeconomic adjustment in the euro area more complex than in a federal state. Monetary policy is a competence assigned at EU level. The European Central Bank’s price stability objective is enshrined in the Treaty.[22] By contrast, economic policy remains in the remit of Member States.[23] It is, however, a Treaty obligation for Member States to regard their economic policies as a matter of common concern and to coordinate them.
Our framework for the coordination of economic policies was clearly not effective in preventing the emergence of lasting imbalances in the euro area in the run-up to the crisis. Protracted losses in competitiveness eventually led to unsustainable external positions and even “sudden stops” in the financing of external deficits. This is not new. Unfortunately, we can point to several episodes in history when governments and social partners failed to internalise external constraints, resulting in widening imbalances. This typically led to currency crises and exchange rate realignments in Europe. Monetary instability prevented Europeans from reaping the full benefit of the internal market and limited Europe’s growth potential and its role as a global economic actor.
In our institutional framework for economic policies, it is primarily up to the Member States to respond to the economic challenges they are faced with, thereby ensuring that their economic structures are compatible with participation in Monetary Union. To reap the full benefit of Monetary Union, it is essential to ensure that national economic policies lead to sustainable growth. Preventing the emergence of economic imbalances and creating the conditions for a thriving social market economy is not only a matter of national interest. It is also a matter of common concern, as a crisis in one country has repercussions for all members of Monetary Union. Effective surveillance is indispensable at both EU and national level.
Looking ahead, we need to further enhance the coordination of national economic policies. National economic policies, the effects of which can propagate through the EU, should genuinely be considered a matter of common concern by national authorities. At the European level, a key role can be played by the European Semester process for the coordination of economic policies – including the macroeconomic imbalance procedure – which was introduced by the EU in 2011.[24] However, it should be used to its full potential. Moreover, for reform recommendations to be implemented at the national level and not be considered as illegitimate external constraints, it will thus be key going forward for national debates and decision-making processes to more fully internalise what it means to be part of Monetary Union. If outside recommendations are perceived as being politically too costly, then we need to find solutions that promote national “ownership” of reform efforts.
Monetary policy and sound economic policies must be complemented with sound financial sector policies to ensure sustainable growth. The recent crisis has shown that the quality of financial integration matters. Risk sharing through the financial system can go into reverse, and banks can amplify and propagate rather than mitigate economic disturbances. This was a painful but well-learned lesson for the euro area. It is the reason that the banking union was established and the capital markets union was launched.
Substantial progress has already been made. The EU moved in less than five years from decentralised banking supervision and resolution to the Single Supervisory Mechanism and the Single Resolution Mechanism, based on the single rulebook. This is part of an overarching effort to create a sound institutional framework for financial integration in Europe.
However, the work needs to be completed so that we can reap the full benefits of the banking union and the capital markets union. An incomplete banking union may not be able to shield the euro area from financial re-fragmentation in a renewed crisis situation. Likewise, an incomplete capital markets union may impair the capacity of the financial system to share risks across Member States through private channels. The missing elements of the banking union, namely the establishment of a European deposit insurance scheme and a backstop to the Single Resolution Fund, should be put in place without delay. This should go hand in hand with further progress in areas of key relevance for the banking union, including progress towards harmonising and improving national insolvency frameworks, reducing non-performing loans and strengthening the single rulebook.
[1] This speech builds on both my speech at the ECB and its Watchers XIX Conference and my speech at the NABE Symposium.
[2] The “two-pack” and “six-pack” legislative packages, which bundle together six regulations and one directive, aim to more closely coordinate economic policies through (i) a strengthening of budgetary surveillance under the Stability and Growth Pact, (ii) the introduction of a new procedure in the area of macroeconomic imbalances, (iii) the establishment of a framework for dealing with countries experiencing difficulties with financial stability and (iv) the codification in legislation of integrated economic and budgetary surveillance in the form of the European Semester (see, for instance, https://eur-lex.europa.eu/legal-content/EN/TXT/?uri=CELEX%3A52014DC0905 ).
[3] See, for instance, https://ec.europa.eu/commission/news/reducing-risk-banking-union-2018-mar-14_en.
[4] Praet, P. (2017), “Calibrating unconventional monetary policy”, speech at The ECB and its Watchers XVIII Conference, Frankfurt am Main, 6 April.
[5] For a summary of the literature on the effectiveness of non-standard measures, see ECB (2017), “Impact of the ECB’s non-standard measures on financing conditions: taking stock of recent evidence”, Economic Bulletin, Issue 2.
[6] See also Praet, P. (2017), “The ECB’s monetary policy: past and present”, speech at the Febelfin Connect event, Brussels/Londerzeel, 16 March.
[7] The impact of credit easing is estimated on the basis of an event-study methodology which focuses on the announcement effects of the June-September 2014 package; see the ECB Economic Bulletin article entitled “The transmission of the ECB’s recent non-standard monetary policy measures” (Issue 7 / 2015). The impact of the deposit facility rate (DFR) cut rests on the announcement effects of the September 2014 DFR cut, while the impact of the subsequent DFR cuts is difficult to disentangle from the simultaneous APP adjustments. Therefore, both effects are shown jointly. APP encompasses the effects of the asset purchase measures adopted at the January and December 2015 Governing Council meetings, the March and December 2016 meetings and the October 2017 meeting. The January 2015 APP impact is estimated on the basis of two event-study exercises by considering a broad set of events that, starting from September 2014, have affected market expectations about the programme; see Altavilla, C. Carboni, G. and Motto, R. (2015) “Asset purchase programmes and financial markets: lessons from the euro area”, ECB Working Paper No 1864, and De Santis, R. (2016), “Impact of the asset purchase programme on euro area government bond yields using market news”, ECB Working Paper No 1939. The quantification of the impact of the December 2015 policy package on asset prices rests on a broad-based assessment comprising event studies and model-based counterfactual exercises. The impact of the March 2016 and December 2016 policy packages is assessed via model-based counterfactual exercises. The impact of the October 2017 policy package is assessed using two models: a term structure modelling framework similar to Li, C. and Wei, M. (2013), “Term Structure Modeling with Supply Factors and the Federal Reserve’s Large-Scale Asset Purchase Programs”, International Journal of Central Banking, 9(1), pp. 3-39 and an ISIN-by-ISIN regression framework akin to D’Amico, S. and King, T. B. (2013), “Flow and stock effects of large-scale treasury purchases: Evidence on the importance of local supply”, Journal of Financial Economics,108(2), pp. 425-448.
[8] To this end, for instance, an estimated term structure model is used following Li, C. and Wei, M. (2013), “Term Structure Modeling with Supply Factors and the Federal Reserve’s Large-Scale Asset Purchase Programs”, International Journal of Central Banking, 9(1), pp. 3-39. In this framework, yields are driven by three factors: the level and slope of the yield curve (“yield factors”) as well as a factor related to the central bank’s bond holdings (“quantity factor”). In quantifying the impact on bond yields, the model thus takes into account the effect of the central bank’s current and future expected bond holdings, including the impact of reinvestment.
[9] Euro area yields are proxied by the GDP-weighted long-term yield of the four largest euro area jurisdictions. The 10-year yield impacts are obtained from a version of the Li-Wei (2013) model used at the Federal Reserve to convert the SOMA portfolio of securities into yield impacts. Impacts are shown for different APP reinvestment scenarios, defined by the horizon indicated in the legend. The marginal impact of each additional year of reinvestment is given by the distance between the scenario curves. Latest observation: February 2018.
[10] Praet, P. (2017), “Maintaining price stability with unconventional monetary policy measures”, speech at the MMF Monetary and Financial Policy Conference, London, 2 October.
[11] See the euro area bank lending survey, October 2017.
[12] This chart shows the risk-neutral probability distribution function implied by two-year zero-coupon inflation options. These risk-neutral probabilities may differ significantly from physical, or true, probabilities. They are estimated on the basis of call (“caplets”) and put (“floorlets”) options with different strike rates on the (three-month lagged) euro area HICP index excluding energy, food and tobacco, assuming Black-Scholes option pricing and implied volatilities that vary across strike rates (“volatility smile”).
[13] See Estrada, A., Jimeno, J.F. and Malo de Molina, J.L. (2009), “The Spanish economy in EMU: the first ten years”, Documentos Ocasionales, No 0901, Banco de España.
[14] See Sapir, A. (2016), The Eurozone needs less heterogeneity, VoxEU, 12 February.
[15] See Schrapf, F. (2018), “International Monetary Regimes and the German Model”, Max Planck Institute for the Study of Societies, Discussion Paper 18/1.
[16] See Bofinger, P. (2015), German wage moderation and the EZ crisis, VoxEU.
[17] See Engbom, N., Detragiache, E. and Raei, F. (2015), “The German Labor Market Reforms and Post-Unemployment Earnings”, IMF Working Paper, 15/162.
[18] The golden wage rule states that real wages should grow in line with (medium-run) national productivity and nominal wages so as to be compatible with price stability. This implies that nominal wages in each country should equal (medium-run) national productivity plus the target inflation rate of the central bank (see, for instance, European Commission, 2005). In practice, this would mean that, on average, unit labour cost growth should approximately equal the target inflation rate of the central bank.
[19] See, for instance, Pisani-Ferry, J. (2003), “The surprising French employment performance: what lessons?”, CESifo Working Paper, No 1078.
[20] See, for instance, Collignon, S. and Esposito, P. (2017), Labour costs and returns on capital in the EMU: a new measure of competitiveness, mimeo.
[21] See https://ec.europa.eu/info/sites/info/files/2018-european-semester-country-report-france-en.pdf.
[22] Article 127 of the Treaty on the Functioning of the European Union.
[23] Articles 120 and 121 of the Treaty on the Functioning of the European Union.
[24] To reinforce ex ante coordination of EU Member States’ economic and fiscal policies, a new monitoring cycle was introduced in 2011: the “European Semester” is a six-month period every year during which national budgetary and structural policies are reviewed to detect any inconsistences and emerging imbalances while major budgetary decisions are still under preparation. The European Semester reinforces the preventive arm of the Stability and Growth Pact, introduces a new procedure for addressing macroeconomic imbalances, and places greater emphasis on monitoring national fiscal frameworks, identifying macrostructural growth bottlenecks and detecting macrofinancial risks in the Member States (see Köhler-Töglhofer, W. and Part P. (2011), “Macro Coordination under the European Semester”, Monetary Policy and the Economy, Issue 4, Oesterreichische Nationalbank).
Európai Központi Bank
Kommunikációs Főigazgatóság
- Sonnemannstrasse 20
- 60314 Frankfurt am Main, Németország
- +49 69 1344 7455
- media@ecb.europa.eu
A sokszorosítás a forrás megnevezésével engedélyezett.
Médiakapcsolatok

