



Assessing the macroprudential impact of liquidity management tools for investment funds: a system-wide analysis
Published as part of the Financial Stability Review, May 2026.
Liquidity mismatches in open-ended funds can generate systemic risk when redemption pressures meet illiquid markets. During stress episodes, large outflows may force rapid asset sales at discounted prices. As asset values fall, investors may accelerate redemptions to avoid losses, creating run-like dynamics. Such feedback loops between outflows and prices can transmit localised stress to the broader financial system.[1] A number of liquidity stress episodes over the past few years have highlighted vulnerabilities in the fund sector. For example, the financial turmoil that followed the outbreak of the COVID-19 pandemic led to around 140 investment funds domiciled in the European Economic Area suspending redemptions due to valuation uncertainty or excessive outflows between March and May 2020.[2]
To mitigate risks stemming from liquidity mismatches, EU investment funds are required under UCITS VI[3]/AIFMD II[4] to operationalise at least two liquidity management tools (LMTs) as of 16 April 2026. ESMA recommends that investment funds adopt at least one price-based and one quantity-based LMT from a set of eight authorised tools.[5] Price-based LMTs such as anti-dilution levies (ADLs) are designed to transfer the costs associated with redeeming shares to the redeeming investors, the idea being to protect the remaining investors by preventing dilution of the fund’s value.[6] In particular, ADLs charged to redeeming investors are directly calibrated against the estimated transaction costs of their redemptions. By contrast, quantity-based LMTs directly target redemption pressures by delaying or limiting the amount that can be withdrawn. For example, redemption gates limit total redemptions over a given period (typically one day) to a predetermined percentage of the fund’s total net assets.
This box quantifies the potential impact of these measures on both investment funds and banks, using a system-wide agent-based model of the European financial system.[7] The model calculates the first-round impact on asset valuations of the 2025 EU-wide stress test’s adverse scenario for banks, investment funds and insurers, as well as the first-round fund redemptions by external investors based on the funds’ scenario-induced losses.[8] This triggers various second-round liquidity dynamics in the model, including second-round redemptions from funds by other agents in the model. This box evaluates the systemic impact of LMTs applied to second-round redemptions, covering both a price-based tool (ADLs) and a quantity-based tool (redemption gates).[9] For the sake of brevity, and given the limited relevance of insurers to this analysis, the box focuses only on banks and investment funds.
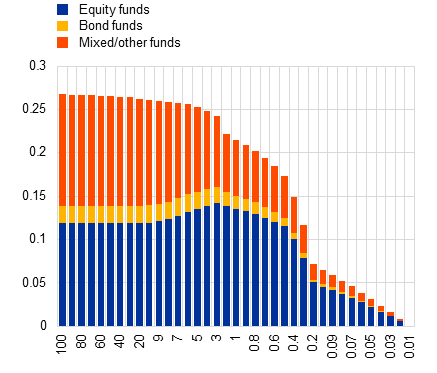
Redemption gates reallocate redemptions across the sector towards less vulnerable funds, mitigating the risk of fire-sale spirals (Chart A, panel a). The chart shows aggregate second-round outflows by fund type, depending on how restrictive redemption gates are (100% means unrestricted redemptions). A redemption gate of about 2%, when applied by all funds in the model, has the potential to significantly rebalance redemptions across funds. There is an increase in outflows from equity funds, which are typically larger, but a decrease in outflows from smaller, more vulnerable and less liquid funds, such as bond funds. This happens because when redemption requests exceed the fund’s gating threshold, investors redeem from other funds to meet their remaining liquidity needs.[10] In doing so, redemption gates redistribute liquidity pressure from less resilient to more resilient funds, reducing the risk of localised shocks escalating into fire-sale spirals.
Chart A
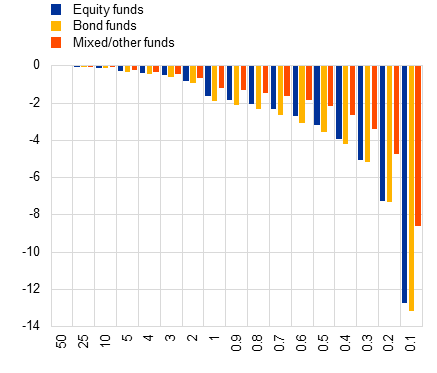
Redemption gates reallocate outflows to more resilient funds, while only restricting outflows which are exceptionally large by historical standards
a) Second-round fund outflows with gates | b) Historical fund outflows |
|---|---|
(x-axis: redemption gate thresholds as a percentage of each individual fund’s total net assets; y-axis: aggregate second-round fund outflows as a percentage of total investment fund sector assets) | (x-axis: distribution percentiles of funds’ historical outflows; y-axis: historical outflows as a percentage of total investment fund sector assets) |
 |  |
Sources: LSEG Lipper and ECB calculations.
Notes: The sample of funds is the same in both panels. Panel a: aggregate outflows per fund category, depending on the severity of the gate. A gate of x% limits each fund’s total outflows to x% of the fund’s total net assets. When the requested redemptions exceed the gate, they are granted pro rata up to the limit set by the gate. Panel b: historical distribution of funds’ daily outflows, from Q1 2019 to Q4 2024.
Appropriately calibrated redemption gates may protect vulnerable funds without significantly limiting the liquidity available to other sectors, such as banking. A gate of 2% of total net assets is at the restrictive end of what is used in practice, although it only affects unusually severe outflows in the tail of the historical distribution (Chart A, panel b).[11] When all funds apply a 2% gate, total redemptions from the sector fall by less than 5 basis points of fund sector assets. This amount is unlikely to create liquidity bottlenecks in other sectors. In practice, the gate is even less restrictive, as excess redemptions would merely be postponed to the next period (typically a day). For the sake of simplicity, in the model investors are forced to redeem from other funds instead. Overall, when applied consistently across the fund sector with appropriately stringent calibration, redemption gates seem to improve the stability of the fund sector and the broader financial system, without significantly restricting liquidity access to other sectors (e.g. banking). In practice, however, redemption gates are calibrated by individual fund managers, which may be suboptimal from a systemic perspective.
Chart B
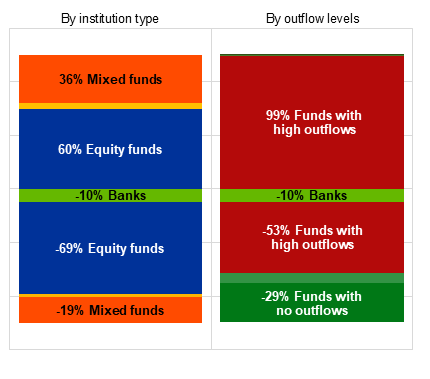
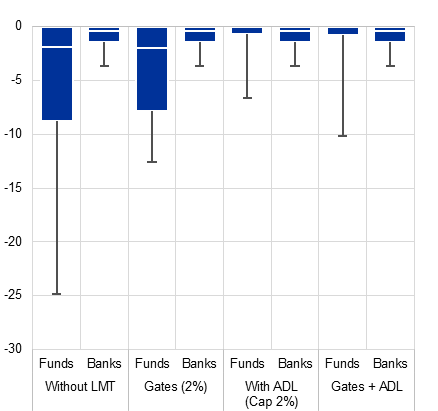
Mixed funds and funds with high outflows would benefit the most from ADLs, and redemption gates and ADLs are both tools that are effective in protecting fragile funds during financial turmoil
a) ADLs: who pays and who receives? | b) Fund losses and banks’ capital depletion |
|---|---|
(ADLs received (+) and paid (-), as a percentage of aggregate ADLs transacted | (losses for funds: percentages of total assets; losses for banks: percentage points of CET1 ratio) |
 |  |
Source: ECB calculations.
Notes: Panel a: the left bar shows the share of total transacted ADLs received (+) and paid (-) by institution type, when all funds apply ADLs capped at 2%. The unlabelled yellow segments correspond to bond funds. In the right bar, funds are categorised based on their second-round redemptions experienced: no outflows, low-to-medium outflows (< 66th percentile, unlabelled olive-green segments) and high outflows (> 66th percentile). Panel b) shows boxplots of the distribution of second-round fund losses and bank capital depletions, when a 2% gate and/or ADL capped at 2% is applied by all funds. Only European institutions are shown, such that the baseline result (no LMTs) matches that in the Macroprudential Bulletin*.
*) “Integrating contagion risk into the 2025 EU-wide stress test: a system-wide analysis with amplification effects between banks and non-banks”, Macroprudential Bulletin, Issue 32, ECB, November 2025.
ADLs may generate significant liquidity transfers to funds suffering high liquidation costs. Following ESMA guidelines[12], in this analysis ADLs are calculated as the difference between the price when the order is placed and the final executed price.[13] Assuming that all funds in the sample impose ADLs, the gross amount of liquidity transferred by these levies is significant, amounting to about 5% of the total value of second-round redemptions. Chart B, panel a) shows the fraction paid and/or received of the total transacted ADL volume, with ADLs capped at 2% of the redeemed amount.[14] As ADLs are predominantly paid to funds suffering high liquidation costs, they offset some of these more vulnerable funds’ losses and reduce the risk of funds being forced into fire sales that could spill over to other sectors. ADLs transfer liquidity from the banking sector to the fund sector, as about 10% of ADLs are paid by banks. However, ADLs mainly transfer liquidity between funds, with large equity funds receiving the greatest share of gross levies, and mixed funds and funds with large outflows benefiting the most in terms of net levies received.
ADLs and redemption gates both prevent tail losses in the fund sector, with minimal impact on banks’ capital (Chart B, panel b). The chart shows box plots of second-round fund losses and banks’ capital depletions for four policy configurations: (1) a baseline without LMTs; (2) a 2% redemption gate applied by all funds, but no ADLs; (3) ADLs, capped at 2%, levied by all funds, but no redemption gates; and (4) the combined application of gates and ADLs. The 2% gate significantly reduces the 75th and, in particular, the 90th percentile of the loss distribution. By comparison, ADLs with a 2% cap have an even greater impact, while the combination of ADLs and gates appears less effective at reducing fund losses in the tail of the distribution than ADLs alone. Note, however, that in the event of a crisis gates may prevent the forced selling of securities below their fundamental value. This advantage of gates over ADLs is not visible in Chart B, panel b), because the results presented do not distinguish between unrealised mark-to-market losses and losses realised when selling. All the combinations of LMTs considered show no significant impact on banks’ capital ratios. This indicates that LMTs do not limit banks’ access to liquidity to the extent that they could be forced to conduct fire sales of substantial asset volumes.
Overall, strictly and consistently implemented LMTs can protect vulnerable funds, reducing the risk of dilution and negative spillovers to other sectors. The impact of LMTs on systemic liquidity risk appears to be positive – this is particularly evident when tail losses are analysed.[15] By redistributing liquidity pressure from fragile entities to more resilient institutions, the system-wide stress test simulation indicates that LMTs prevent localised shocks from escalating into fire-sale spirals. These findings suggest that strictly and consistently applied LMTs can help bolster the resilience of the non-bank financial sector and safeguard broader system-wide stability.[16] At the same time, redemption gates and ADLs may create new incentives for pre-emptive redemptions, whereby investors redeem shares before gating thresholds are reached or ADLs are raised. Moreover, when redemptions are blocked or ADLs spike in one class of funds, this may signal distress to the broader market and trigger pre-emptive redemptions in other classes of funds. These potential downsides of LMTs are not captured by the model.
See Falato, A., Goldstein, I. and Hortaçsu, A., “Financial fragility in the COVID-19 crisis: The case of investment funds in corporate bond markets”, Journal of Monetary Economics, Vol. 123, October 2021, pp. 35-52, and “Policy Recommendations to Address Structural Vulnerabilities from Asset Management Activities”, Financial Stability Board, 12 January 2017.
See “Report: Recommendation of the European Systemic Risk Board (ESRB) on liquidity risk in investment funds”, European Securities and Markets Authority, 12 November 2020.
Directive 2009/65/EC of the European Parliament and of the Council of 13 July 2009 on the coordination of laws, regulations and administrative provisions relating to undertakings for collective investment in transferable securities (UCITS) (OJ L 302, 17.11.2009, p. 32).
See “Guidelines On Liquidity Management Tools (LMTs) of UCITS and open-ended AIFs”, European Securities and Markets Authority, 12 March 2026.
In the absence of ADLs, the remaining investors bear these redemption costs (transaction fees, bid-ask spreads, etc.). The costs can generate strategic complementarities: an investor’s incentive to redeem increases in line with the proportion of other investors doing so. This can give rise to (panic) runs on funds.
See Sydow, M. et al., “Shock amplification in an interconnected financial system of banks and investment funds”, Journal of Financial Stability, Vol. 71, 101234, April 2024, and Sydow, M. et al., “Banks and non-banks stressed: liquidity shocks and the mitigating role of insurance companies”, Working Paper Series, No 3000, ECB, November 2024.
An extended description of the scenario and model (without LMTs) can be found in “Integrating contagion risk into the 2025 EU-wide stress test: a system-wide analysis with amplification effects between banks and non-banks”, Macroprudential Bulletin, Issue 32, ECB, November 2025. The dataset covers euro area banks and insurance corporations, and investment funds globally. It is important to note that the results of the analysis are conditional on the applied scenario, so it is not guaranteed they can be generalised to other relevant stress scenarios.
Because the model cannot capture potential negative spillovers of LMTs to external investors, first-round redemptions by external investors are not subject to LMTs. Otherwise, the model would produce an unrealistically optimistic assessment of their impact.
Second-round redemptions in the model are driven exclusively by liquidity needs. When gates block redemptions, investors are forced to raise liquidity through other means in the model.
According to IOSCO data from 2015, funds implementing redemption gates in jurisdictions where gates are already authorised typically used a threshold of between 5% and 25% of total net assets. See “Liquidity Management Tools in Collective Investment Schemes: Results from an IOSCO Committee 5 survey to members”, FR28/2015, International Organization of Securities Commissions, December 2015.
See guideline 37 in “Final Report: Guidelines on LMTs of UCITS and open-ended AIFs”, European Securities and Markets Authority, 15 April 2025.
In the model, asset sales depress prices, reflecting the price impact of (fire) sales and reducing the cash recovered. The ADLs determined in the model are chosen to cover this cost exactly. In practice, however, ADLs cannot be based on liquidation costs realised ex post and would be estimated ex ante from historical data. As such, when market prices fall sharply and redemptions spike simultaneously, as they do in the simulation, ADLs determined ex ante will not fully capture the severity of the liquidation costs, in contrast to the ADLs calculated in the model. Furthermore, an important feature of ADLs is that they may discourage redemptions because they offset first-mover advantages. This is not captured in the model, as investors are not deterred by ADLs but just pay the levy for the sake of simplicity. For these reasons, the amount of ADLs transacted in the model is very conservative and likely overestimates the amount that would be levied in practice.
The results in Chart B, panels a) and b) are calculated with a 2% cap on ADLs, which is a commonly chosen cap on price-based LMTs. This was observed for French investment funds by Baena, A. and Garcia, T., “Swing Pricing and Flow Dynamics in Light of the Covid-19 Crisis”, Working Papers, No 914, Banque de France, 2022.
By reducing redemption risks, LMTs may facilitate increased risk taking by funds. This is not captured by the model.
Where necessary, national macroprudential authorities can coordinate with the competent authorities to support the application of stricter measures when systemic risks are identified.