
How effective is the EU Money Market Fund Regulation? Lessons from the COVID‑19 turmoil
The turmoil seen in March 2020 highlighted key vulnerabilities in the money market fund (MMF) sector. This article assesses the effectiveness of the EU’s regulatory framework from a financial stability perspective and identifies three important lessons. First, investment in non-public debt assets exposes MMFs to liquidity risk, highlighting the need to limit investment in illiquid assets. Second, low-volatility net asset value (LVNAV) funds are particularly vulnerable to liquidity shocks, given that they invest in non-public debt assets while offering a stable net asset value (NAV). Enhanced portfolio requirements could strengthen their liquidity profile. And third, MMFs seem reluctant to draw down on their liquidity buffers during periods of stress, suggesting a need to make buffers more usable.
1 Introduction
MMFs are used for liquidity management purposes by investors and provide short-term funding for financial institutions, corporations and governments. By investing in short-term debt, MMFs contribute to the financing of banks and the wider economy. They are also used to by investors seeking to store liquidity and manage their cash needs. In this sense, MMFs play an important role for the financial system, bringing together demand and supply of short-term funding.
The global financial crisis highlighted key vulnerabilities in MMFs with the potential to amplify risks in the financial system. During the global financial crisis, US and European MMFs faced significant stress, which alerted regulators to their systemic relevance and shed light on several features that made them vulnerable to investor runs. The International Organization of Securities Commissions identified a number of key vulnerabilities, including first-mover advantages for investors and the fact that the stable NAV gives investors the impression of safety despite MMFs being subject to credit, interest rate and liquidity risks (IOSCO, 2012).
Since the global financial crisis, EU legislators have adopted new rules, such as the MMF Regulation[1], to increase the resilience of the MMF sector. In 2010, the Committee of European Securities Regulators adopted guidelines to establish a minimum level playing field for MMFs (CESR, 2010), but those guidelines were only applied by 12 Member States. The adoption of the MMF Regulation in 2017 was therefore an important step towards further harmonisation. First, the MMF Regulation introduced new rules governing the composition of MMFs’ portfolios and required constant NAV (CNAV) funds to invest in public debt.[2] Second, alongside CNAV and variable NAV (VNAV) funds, it introduced the LVNAV structure, which allows funds to offer a stable NAV while investing in a broader range of instruments.[3] Third, the MMF Regulation introduced daily and weekly liquidity requirements with a view to strengthening MMFs’ ability to handle redemptions and mitigate procyclical sales.
The coronavirus (COVID‑19) market turmoil in March 2020 tested the resilience of the MMF sector, raising questions about the MMF Regulation’s ability to tackle systemic risks effectively. Following the onset of the COVID‑19 crisis in Europe in early 2020, non-public debt MMFs experienced significant outflows resulting from liquidity needs, flight-to-safety considerations and various other factors (as discussed in Box 1).[4] While the level of stress stabilised following central bank policy actions, that episode highlighted the need to make the sector more resilient.
Our findings suggest a number of weaknesses in the MMF regulatory framework, related to non-public debt funds, the LVNAV structure as well as MMFs’ liquidity requirements. While the MMF Regulation aimed to increase the resilience of the MMF sector, our findings show that the current framework requires further enhancement in these specific areas. The upcoming review of the MMF Regulation in 2022 represents a good opportunity to address the shortcomings.
2 Vulnerabilities in funds investing in non-public debt
The MMF Regulation introduced rules on the composition of MMFs’ portfolios in order to make MMFs more resilient and limit contagion. The EU MMF Regulation includes a number of rules on eligible assets, the maturities of assets, liquidity, diversification, and the credit quality of both issuers and money market instruments. It also requires CNAV funds to invest 99.5% of their assets in public debt.
While CNAV funds saw net inflows during the turmoil of March 2020, funds investing in non-public debt instruments experienced substantial outflows. The left-hand panel of Chart 1 shows the portfolio composition split by the regulatory MMF types at the end of February 2020, while the right-hand panel shows daily net flows. CNAV funds invest largely in government securities. By contrast, LVNAV and VNAV funds invest in less liquid non-government assets such as commercial paper and certificates of deposit, with managers typically operating on the assumption that maturing assets will cover their liquidity needs, without the need to sell assets before they mature. Following the onset of the COVID‑19 crisis in Europe, outflows were concentrated in LVNAV and VNAV funds, while CNAV funds saw net inflows. Outflows for LVNAV funds, especially for those denominated in US dollar, were particularly large, totalling around €85 billion (16% of their total assets) between 11 and 25 March. In the same period, VNAV funds had outflows of €34 billion (7% of their total assets).
Chart 1
Outflows were concentrated in LVNAV and VNAV funds, which largely invest in commercial paper

Sources: Crane Data, Refinitiv Lipper and ECB calculations.
Notes: The left-hand panel shows the aggregate composition of different types of MMF on 28 February 2020. The total assets of each type of fund are based on data from Refinitiv Lipper, while the composition of those portfolios is based on information from Crane Data. The right-hand panel shows cumulative daily net flows between 28 February and 22 April 2020. The vertical line denotes 26 March 2020, which was the start date of the ECB’s pandemic emergency purchase programme (PEPP).
The low market liquidity of some instruments that non-public debt MMFs hold exposes them to liquidity risk during periods of stress. Commercial paper and certificate of deposit markets are characterised by low levels of liquidity, even in normal periods.[5] This was also highlighted during the turmoil of March 2020, where a number of non-public debt funds had to ask issuing banks to buy back their commercial paper.[6] Row 1 of Table 1 shows that funds investing in more illiquid assets typically face larger outflows than other funds during periods of stress. This controls for the fund’s regulatory type, return, currency, age, size, fund family size, weekly liquid assets and portfolio illiquidity, as well as the standard deviation of returns, and both time and fund fixed effects (see Specification 2).[7] We find that during periods of stress daily outflows are around 0.7‑0.8 percentage points higher for illiquid funds investing largely in commercial paper and certificates of deposit relative to other MMFs.
Table 1
Larger outflows for LVNAV funds and other funds investing in illiquid assets in the recent crisis period
(dependent variable: net investor flows)

Sources: Crane Data and ECB calculations.
Notes: This table shows the coefficients derived from a regression model. The dependent variable is the fund’s net investor flows. “Illiquid” is a dummy variable which has a value of 1 if the fund is in the highest decile of all funds in the sample in terms of the illiquidity of portfolios. The illiquidity of funds’ portfolios is estimated as the percentage of the previous month’s portfolio that is invested in commercial paper, asset-backed commercial paper and certificates of deposit. Crisis periods are defined as periods with a VIX value in the top decile of the sample distribution. “LVNAV” is a dummy variable that has a value of 1 if the fund is an LVNAV fund. The following lagged control variables are included: return, age, fund size, fund family size, level of weekly liquid assets, standard deviation of returns, illiquidity of portfolio, and a dummy for US dollar-denominated funds. Standard errors are clustered at fund level. In line with standard practice in economic literature, fund flows are winsorised at the 1% and 99% levels. The sample period runs from January 2019 to the end of May 2020, with a daily frequency. Daily fund flows are calculated as the change in the fund’s total net assets between two consecutive periods. Results are robust to adjusting the calculation of flows in order to account for daily fund returns. Asterisks denote standard statistical significance (* p < 0.1, ** p < 0.05, *** p < 0.01).
3 Liquidity risk in the LVNAV framework
LVNAV funds are particularly vulnerable to liquidity shocks, given that they invest in non-public debt instruments while offering a stable share price. An LVNAV fund offers a stable NAV as long as its NAV at amortised cost does not deviate from the corresponding market value by more than 20 basis points. If the fund breaches that valuation threshold, it is required to trade at a variable price. A breach on the downside generally leads to losses for investors and the investment loses its cash-like properties. In mid-March 2020, a number of LVNAV funds – particularly US dollar-denominated funds – were close to breaching the regulatory threshold on the downside (as Chart 2 shows). This may have encouraged investors in some LVNAV funds to withdraw their money, contributing to the large outflows for that fund type relative to other funds.[8] The multivariate regression model, presented in Table 1, indicates that daily outflows are around 0.8‑1.2 percentage points higher for LVNAV funds relative to other MMFs during crisis periods (see row 2).
Chart 2
Some US dollar-denominated LVNAV funds came close to breaching the lower valuation threshold during the turmoil of March 2020
(NAV deviations from stable value, in basis points)

Sources: Crane Data and ECB calculations.
Notes: The blue lines show the interquartile range of the NAV deviations for US dollar-denominated LVNAV funds. The red dots show the largest negative NAV deviations. The vertical line denotes 26 March 2020, which was the start date of the PEPP.
The prospect of breaching the regulatory NAV limit may have incentivised outflows among some LVNAV investors during the March 2020 turmoil. Table 2 shows the results of a model regressing daily fund flows on an interaction term combining a lagged measure of closeness to the lower valuation threshold with the crisis dummy. It shows that, during crisis periods, outflows are around 1.8‑2.3 percentage points larger for LVNAV funds that were close to the lower valuation threshold in the previous day, relative to other LVNAV funds (see row 1). This result is robust to controlling for a number of variables, including fund fixed effects, the composition of the fund’s portfolio and weekly liquid assets. The effect also remains robust when considering higher lags of the NAV deviations or controlling for lagged net flows as explanatory variable, to account for the possibility that a fund moved closer to its NAV threshold due to possible sales to meet redemptions in previous periods.
Table 2
Proximity to the valuation threshold may encourage outflows for LVNAV funds
(dependent variable: net investor flows)

Sources: Crane Data and ECB calculations.
Notes: This table shows the coefficients that are derived from regressing a fund’s net flows on its lagged downside NAV deviations. Deviations are defined as the average gap between the marked-to-market NAV and the constant NAV across shares. In Specification 1, the downside deviation dummy has a value of 1 if the gap is above 5 basis points on a given day. In Specification 2, the downside deviation dummy has a value of 1 if the gap is above 10 basis points on a given day. Crisis periods are defined as periods with a VIX value in the top decile of the sample distribution. The following lagged control variables are included: return, age, fund size, fund family size, level of weekly liquid assets, standard deviation of returns and illiquidity of portfolio (calculated as the percentage of the past month’s portfolio invested in commercial paper, asset-backed commercial paper and certificates of deposit). Standard errors are clustered at fund level. Fund flows are winsorised at the 1% and 99% levels. The sample is limited to LVNAV funds. The sample period runs from January 2019 to the end of May 2020, with a daily frequency. Asterisks denote standard statistical significance (* p < 0.1, ** p < 0.05, *** p < 0.01).
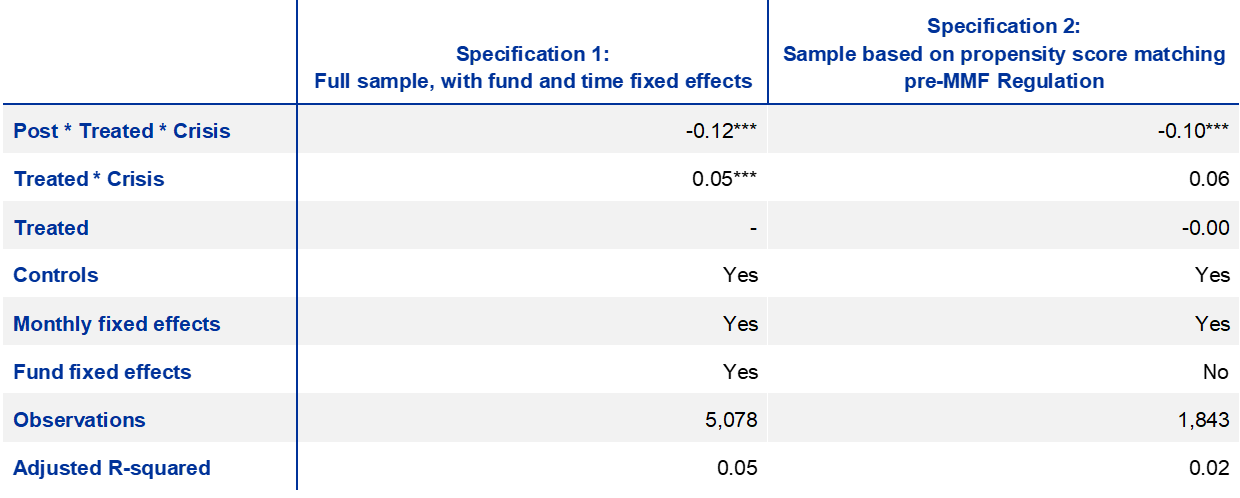
Looking at crisis episodes over a longer review period, outflows have increased more strongly for LVNAV funds than for other short-term MMFs with similar characteristics. Table 3 shows the results of a difference-in-differences model analysing monthly investor flows between 2007 and 2020.[9] We look at differences in net flows during crises, comparing funds which became LVNAV funds in 2019 under the MMF Regulation (the treatment group) with other short-term MMFs with similar characteristics (the control group). To identify similar funds, we matched LVNAV funds with other MMFs on the basis of fund-level characteristics prior to the introduction of the MMF Regulation in 2019. The control group of the matched sample includes mostly VNAV funds, while around one-fifth are CNAV funds. The regression results for the matched sample suggest that there was no significant difference between the two groups before 2019, but monthly outflows in crisis periods were around 10 percentage points larger for LVNAV funds after the start of 2019 (Specification 2).[10] These results suggest that following the introduction of the LVNAV structure, those funds have become more vulnerable to liquidity shocks than non-LVNAV funds with matched characteristics.
Table 3
Since 2019, LVNAV funds have seen stronger increases in outflows during crisis periods than other similar MMFs
(dependent variable: net investor flows)
Sources: Refinitiv Lipper and ECB calculations.
Notes: This table shows the results of a difference-in-differences model analysing investor flows during crisis periods. Crisis episodes are defined as periods where the VIX value is in the top decile of the sample distribution, on the basis of monthly data for the period from 2007 to 2020 (which includes the global financial crisis, the sovereign debt crisis and the COVID‑19 crisis). The treatment group comprises LVNAV funds; the control group comprises other MMFs with similar characteristics which did not become LVNAV funds following the introduction of the MMF Regulation. “Post” is a dummy variable which has a value of 1 if it is after the start of 2019 (and 0 otherwise). In both specifications, the sample is restricted to short-term maturity funds. Controls include fund returns, the standard deviation of returns (as a proxy for the riskiness of portfolios), fund age, fund size, and a dummy indicating whether the fund is aimed mainly at institutional investors. Specification 1 is based on the full sample, with time and fund fixed effects. Specification 2 shows the results for a smaller sample based on propensity score matching. In that sample, LVNAV funds have been matched to other MMFs on the basis of data from before 2019, using the nearest neighbour matching procedure (on a one‑to-one basis). We selected the funds that were closest to each other in terms of their propensity scores, on the basis of the control variables included in the model. That analysis was conducted without replacements, which meant that a neighbour could only be used once. We required common support and imposed a tolerance level of 1%. Asterisks denote standard statistical significance (* p < 0.1, ** p < 0.05, *** p < 0.01).
4 MMFs’ use of liquidity buffers
To try to strengthen MMFs’ ability to handle redemptions and mitigate procyclical sales, the MMF Regulation introduced daily and weekly liquidity requirements. LVNAV and CNAV funds need to hold at least 10% of their assets in daily maturing assets and 30% in weekly maturing assets. For VNAV funds, the equivalent figures are 7.5% and 15% respectively. The aim of these requirements is to strengthen MMFs’ ability to meet redemptions and prevent that funds need to liquidate their assets at discounted prices.
Breaching those liquidity requirements can cause funds to consider applying extraordinary liquidity measures, which may encourage investors to redeem early. LVNAV and CNAV funds are required to consider temporarily suspending or limiting redemptions or applying liquidity fees where weekly liquid assets fall below 30% of total assets and the fund experiences daily redemptions totalling more than 10% of total assets.[11] In times of market stress, this can prompt investors to withdraw money from funds that are close to the 30% threshold. Anticipating this, fund managers may be reluctant to use their liquidity buffers (meaning the stock of liquid assets that MMFs hold on an ongoing basis to meet cash needs).
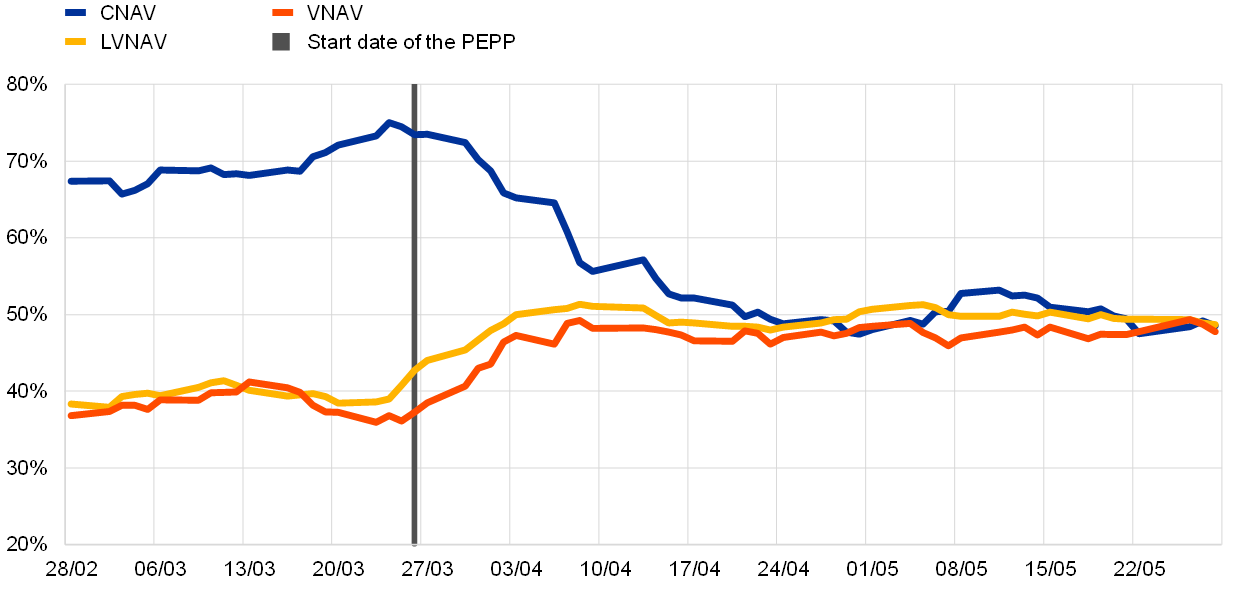
Although large outflows were seen for some funds, fund managers did not draw down on their weekly liquid assets to the same extent, suggesting low levels of usability for MMFs’ buffers. As Chart 3 shows, between 11 and 25 March, LVNAV and VNAV funds reduced their holdings of weekly liquid assets only slightly – by 1 and 3 percentage points respectively on average. Given the large outflows for those funds in this period, that small reduction in liquid assets suggests that fund managers only used their buffers to a very limited extent. Moreover, although LVNAV funds experienced larger outflows than VNAV funds, they made less use of their liquid assets than VNAV funds. This suggests that VNAV funds may be more willing to use their weekly liquid assets than LVNAV funds, possibly because investors do not associate lower levels of liquid asset holdings with a higher risk of suspensions or liquidity fees.
Chart 3
MMFs did not significantly draw down on their liquidity buffers during the March 2020 market turmoil
(weekly liquid assets, in percent of total assets)
Sources: Crane Data and ECB calculations.
Notes: This chart shows the weighted mean of weekly liquid assets for each type of MMF. The vertical line denotes 26 March 2020, which was the start date of the PEPP.
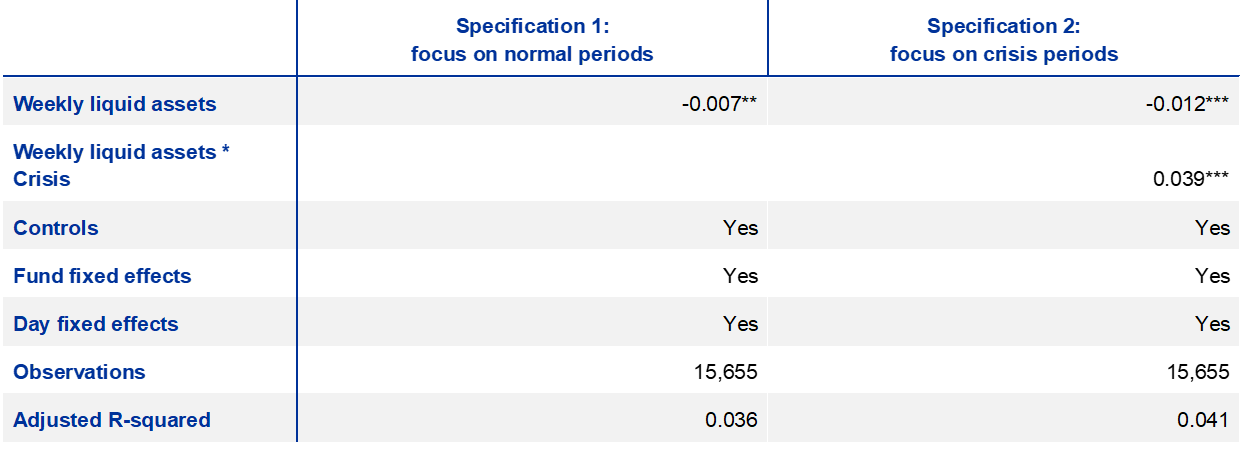
Lower levels of liquid assets are associated with higher investor outflows during stress periods, providing incentives for fund managers to avoid dipping into their liquid assets and to engage in procyclical sales instead. Table 4 shows the results of a multivariate model regressing daily fund flows on an interaction term combining the level of weekly liquid assets and a crisis dummy. It shows that in normal periods, lower weekly liquid assets are associated with higher net inflows (as shown in Specification 1). However, in crisis periods, investors are more likely to withdraw money from funds with lower weekly liquidity buffers[12] (as shown in Specification 2), highlighting why fund managers may be reluctant to draw down on their liquid assets during such periods.
Table 4
During crisis periods, lower levels of liquid assets are associated with stronger outflows
(dependent variable: net fund flows)
Sources: Crane Data and ECB calculations.
Notes: This table shows the coefficients that are derived from regressing a fund’s net flows on an interaction term combining past levels of weekly liquid assets with a crisis dummy. Crisis periods are defined as periods with a VIX value in the top decile of the sample distribution. The following lagged control variables are included: return, age, fund size, fund family size, standard deviation of returns, illiquidity of portfolio (calculated as the percentage of the past month’s portfolio invested in commercial paper, asset-backed commercial paper and certificates of deposit) and NAV deviation. Standard errors are clustered at fund level. Fund flows are winsorised at the 1% and 99% levels. The sample period runs from January 2019 to the end of May 2020, with a daily frequency. Asterisks denote standard statistical significance (* p < 0.1, ** p < 0.05, *** p < 0.01).
5 Conclusion
While the MMF Regulation aimed to increase the resilience of the MMF sector, our findings show that the current framework requires further enhancement in specific areas. The MMF Regulation was introduced to mitigate liquidity shocks and risks to the wider financial system. However, our findings suggest that there are a number of remaining fragilities in the regulatory framework. Future work in this area should focus on the composition of MMFs’ portfolios, vulnerabilities relating to the LVNAV structure, and the usability of liquidity buffers.
Reducing investment in illiquid assets could mitigate liquidity mismatches and alleviate the risk of suspensions during stress periods, but it could impair MMFs’ ability to provide funds to the real economy. The recent strains in the MMF sector suggest that current portfolio requirements may not be strict enough from a financial stability perspective. Given that market participants often use MMFs to store cash and expect MMF units to display cash-like properties, those funds should meet high standards as regards the stability of values. Imposing stricter limits on the percentage of illiquid portfolio assets could mitigate liquidity mismatches and reduce the risk of suspensions during periods of stress. While a higher share of liquid assets could reduce MMFs’ ability to provide funds to the real economy, it could help to align the underlying liquidity features of MMFs’ portfolio assets and investors’ perception of MMFs as cash-like instruments.
Enhanced portfolio requirements, for instance through higher investments in public debt, could strengthen the risk and liquidity profile of LVNAV funds. Given their heightened vulnerability to liquidity shocks, LVNAV funds should be subject to enhanced requirements as regards the risk and liquidity profile of their portfolio assets. They could, for instance, be required to invest a minimum percentage of their assets in public debt. While this could adversely affect the availability of short-term funding of European firms, it could significantly improve the sector’s resilience and stabilise funding markets in periods of stress.
Daily and weekly liquidity requirements should be enhanced to increase the usability of liquidity buffers during periods of distress. Fund managers should be encouraged to increase their use of liquidity buffers. One way of doing this would be to remove the link between breaching weekly liquidity requirements and the possibility of suspending redemptions. This could allow LVNAV funds to draw down on their liquidity buffers, as investors might not need to fear the imposition of extraordinary liquidity measures.
Box 1
Investors’ role in the outflows experienced by euro area MMFs in the March 2020 turmoil
This box investigates the links between euro area MMFs and the rest of the financial system, with a particular focus on the role that investors played in the outflows seen in March 2020. As discussed above, certain characteristics of MMFs – such as the LVNAV structure – served to amplify those outflows. However, it is equally important to understand the various reasons why investors redeemed shares from some MMFs in the first place.
The euro area MMF sector has assets with a total value of €1.3 trillion and is highly diverse. Funds vary in terms of their country of domicile (predominantly Ireland, Luxembourg or France), their type (CNAV, LVNAV or VNAV) and their currency (euro, pounds sterling or US dollars). That variation is also reflected in the heterogeneity of their investor base (Figure A). In the case of Irish and Luxembourgish MMFs, around 80% of their investors are located outside the euro area, while a similar percentage of French MMFs are held by French investors. The most important euro area-based investors are insurance corporations and pension funds (ICPFs) and other investment funds.[13]
To a large extent, the assets held by MMFs reflect the geographical spread of their investors. Irish and Luxembourgish MMFs invest almost 60% of their securities portfolios in non‑euro‑denominated assets issued outside the euro area, while French MMFs invest around half of their securities portfolios in domestic assets. Overall, investment by MMFs is mainly concentrated in short-term bank debt, followed by non-euro area short-term (mainly US) government debt securities. MMF investment in securities issued by non-financial corporations (NFCs) is fairly limited and mainly confined to French NFCs – but at the same time, it represents an important source of financing for euro area (French) NFCs, accounting for around 40% (50%) of their short-term debt securities.
Figure A
Who invests in euro area MMFs, and where do those MMFs then invest?

Sources: ECB securities holdings statistics, BSI and authors’ calculations.
Notes: The data are as of Q3 2020. “RoW” means “rest of the world”. Loans to banks include both deposits and repos. Debt securities account for around 98% of MMFs’ total holdings of securities, and more than two-thirds of those debt securities are short-term debt securities (i.e. securities with an original maturity of one year or less). Values from ECB securities and holdings statistics are rescaled to match aggregates in BSI data.
During the COVID-related market turmoil of March 2020, investors redeemed MMF shares for various reasons, reflecting the heterogeneity of the sector and its investor base (Figure B). For example, in the case of US dollar-denominated LVNAV funds domiciled in Ireland and Luxembourg, non-euro area investors pulled out of those riskier MMFs and put their cash in safer assets (including US dollar-denominated CNAV funds, as highlighted above). Meanwhile, in the case of euro-denominated LVNAV funds domiciled in Ireland and Luxembourg, investors such as Dutch ICPFs appeared to use MMFs to manage the cash that they received or paid in relation to margins on their derivative contracts, as suggested by a correlation between volatility in derivative markets and the volatility of MMFs’ in/outflows.[14] At the same time, the turmoil of March 2020 also coincided with the typical end-of-quarter outflows for French MMFs. Investors always need more cash towards the end of March to pay their taxes, but the outflows seen in 2020 were exceptional in terms of both volume and duration.[15] [16]
Figure B
Different motives for investors’ reversal of cash flows in March 2020

Notes: This figure shows the role that MMFs play in the financial system and the cash flows that are observed in normal and crisis periods. The blue arrows indicate investor flows in normal times, while the numbers in circles (and the dashed lines with the corresponding colours) indicate the outflows seen during the turmoil of March 2020 and the three main reasons for those outflows. Violet arrows indicate MMFs’ funding role and the repercussions for the money markets when MMFs had to satisfy investors’ demand for redemptions. The red lightning bolt indicates disruption in the markets for short-term papers during the turmoil.
To satisfy the demand for redemptions, euro area MMFs liquidated, in net terms, securities with a total value of around €70 billion (8% of their securities portfolios) in the first quarter of 2020. Those sales of short-term debt securities and buy-backs by issuing banks affected the smooth functioning of money markets: issuance of short-term paper dried up, interest rates increased, and some banks and NFCs lost an important source of short-term financing,[17] with repercussions for other markets and sectors.[18]
From a regulatory perspective, this box underlines the need for a holistic approach to prudential regulation. Changes to the MMF Regulation that help tackle vulnerabilities in the MMF sector would be welcome. At the same time, however, investors that use MMFs for cash management purposes need to account for the fact that MMF shares are not fully cash-like instruments, as their value can decline and funds can suspend redemptions in exceptional circumstances.
References
AMF (2020), “2020 Markets and Risk Outlook”, July, pp. 66‑73.
CESR (2010), “CESR’s guidelines on a common definition of European money market funds”, May.
Cipriani, M. and La Spada, G. (2020), “Sophisticated and Unsophisticated Runs”, Federal Reserve Bank of New York Staff Reports, No 956.
ECB (2020a), “The ECB’s commercial paper purchases: A targeted response to the economic disturbances caused by COVID‑19”, blog post, 3 April.
ECB (2020b), “Recent stress in money market funds has exposed potential risks for the wider financial system”, Financial Stability Review, May.
ECB (2020c), “Interconnectedness of derivatives markets and money market funds through insurance corporations and pension funds”, Financial Stability Review, November.
ESMA (2021), “Vulnerabilities in money market funds”, ESMA Report on Trends, Risks and Vulnerabilities, No. 1, 2021, pp. 60-72, March.
ESRB (2020), “Issues note on liquidity in the corporate bond and commercial paper markets, the procyclical impact of downgrades and implications for asset managers and insurers”, May.
FSB (2020), “Holistic Review of the March Market Turmoil”, November.
IOSCO (2012), “Policy Recommendations for Money Market Funds”, October.
Li, L., Li, Y., Macchiavelli, M. and Zhou, X. (2020), “Runs and interventions in the time of Covid‑19: Evidence from money funds”, Covid Economics, Vetted and Real‑Time Papers, Vol. 29, pp. 50‑99.
Sveriges Riksbank (2020), “The interconnectedness of insurance companies, National Pension Insurance Funds and banks via the foreign exchange market”, Financial Stability Report, 2020:1, May.
- Regulation (EU) 2017/1131 of the European Parliament and of the Council of 14 June 2017 on money market funds.
- CNAV funds investing in public debt aim to maintain an unchanging NAV per unit or share. Assets are generally valued using the amortised cost method and the NAV is rounded up/down to the nearest percentage point or its equivalent in currency terms. A fund’s income is accrued daily and can either be paid out to the investor or used to purchase more units or shares in the fund. Under the MMF Regulation, CNAV funds have to invest at least 99.5% of their assets in (i) government debt instruments, (ii) reverse repos collateralised using government debt or (iii) cash.
- Under the MMF Regulation, MMFs have to be set up as either (i) a VNAV fund, (ii) a public debt CNAV fund or (iii) a LVNAV fund. Unlike CNAV and LVNAV funds, VNAV funds price their assets using market pricing, offering a fluctuating dealing NAV.
- See also ECB (2020a, 2020b).
- FSB (2020).
- ESRB (2020).
- This regression analysis is based on daily information from Crane Data, which includes, among other variables, data on daily investor flows, daily and weekly liquid assets, and the different regulatory types of MMF. The final sample comprises 63 funds subject to the MMF Regulation between January 2019 and end of May 2020, with assets totalling €810 billion at the end of February 2020 (around 70% of the total assets of all euro area MMFs). It is worth noting, however, that VNAV funds are underrepresented in the dataset. As a robustness check, we thus estimate the model using available data from Refinitiv Lipper. While Refinitiv Lipper does not provide data on weekly liquid assets or the composition of MMFs’ portfolios, it has better coverage for VNAV funds. The coefficient derived from the Refinitiv Lipper dataset for the “LVNAV * Crisis” interaction term remains robust, suggesting that LVNAV funds have indeed seen larger outflows than other MMFs during the recent crisis period when controlling for other available variables. Note that it is not possible to replicate the coefficient for the illiquidity variable, given that this variable is not available in the Refinitiv Lipper dataset.
- See also ESMA (2021) on the challenges for MMFs to simultaneously meet the different regulatory constraints under stress.
- The sample therefore includes the global financial crisis, the sovereign debt crisis and the COVID‑19 crisis. For this analysis, we use monthly data from Refinitiv Lipper, since Crane Data does not provide a sufficiently long time-series to cover previous crisis episodes.
- This result is confirmed in a fixed effects model, which uses the full available sample (as shown in Specification 1).
- This does not apply to VNAV funds.
- These findings are in line with Cipriani and La Spada (2020) and Li et al. (2020).
- Sectoral breakdowns are not available for non-euro area investors.
- ECB (2020c).
- According to Refinitiv Lipper data on individual MMFs, the outflows that were observed for French MMFs in March 2020 totalled around €48 billion, compared with just €7 billion in March 2019. See also AMF (2020).
- IFs could have also pulled out from MMFs to face their own redemptions, but monthly data provide no evidence of such behaviour.
- ECB (2020b).
- For example, as Swedish banks were unable to issue US dollar-denominated commercial paper that would be bought by euro area MMFs, they were also unable to enter into foreign exchange swap transactions with Swedish insurers and pension funds, whose foreign exchange risk ended up being partially unhedged as a result. For more details, see Sveriges Riksbank (2020).