
Using machine learning and big data to analyse the business cycle
Published as part of the ECB Economic Bulletin, Issue 5/2021.
1 Introduction
Policymakers take decisions in real time based on incomplete information about current economic conditions. Central banks and economic analysts largely rely on official statistics together with soft data and surveys, to assess the state of the economy. Although a wide range of high-quality conventional data is available, the datasets are released with lags ranging from a few days or weeks to several months after the reference period. For these reasons, central banks have been looking at ways to exploit timelier data and employ more sophisticated methods to enhance accuracy when forecasting metrics that are relevant for policymaking.
Over recent years, policy institutions have started to explore new sources of data and alternative statistical methods for the real-time assessment of economic activity. Since the financial crisis, they have stepped up their efforts to systematically use micro and survey data to better gauge changes in aggregate consumption, investment and the labour market. In parallel, technological advances have allowed users to start examining unconventional sources such as text data and images from newspaper articles, social media and the internet together with numerical data from payments. Also now available are alternative statistical methods such as regression trees, neural networks and support-vector machines that may help the potential insights that can be gained from these data sources to be fully exploited.
The coronavirus (COVID-19) pandemic has accelerated this trend. The crisis associated with the pandemic has shown that “big data” can provide timely signals on the state of the economy and help to track economic activity alongside more traditional data. Big data are commonly characterised as having three Vs: high volume, high velocity and high variety.[1] High volume refers to the massive amounts of data generated as a result of the proliferation of devices, services and human interaction. High velocity refers to the fast speed at which the data are created and processed. High variety relates to the wide range and complexity of data types and sources.[2] Big data are appealing because they are available at high frequency; however, they are often relatively unstructured and are, by definition, large in size. This in turn poses various challenges for traditional econometric models. Some of these can be addressed by machine learning (ML) algorithms, which also have the advantage of potentially capturing complex non-linear relationships. Even though there is no single definition of machine learning, the basic idea behind it is that computers (machines) can learn from past data, identify general patterns – often characterised by non-linear relationships – and make predictions using algorithms capturing those patterns. Machine learning is therefore a subset of artificial intelligence, and most of its methods are largely based on concepts from statistics and statistical learning theory.[3]
This article reviews how policy institutions – international organisations and central banks – use big data and/or machine learning methods to analyse the business cycle. Specifically, these new data sources and tools are used to improve nowcasting and short-term forecasting of real GDP. They are also employed to gain useful insights for assessing cyclical developments and building narratives. A number of illustrative examples are provided.
The article is organised as follows. Section 2 reviews the main sources of big data that central banks and other policy institutions have been exploring for business cycle analysis over recent years. It provides an overview of existing literature and also includes two examples of how big data have been used to monitor economic activity and labour market developments during the pandemic. Section 3 discusses the main advantages of ML methods in dealing with big data and analysing the business cycle. This section includes two examples using newspaper articles to build measures of economic sentiment and economic policy uncertainty. Section 4 presents the main conclusions and discusses opportunities and challenges faced by central banks when using machine learning and big data.
2 How do big data help to gauge the current state of the economy?
Policy institutions have recently started to incorporate structured and unstructured big data in their economic analysis. Big data can be structured – such as those collected in large financial datasets that can be matched to firm-level financial statements – or unstructured. Unstructured data range from large and near-real-time data gleaned from the internet (e.g. internet search volumes, data from social networks such as Twitter and Facebook, newspaper articles) to large-volume data obtained from non-official sources (e.g. trading platforms and payment systems or GPS-based technologies).
Structured data, such as those from financial and payment transactions, can provide critical real-time information for assessing aggregate consumption and economic activity. As the use of credit and debit cards to purchase goods and services has increased, the underlying financial transaction data have provided useful information to track consumption and economic activity. At the same time, payments data are available promptly and subject to few revisions since they are financial records. Central banks had already started to regard these data as a valuable source of information before the pandemic emerged. Analysis based on data for the Netherlands, Norway. Portugal and Spain, among others, finds that retail payment systems data (i.e. credit and debit card payments at the point of sale and ATM withdrawals) helped retail sales, private consumption (especially of non-durables) and even real GDP to be forecast in the previous expansionary phase.[4] For Italy, some gains in forecast accuracy have been reported when information from highly aggregated but large value payments (i.e. TARGET2) has been included in GDP nowcasting models.[5]
Turning to unstructured big data, the use of text data from newspapers to understand and forecast the business cycle has increased significantly in the recent years. In business cycle analysis, text data from newspapers and social media have been used to construct proxy measures for unobservable variables such as “sentiment” or “uncertainty” which are likely to be associated with macroeconomic fluctuations. These proxies can be obtained at relatively low cost (in contrast to expensive survey-based measures) and on a timely basis (e.g. daily) by means of automated natural language processing methods. For instance, news-based sentiment indicators can serve as early warning indicators of financial crises.[6] Newspaper-based sentiment and economic policy uncertainty indexes for Italy and Spain have proved helpful in monitoring economic activity in real time and nowcasting GDP. [7] Similarly, in Belgium daily average economic media news sentiment is found to be useful for nowcasting survey-based consumer confidence.[8] At the ECB, newspaper-based daily sentiment indicators have been estimated for the four largest euro area countries and the euro area as a whole. These indicators demonstrate a high correlation with survey-based sentiment indicators and real GDP; they are also found to be useful for nowcasting GDP, particularly at the beginning of the quarter when other more traditional indicators (e.g. surveys) referring to the current quarter have not been released yet (see Box 3 in Section 3). In addition, economic policy uncertainty indexes have been estimated for the same set of countries. The ML methods employed also allow uncertainty to be decomposed into sub-components that point towards the main sources (see Box 4 in Section 3).
Similarly, the use of internet searches has also started to feature in short-term forecasting models. Several Eurosystem studies show that internet searches can provide information about future consumption decisions. Recent examples include analysis linking Google search data to euro area car sales, the use of Google search data to enhance German GDP nowcasting model and the analysis exploiting synthetic indicators based on Google searches for forecasting private consumption in Spain. For the euro area as a whole, Google data provide useful information for GDP nowcasting when macroeconomic information is lacking (i.e. in the first four weeks of the quarter), but as soon as official data relating to the current quarter become available, their relative nowcasting power diminishes.[9]
Internet-based data can also help when assessing the tightness of the labour and housing markets. Analysis for the US labour market shows that including Google-based job-search indicators improves the accuracy of unemployment forecasts, particularly over the medium-term horizon (i.e. three to 12 months ahead).[10] In the euro area, a measure of labour market tightness based on the number of clicks on job postings has recently been built for the Irish economy.[11] For the housing market, analysis for Italy found that metrics based on web-scraped data from an online portal for real estate services can be a leading indicator of housing prices.[12] During the pandemic, Google searches on topics related to job retention schemes and layoffs provided early insight into the strong impact of the pandemic and related policy measures. Moreover, online data on job posting and hiring in the euro area have complemented official statistics (see Box 1).
Box 1
Monitoring labour market developments during the pandemic
This box shows how high-frequency data on hiring was helpful for monitoring labour market developments in the euro area during the pandemic. The COVID-19 crisis had a large downward impact on the number of hires in the euro area labour market. Lockdowns and other containment measures suppressed labour demand and discouraged the search efforts of some workers who lost their jobs and transitioned into inactivity.[13] Moreover, both the heightened macroeconomic uncertainty during the COVID-19 crisis and the widespread use of job retention schemes further reduced the incentives for firms to hire, albeit for different reasons. The heightened uncertainty encouraged firms to lower their operating costs and delay any plans to expand their workforce. By contrast, job retention schemes protected employment and supported jobs, thus incentivising labour hoarding and allowing firms to avoid high re-hiring costs when economic expansion resumes.[14]
The LinkedIn hiring rate complements the information that can be retrieved from the official statistical data, providing a timely, high-frequency indicator on gross hires in the euro area during the pandemic.[15] Hires in the euro area can only be observed imperfectly in the official statistical data, by analysing transitions between employment and non-employment. Two main caveats arise when using official data to assess hire behaviour in the euro area. First, official data are not very timely, generally only becoming available around two quarters later. Second, these data only allow quantification of net flows into (or out of) employment and do not provide any information on job-to-job transitions.[16] The LinkedIn hiring rate provides a more timely, high-frequency signal that can provide information on the number of hires in the euro area. It comprises high-frequency data on gross hires, identifying both movements from non-employment into employment and job-to-job transitions.
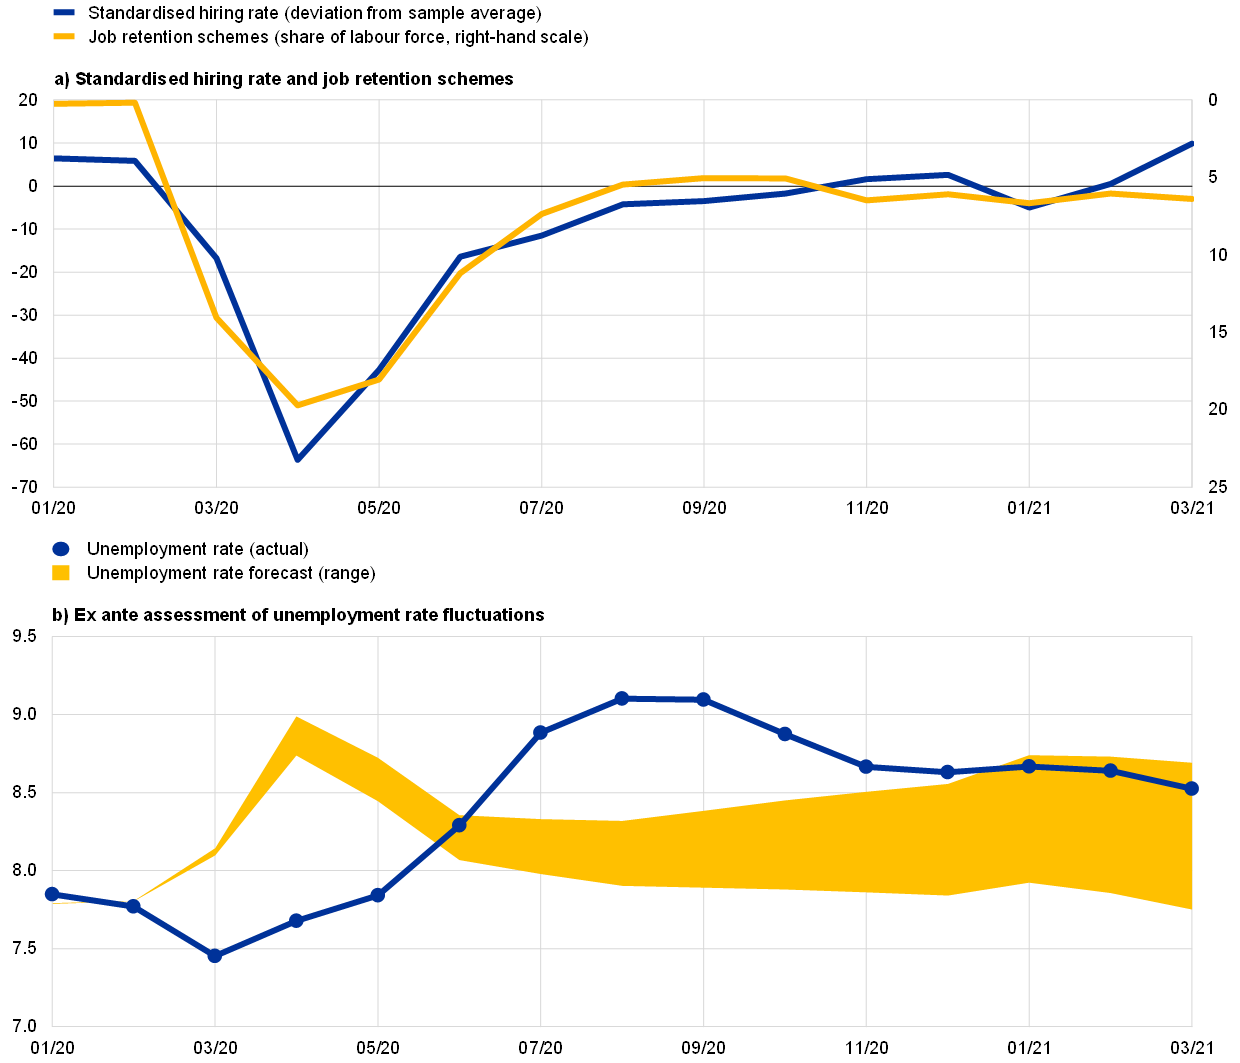
The standardised LinkedIn hiring rate is first calculated for each of the four largest euro area countries (France, Germany, Italy and Spain – the EA-4) by filtering out seasonal patterns and country-specific artificial trends related to the market performance of LinkedIn. The EA-4 country information is aggregated as a weighted average of the country-specific standardised hiring rates using employment as weights. The EA-4 hiring rate declined significantly at the start of the pandemic before recovering during the second half of 2020 (Chart A, panel (a)). After standing at around 6% above average during the first two months of 2020, it fell suddenly to 63% below average in April 2020 following the onset of the COVID-19 crisis and slowly rebounded to surpass its average level in November 2020. It then returned to below average in January 2021, when more stringent lockdowns were imposed, and recovered again thereafter. Interestingly, the decline in the number of hires paralleled the increase in job retention schemes during the pandemic. In April 2021 the standardised hiring rate stood at 14% above average in the EA-4 aggregate.
Chart A
Monitoring the EA-4 labour market using high-frequency data
(percentages)
Sources: Eurostat, LinkedIn, German Institute for Employment Research (IAB), ifo Institute, French Ministry of Labour, Employment and Economic Inclusion, Italian National Institute for Social Security, Spanish Ministry of Inclusion, Social Security and Migrations, and ECB staff calculations.
Notes: The hiring rate is calculated as the percentage of LinkedIn members who started a job in a given month and added a new employer to their profile in that month, divided by the total number of LinkedIn members in that country. To adjust for artificial trends related to the market performance of the platform and for seasonal patterns and spikes due to specific calendar dates, for each country we have filtered out the effects of a series of monthly dummy variables and a linear, yearly trend on the hiring rate. This allow us to express the estimated standardised hiring rate as percentage deviations from the sample average. The forecast of the monthly unemployment rate follows the box entitled “High-frequency data developments in the euro area labour market” in Issue 5/2020 of the ECB’s Economic Bulletin, starting in January 2020, implying that the range of plausible forecasts for the unemployment rate in 2020-21 is conditional on the unemployment rate in December 2019.
The high-frequency information provided by the hiring rate can also be used to assess fluctuations in the unemployment rate during the pandemic. Following the box entitled “High-frequency data developments in the euro area labour market” in Issue 5/2020 of the ECB’s Economic Bulletin, we conduct a forecasting exercise linking the high-frequency information of the LinkedIn hiring rate to the job finding rate and using the implied path of the aggregate job finding rate as a proxy for the point-in-time, steady-state unemployment rate. This is then used to forecast the fluctuations in the unemployment rate during the pandemic.[17] We thus compare the observed fluctuations in the unemployment rate from March 2020 onwards with those implied by the high-frequency information within the standardised hiring rate for the EA-4 aggregate.
The forecast for the unemployment rate using the high-frequency hiring rate provides an early signal of the increase in the unemployment rate for the EA-4 aggregate. Chart A (panel (b)) compares the actual unemployment rate with the ex ante conditional forecast of the unemployment rate using the high-frequency hiring rate and based on the unemployment rate in December 2019. The early signal peak in the unemployment rate forecast in April 2020 at 8.8% is comparable in magnitude with the later August 2020 peak in the actual unemployment rate at 9.1%. More recently, in March 2021 the actual unemployment rate of the EA-4 aggregate was 8.5%, within the plausible range of between 7.8% and 8.7% forecast using the high-frequency hiring rate. The early peak for the forecast unemployment rate was driven by the contraction in the high-frequency hiring rate, which reflected the hiring freezes that followed the widespread use of job retention schemes and allowed separations to remain broadly constant over the initial period of the pandemic. By contrast, most of the recent variation in the unemployment rate (including its stabilisation) has stemmed from an increase in the separation rate.
The experience gained with structured and unstructured data prior to the pandemic made it easier to deploy models quickly to facilitate the real-time assessment of the economic situation during the pandemic. In particular, these data have been used to assess the degree of slack in the labour market and to measure the decline in economic activity, seen from both the supply and the demand side. During this period of sudden economic disruption, high-frequency alternative data such as electricity consumption, card payments, job postings, air quality and mobility statistics have been crucial for gaining a timely picture of the economic impact of the pandemic and the associated containment measures, weeks before hard and survey data were released. Payment data have been key to understanding the developments in private consumption, one of the demand components most severely affected by the crisis.[18] Consumption of key inputs such electricity, gas and fuel was used as a proxy for production in some sectors. A timely understanding of developments in the services sector, with a special focus on small businesses in certain service activities such as tourism which have borne the brunt of the crisis, was also very important. High-frequency information available for these sectors related mostly to sales (e.g. sales in tax returns, card payments), online bookings and Google searches. Other indicators such as freight movements, numbers of flights and air quality were informative as rough proxies for economic activity.
One effective way of summarising information from a set of high-frequency indicators is to use economic activity trackers. Box 2 provides an example of a weekly economic activity tracker for the euro area devised by the ECB. Similarly, the European Commission’s Joint Research Centre and Directorate-General for Economic and Financial Affairs have been tracking the COVID-19 crisis by combining traditional macroeconomic indicators with a high number of non-conventional, real-time and extremely heterogeneous indicators for the four largest economies in the euro area.[19] They have developed a toolbox with a suite of diverse models, including linear and non-linear models and several ML methods, to exploit the large number of indicators in the dataset for nowcasting GDP. The GDP forecasts are produced by first estimating the whole set (thousands) of models and then applying automatic model selection to average out the forecasts and produce the final forecast.
Box 2
A weekly economic activity tracker for the euro area
Since the onset of the pandemic, several central banks and international institutions have developed experimental daily or weekly economic activity trackers by combining several high-frequency indicators.[20] The Federal Reserve Bank of New York, for example, produces the Weekly Economic Index (WEI) that combines seven weekly indicators for the US economy.[21] Based on a similar methodology, the Deutsche Bundesbank publishes the weekly activity index (WAI) for the German economy, which combines nine weekly indicators but also includes monthly industrial production and quarterly GDP.[22] Also, the OECD has developed a weekly activity tracker for several countries based on Google Trends data.[23]
Although these indicators are appealing, their development presents three key technical issues. First, the short time span available for high-frequency data makes them less reliable for establishing econometric relations which prove stable over time, compared to long time series of monthly economic indicators.[24] Second, high-frequency indicators are extremely noisy, exhibit complex seasonal patterns and, in some cases, may be subject to frequent data revisions. In the special circumstances associated with the COVID-19 crisis, these indicators were very informative (i.e. the signal-to-noise ratio was high), but in normal times it is still open to question whether these will only add noise to the already reliable signal obtained from the standard monthly indicators.[25] Third, the procedure to select indicators has not been standardised. Up to now, most work has used high-frequency indicators that are readily available for each economy. The lack of harmonised selection procedures reduces the scope to “learn from the cross-section” and accentuates the representativeness problem mentioned above.
The weekly economic activity tracker for the euro area proposed in this box addresses these issues by combining reliable monthly indicators that have a long history of good predictive performance with timely high-frequency (non-standard) indicators. The indicators have been selected according to several criteria: (i) availability of a long enough history (at least three years), (ii) not too noisy, and (iii) the weight of the indicator in the aggregate that combines all of them (a principal component in the case of the indicator discussed here) is statistically significant and economically meaningful.[26]
The design of the tracker is based on principal component analysis (PCA) with unbalanced data, as described by Stock and Watson.[27] First, a tracker using only weekly series is computed by PCA to fill the missing observations at the beginning and, if necessary, the end of the sample. The weekly series are transformed into month-on-month growth rates.[28] If necessary, seasonal adjustment methods are used to eliminate any seasonal effects. Second, the monthly variables are transformed into weekly frequency by imputing the same monthly level for all weeks of the month. Then, the month-on-month growth rates are computed for every week. With all this information, the PCA is run again including all the indicators which were originally available at weekly and monthly frequency. The first principal component is the tracker, which represents the evolution of monthly activity on a weekly frequency (Chart A, panel (a)).[29] Visualising the tracker in levels and monthly frequency gives an idea of the magnitude of the output loss associated with the pandemic compared with pre-pandemic levels. Most importantly, the evolution of the tracker in levels over 2020 mirrors the evolution of GDP very well (Chart A, panel (b)). Overall, the relatively good performance of the tracker, which strikes a good balance between timely and reliable indicators, makes it a useful tool for tracking economic activity in real time.
Chart A
Euro area economic activity tracker
(panel (a): month-on-month percentages; panel (b): levels, 100=December 2019 or Q4 2019)

Sources: ECB staff calculations and Eurostat.
Note: The latest observations are for the week of 29 May 2021 for the trackers and Q1 2021 for GDP.
3 What makes machine learning algorithms useful tools for analysing big data?
While big data can help improve the forecasts of GDP and other macroeconomic aggregates, their full potential can be exploited by employing ML algorithms. Section 2 shows that in many cases, the improvement in forecasting performance relates to specific situations, such as when traditional monthly indicators for the reference quarter are not yet available. This section focuses on the modelling framework, arguing that ML methods help to reap the benefits of using big data. The main goal of ML techniques is to find patterns in data or to predict a target variable. Although ML algorithms estimate and validate predictive models in a subset of data (training sample), the ultimate aim is to obtain the best forecasting performance using a different subset of data (test sample). The distinction between machine learning and traditional methods is not clear-cut since some traditional methods (e.g. linear regression, principal components) are also quite popular in the ML literature. However, the literature on machine learning has developed a host of new and sophisticated models that promise to strongly enrich the toolbox of applied economists. Moreover, it also seems fair to say that, so far, machine learning has been mostly focused on prediction, while more traditional econometric and statistical analysis is also interested in uncovering the causal relationships between economic variables.[30] This is changing fast, as more and more researchers in the ML field address the issue of inference and causality, although this frontier research is not yet widely applied in the policy context.[31] The aim of this section is to discuss how machine learning can usefully complement traditional econometric methods, in particular to leverage the opportunities for analysing the business cycle offered by big data. It also reviews several contributions to forecasting/nowcasting GDP (see Box 3) and provides examples of how ML algorithms can provide interesting insights for policy, such as pointing towards the sources of economic policy uncertainty (see Box 4).
The size of the newly available databases in itself often constitutes an obstacle to the use of traditional econometrics. Techniques have been adopted to reduce the dimensionality of the data, including traditional methods such as factor models and principal component analysis, but more often going into newer versions of machine learning. While a description of specific methods is beyond the scope of this article, it is important to note that ML methods have several desirable features for summarising the data, allowing precise reduction of high-dimensional data into a number of manageable indicators.
The first key advantage of ML methods is their ability to extract and select the relevant information from large volumes of, unstructured data. When dealing with big data, the presence of a large amount of mostly irrelevant information engenders the problem of data selection. This issue is magnified by the presence of large, unstructured datasets.[32] In some simple cases, the forecaster can pick variables manually; this is normally possible when forecasting very specific quantities. The seminal work of Choi and Varian with Google Trends, for instance, focuses on car sales, unemployment claims, travel destination planning and consumer confidence.[33] Where macroeconomic aggregates are involved, the choosing of relevant variables quickly becomes intractable. ML methods offer very useful tools for selecting the most informative variables and exploiting their information potential. Several techniques derived from the model-averaging literature have also proved popular and successful in improving forecasting accuracy. In these methods, a large number of econometric models are first estimated, their forecasting performance is then evaluated, and the final forecast is obtained by averaging the forecasts of the best models, thus retaining those models and explanatory variables that provide useful information. Similarly, what are known as ensemble methods such as random forests and bagging combine different “views” of the data given by competing models, adding flexibility and robustness to the predictions.
The second key advantage of ML methods is their ability to capture quite general forms of non-linearities. This is a general advantage of ML methods, regardless of the volume of data concerned; however, the issue is that, by their very nature, big data may be particularly prone to non-linearities. For instance, the data stemming from social networks present a good way to understand these inherent non-linearities. In this case, a specific topic can generate cascade or snowball effects within the network which cannot be channelled in linear regression models. Other examples include Google Trends and Google search categories, which are compiled using ML algorithms that determine the category to which an internet search belongs.[34] Text data are also obtained by applying highly non-linear ML algorithms to news items, for example. More generally, non-linearities and interactions between variables are common in macroeconomics owing to the presence of financial frictions and uncertainty. Several works have found that ML methods can be useful for macroeconomic forecasting, since they better capture non-linearities (e.g. Coulombe et al.). These methods can, for instance, capture the non-linear relationship between financial conditions and economic activity, among others, and hence more accurately predict activity and recessions in particular (see Box 3). Also, ML methods can outperform standard methods (e.g. credit scoring models, logistic regression) when predicting consumer and corporate defaults, since they capture non-linear relationships between the incidence of default and the characteristics of the individuals.[35]
The COVID-19 pandemic is an important source of non-linearities. During the pandemic, many macroeconomic variables have recorded extreme values that are far from the range of past values. Econometric methods such as linear time series analysis seek to find average patterns in past data. If current data are very different, linearly extrapolating from past patterns may lead to biased results. Central banks, the European Commission and other institutions have adapted their nowcasting frameworks to capture non-standard data and non-linearities.[36]
Finally, ML techniques are the main tool used to capture a wide set of phenomena that would otherwise remain unquantified. The most prominent example in recent years is the dramatic surge of text data analysis. Today, broad corpuses of text are analysed and converted into numbers that forecasters can use. For instance, a wide range of timely, yet noisy confidence indicators based on text currently complement the traditional surveys, which are available with considerable lags and where agents do not necessarily “vote with their behaviour”, as well as market-based indicators, where expectations and other factors such as risk aversion compound in the data. A first generation of work built on word counts has been followed by more sophisticated approaches.[37] Second-generation techniques based on unsupervised learning are also used in public institutions, and in particular in central banks, to assess the effect of their communication. Finally, following Baker et al., concepts such as economic policy uncertainty which were previously difficult to quantify are now currently assessed on the basis of their economic consequences and used in forecasting.[38] See Box 3 and Box 4 for examples.
Box 3
Nowcasting euro area real GDP growth with newspaper-based sentiment
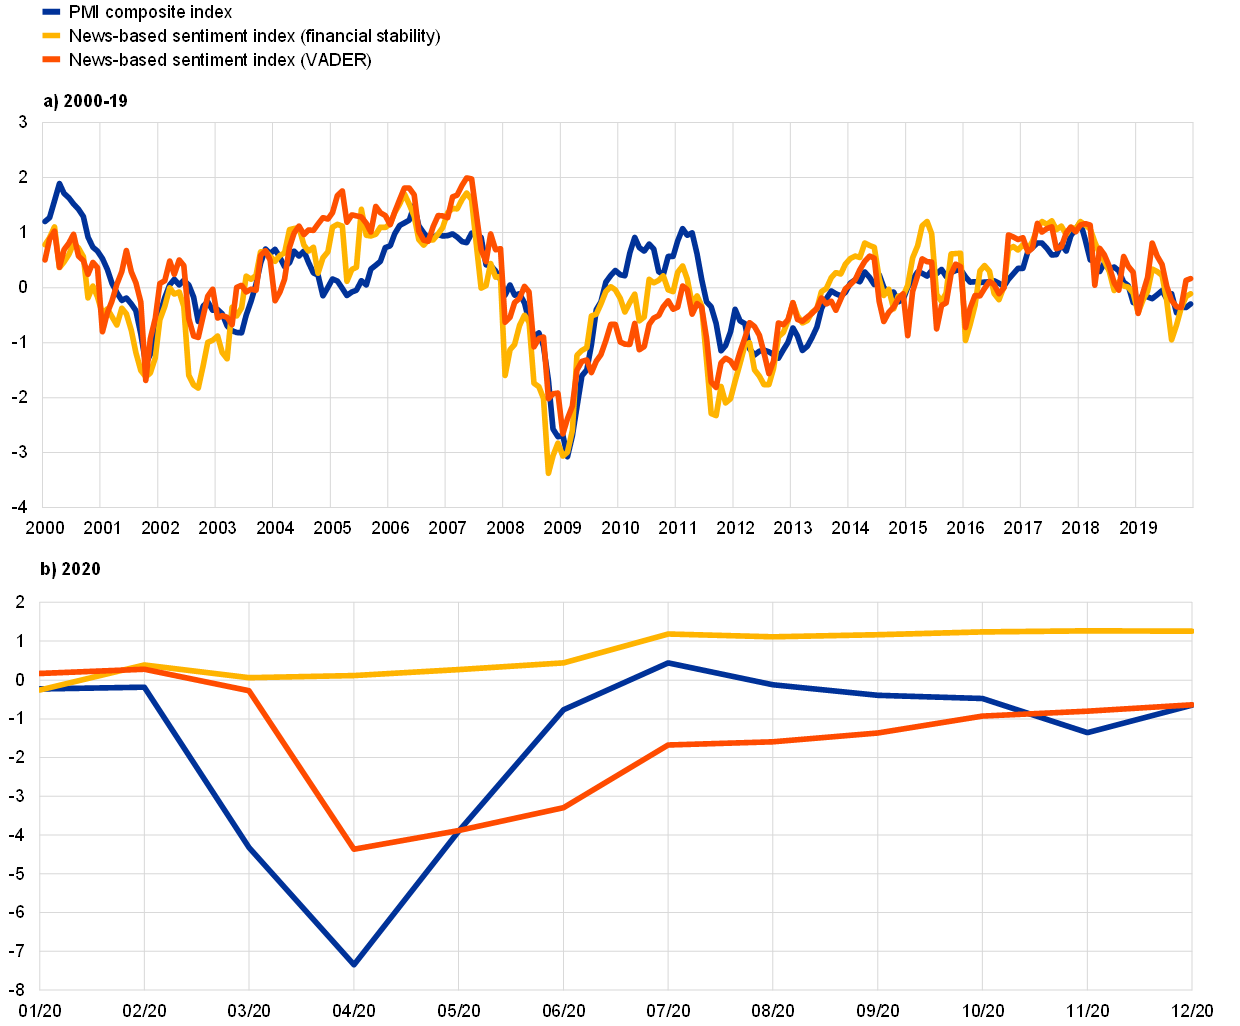
This box presents economic sentiment indicators for the euro area derived from newspaper articles in the four largest euro area countries in their main national languages.[39][40] Available at daily frequency, these indicators contain timely economic signals which are comparable to those from well-known sentiment indicators such as the Purchasing Managers’ Index (PMI). Furthermore, they can materially improve nowcasts of real GDP growth in the euro area.
In the literature, two approaches are typically followed for building sentiment metrics from textual data. The most popular is to use simple word counts based on predetermined sets of words, known as dictionaries or lexicons. However, most of the dictionaries have been developed for the English language. For the euro area, the multilingual environment makes it necessary to either develop new dictionaries for other languages or translate texts into English. Alternatively, more computationally demanding model-based methods such as semantic clustering or topic modelling can extract topics which can be approximated to sentiment and its drivers. In this box, the sentiment metrics are based on counts of words in the news articles translated into English, relying on several well-known English language dictionaries.[41] For the sake of space, only the sentiment metrics based on the financial stability-based dictionary and the general-purpose dictionary VADER are reported.[42]
Regardless of the dictionary used, and despite some noisiness, the newspaper-based sentiment metrics are highly correlated with the PMI composite index in the period from 2000 to 2019 (Chart A, panel (a)). This confirms that these measures are actually capturing sentiment. However, the choice of dictionary matters when it comes to detecting turning points. The first sentiment metric captures the Great Recession very well, unsurprisingly given the financial nature of this crisis. But this metric fails to encapsulate the COVID-19 crisis (Chart A, panel (b)), although its evolution is consistent with the behaviour of the financial markets and the financing conditions which have remained favourable in the context of very strong policy response. By contrast, the general-purpose dictionary is more consistent and robust across time. Therefore, it appears that the nature of economic shocks may play a significant role in identifying the most appropriate text dictionary to be used.
Chart A
PMI and newspaper-based sentiment indexes for the euro area
(standardised units)
Sources: ECB staff calculations, Factiva, IHS Markit and Eurostat.
Notes: The news-based sentiment indicator is based on newspaper articles from the four largest euro area countries. The metric used is the sum of positive and negative words using either a financial stability dictionary (Correa et al.) or VADER, a more general-purpose dictionary. The PMI composite index and the news-based sentiment indicators are standardised using historical mean and variance.
Various studies have found that text analysis can significantly improve forecasts of key macroeconomic variables.[43] Some forecast accuracy gains (not shown) are found for real-time GDP nowcasts derived using the PMI composite index and the text-based sentiment indicators as key predictors. They are typically concentrated in the nowcasts produced in the first half of the quarter (i.e. first six weeks), when most other indicators used to nowcast GDP are not yet available. This result is in line with other works in the literature. However, an important point is that the type of model matters to fully reap the true benefits of the timeliness of text-based information. Standard linear methods (e.g. ordinary least squares linear regression) work well in calm times when there are no big shifts in the economic outlook. When extreme economic shocks occur, however, ML models can capture non-linearities and filter out the noise (Chart B). Ridge regressions captured the financial crisis better, as shown by the fact that they have the lowest Root Mean Squared Forecast Error (RMSFE), particularly when including the sentiment metric based on the financial stability dictionary. However, the best-performing models during the pandemic have been the neural networks, which were the worst-performing models during the financial crisis. This could be explained by the fact that before the financial crisis, there were no other similar crises in the training sample from which the model could learn. Indeed, one of the criticisms of the more complex ML models is that they need large amounts of data to learn (i.e. they are “data hungry”).
Chart B
Forecast accuracy
RMSFE
(percentage points)

Source: ECB staff calculations.
Notes: The chart reports the RMSFE over a rolling window of eight quarters. The forecasts are updated at the end of the first month of the reference quarter. The reference variable is the vintage of real GDP growth as of 24 March 2021.
Box 4
Sources of economic policy uncertainty in the euro area and their impact on demand components
This box describes how big data and machine learning (ML) analysis can be applied to the measurement of uncertainty using textual data. Similarly to “economic sentiment”, uncertainty is not directly observable and can only be measured using proxies. Recent developments in the literature have shown that textual data can provide good proxies for this latent variable. For instance, the seminal work by Baker, Bloom and Davies proposed building an economic policy uncertainty (EPU) index using a pre-specified set of keywords in newspaper articles.[44] Recent research by the ECB has built an EPU index across the four largest euro area countries by applying ML algorithms to newspaper articles.[45] The main advantage of this approach is that it can be easily applied to different languages without relying on keywords, given that the underlying algorithm classifies text into topics without prior information. This feature makes it less prone to selection bias. Moreover, this approach retrieves topics underpinning aggregate economic policy uncertainty (e.g. fiscal, monetary or trade policy uncertainty) in newspaper articles. This can be particularly useful for building narratives and economic analysis.[46] ML methods applied to a sample of newspaper articles from France, Germany, Italy and Spain over the sample period from 2000 to 2019 consistently revealed the following topics or sources of economic policy uncertainty: monetary policy; fiscal policy; political, geopolitical and trade policy; European regulation; domestic regulation; and energy policy.
Economic policy uncertainty stems from different sources which affect consumers’ and firms’ decisions differently. For instance, increases in uncertainty regarding future tariffs can have an impact on a firm’s determination to build a new production plant or to start exporting to a new market. This is because the role of future conditions is particularly relevant for costly, irreversible decisions. By contrast, uncertainty about the future monetary policy stance can be important for both firms’ and consumers’ spending decisions, since it will influence their expectations about future economic developments and financing conditions.
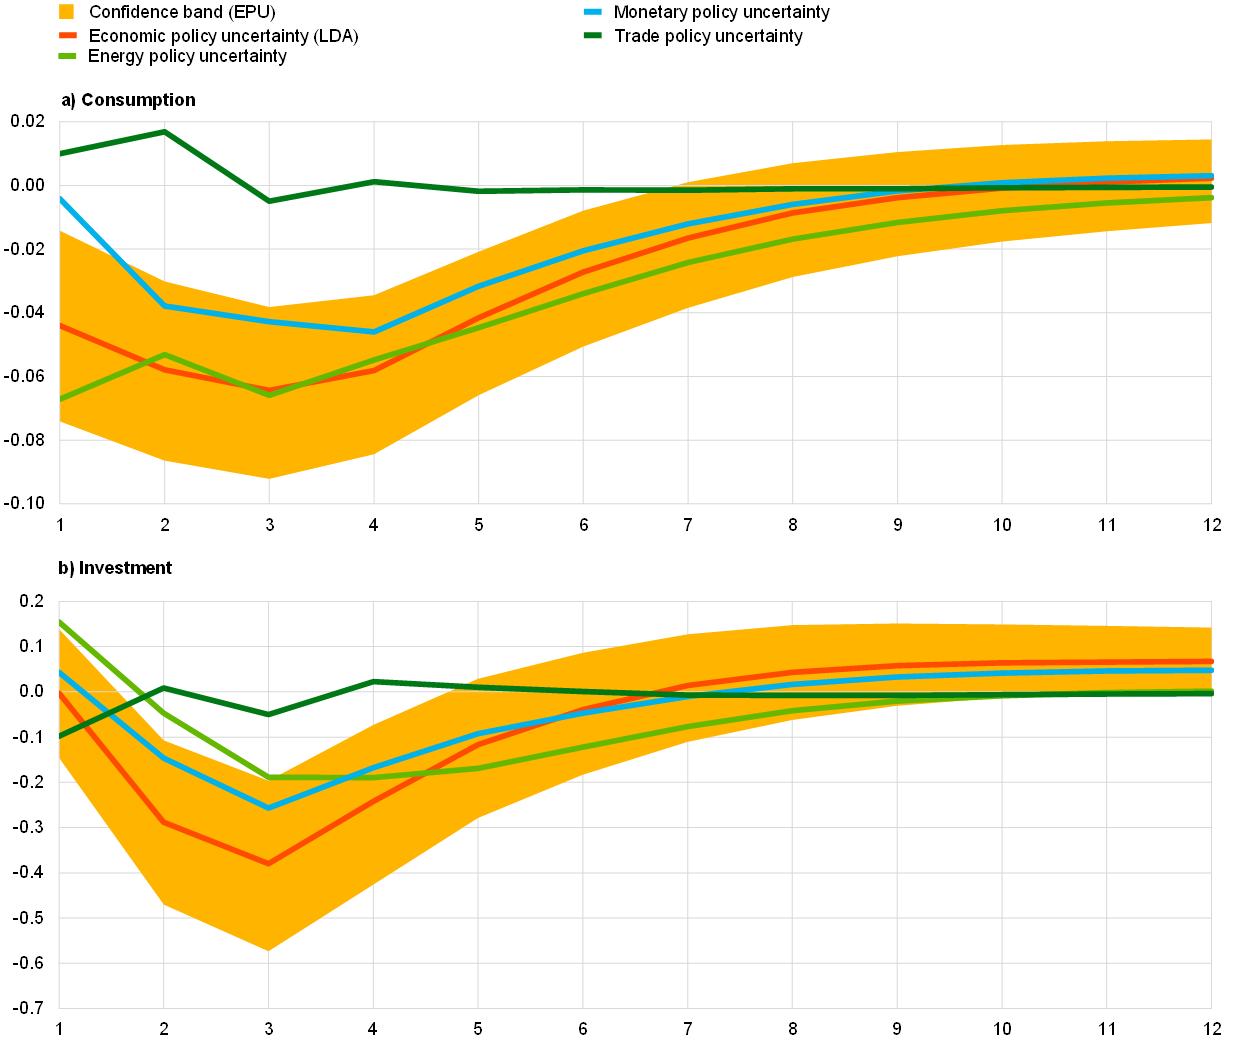
A simple structural vector autoregression (SVAR) analysis confirms that increases in (ML-based) EPU have a significant negative impact on private consumption and business investment proxied by investment in machinery and equipment in the euro area. The impact on investment is greater than on consumption, suggesting that uncertainty may have more of an impact on the supply side.[47] As regards sources of economic policy uncertainty, the focus is only on energy, trade and monetary policy uncertainty for the sake of space. As expected, monetary policy uncertainty shocks have a clear negative impact on both investment and consumption. By contrast, the impact of increases in trade policy uncertainty is insignificant in both cases. Moreover, increases in energy policy uncertainty depress consumption to a greater extent than other sources, while their effect on investment, albeit weaker, is more persistent over time. While these are aggregate results, EPU is likely to play a more relevant role for firm-level capital investment than at aggregate level.[48]
Chart A
Impulse responses of consumption (panel (a)) and investment (panel (b)) to economic policy uncertainty shocks
(y-axis: percentage points; x-axis: quarters)
Sources: Azqueta-Gavaldón et al. and Eurostat.
Notes: The impulse responses illustrate the response of consumption and investment to a positive one standard deviation shock in each of the measures of economic policy uncertainty. They are estimated with Bayesian structural vector autoregressions (SVAR), and the shocks are identified using a Cholesky decomposition with the variables in the following order: exports of goods and services, measure of economic policy uncertainty, private consumption, machinery and equipment investment, shadow short rate and EURO STOXX. All the variables are in quarterly growth rates, except for the shadow short rate, which is in levels. The estimation period is from 2000 to 2019. The measures of uncertainty are standardised so that the size of the shock is comparable. The confidence band corresponds to the 68% credibility band of the SVAR with the economic policy uncertainty index.
4 Conclusions, challenges and opportunities
This article has described how big data and ML methods can complement standard analysis of the business cycle. A case in point is the coronavirus pandemic, which represents an extraordinary shock. This crisis has propelled the dissemination and refinement of ML techniques and big data at an unprecedented speed. In particular, it has shown that alternative sources of data can provide more timely signals on the state of the economy and help to track economic activity. Furthermore, it is an important showcase for non-linearities in the economy, which has required existing models to be adapted or new approaches to be developed. In this respect, ML methods can deal with non-linearities more easily than traditional methods. Besides new opportunities, these new data sources and methods also pose some challenges.
Big data allow a wider range of timely indicators to be used for forecasting (e.g. text-based or internet-based indicators), although in some cases this can entail replicability and accountability issues. Text-based sentiment indicators are particularly useful, for instance, given that they can be produced automatically at higher frequency and at lower cost than survey-based indicators. While the construction of conventional economic data, such as industrial production, follows harmonised procedures to ensure high quality, continuity and comparability over time and countries, alternative data are neither collected primarily for economic analysis, nor sourced and validated by independent statistical offices. Therefore, their application in decision-making processes exposes central banks to various risks, given that the replicability of results and accountability could be impaired. Since alternative data are collected for other purposes (e.g. credit card transactions) or come as the by-product of another service (e.g. news articles from the digitisation of newspapers), the data are often very noisy and require careful treatment. Moreover, the existence of significant data accessibility issues and limitations to data sharing could impair the replicability of the results in some cases. All these risks require careful consideration when investing scarce resources in software development and legal issues, as well as customising IT infrastructure.[49]
Although useful as complements, at the moment these tools cannot be considered as substitutes for standard data and methods due to issues of interpretability and statistical inference. ML methods can help overcome the shortcomings of big data and exploit their full potential. When combined with big data, ML methods are capable of outperforming traditional statistical methods and providing an accurate picture of economic developments. Despite the good forecasting performance, the complexity of the methods often makes it difficult to interpret revisions to the forecasts and most importantly to communicate them. However, rapid advances are being made on enhancing the interpretability of ML techniques (most recently based on Shapley values).[50] In addition, ML techniques are not originally designed to identify causal relationships, which is of critical importance to policymakers. Enhancing the ability of ML methods to capture causality is currently the biggest challenge; this has the potential to make ML techniques promising complements and viable alternatives to established methods.[51]
- Although more Vs have been added to the list over recent years, these are not so widely accepted as they are difficult to quantify (e.g. “veracity”, or truthfulness of the data, and “value”, meaning that big data might create social or economic value).
- See Hammer, C., Kostroch, D.C. and Quirós-Romero, G., “Big Data: Potential, Challenges and Statistical Implications”, Staff Discussion Notes, Vol. 2017, Issue 006, International Monetary Fund, 2017.
- Artificial intelligence can be defined as the computer science that focuses on the development of machines that mimic human cognitive functions such as learning or problem solving.
- For the Netherlands, see Verbaan, R., Bolt, W. and van der Cruijsen, C., “Using debit card payments data for nowcasting Dutch household consumption”, DNB Working Papers, No 571, De Nederlandsche Bank, 2017. For Spain, see Conesa, C., Gambacorta, L., Gorjon, S. and Lombardi, M.J., “The use of payment systems data as early indicators of economic activity”, Applied Economics Letters, Vol. 22, Issue 8, 2015, pp. 646-650. For Portugal, see Esteves, P., “Are ATM/POS data relevant when nowcasting private consumption?”, Working Paper, No 25/2009, Banco de Portugal, 2009. For Norway, see Aastveit, K.A., Fastbø, T.M., Granziera, E., Paulsen, K.S. and Torstensen, K.N., “Nowcasting Norwegian household consumption with debit card transaction data”, Working Paper, No 17/2020, Norges Bank, 2020.
- For Italy, see Aprigliano, V., Ardizzi, G. and Monteforte, L., “Using Payment System Data to Forecast Economic Activity”, International Journal of Central Banking, Vol. 15, No 4, October 2019, pp. 55-80.
- See Huang, C., Simpson, S., Ulybina, D. and Roitman, A., “News-based Sentiment Indicators”, IMF Working Paper, Vol. 2019, Issue 273, International Monetary Fund, 2019.
- For Italy, see Aprigliano, V., Emiliozzi, S., Guaitoli, G., Luciani, A., Marcucci, J. and Monteforte, L., “The power of text-based indicators in forecasting the Italian economic activity”, Working Papers, No 1321, Banca d’Italia, 2021. For Spain, see Aguilar, P., Ghirelli, C., Pacce, M. and Urtasun, A., “Can news help measure economic sentiment? An application in COVID-19 times”, Economics Letters, Vol. 199, 2021, and Ghirelli, C., Pérez, J.J. and Urtasun, A., “A new economic policy uncertainty index for Spain”, Economics Letters, Vol. 182, 2019, pp. 64-67.
- See Algaba, A., Borms, S., Boudt, K. and Verbeken, B., “Daily news sentiment and monthly surveys: A mixed-frequency dynamic factor model for nowcasting consumer confidence”, Working Paper Research, No 396, Nationale Bank van België/Banque Nationale de Belgique, 2021.
- For nowcasting of euro area car sales, see Nymand-Andersen, P. and Pantelidis, E., “Google econometrics: nowcasting euro area car sales and big data quality requirements”, Statistics Paper Series, No 30, ECB, 2018. For nowcasting of Spanish private consumption, see Gil, M., Pérez, J.J., Sanchez Fuentes, A.J. and Urtasun, A., “Nowcasting Private Consumption: Traditional Indicators, Uncertainty Measures, Credit Cards and Some Internet Data”, Working Paper, No 1842, Banco de España, 2018. For nowcasting of German GDP, see Götz, T.B. and Knetsch, T.A., “Google data in bridge equation models for GDP”, International Journal of Forecasting, Vol. 35, Issue 1, January-March 2019, pp. 45-66. For nowcasting of euro area GDP, see Ferrara L. and Simoni, A., “When are Google data useful to nowcast GDP? An approach via pre-selection and shrinkage”, Working Paper, No 717, Banque de France, 2019.
- D’Amuri, F. and Marcucci, J., “The predictive power of Google searches in forecasting US unemployment”, International Journal of Forecasting, Vol. 33, Issue 4, October-December 2017, pp. 801-816.
- Furthermore, they showed that online job posting data can provide granular information about skills most demanded by employers and jobs and salaries most searched by workers. See Adrjan, P. and Lydon, R., “Clicks and jobs: measuring labour market tightness using online data,” Economic Letters, Vol. 2019, No 6, Central Bank of Ireland, 2019.
- Loberto, M., Luciani, A. and Pangallo, M., “The potential of big housing data: an application to the Italian real-estate market”, Working Papers, No 1171, Banca d’Italia, 2018.
- For a comprehensive assessment of the impact of the pandemic on the euro area labour market, see the article entitled “The impact of the COVID-19 pandemic on the euro area labour market”, Economic Bulletin, Issue 8, ECB, 2020.
- Labour hoarding can be defined as the part of labour input which is not fully utilised by a company during its production process at any given point in time. Labour hoarding can potentially help firms avoid re-hiring and training costs when economic conditions improve following a recession.
- For an initial assessment of the impact of the pandemic on the euro area labour market using high-frequency data and the LinkedIn hiring rate, see the box entitled “High-frequency data developments in the euro area labour market”, Economic Bulletin, Issue 5, ECB, 2020.
- Transitions from employment into employment gather information on both job-to-job transitions and workers that have not moved jobs during the same period (the vast majority). Job-to-job transitions are, however, important for adjustment in the labour market, as they contribute positively to nominal wage growth. See Karahan, F., Michaels, R., Pugsley, B., Şahin, A. and Schuh, R., “Do Job-to-Job Transitions Drive Wage Fluctuations over the Business Cycle?”, American Economic Review, Vol. 107, No 5, pp. 353-357, 2017, who find this result for the United States, and Berson, C., De Philippis, M. and Viviano, E., “Job-to-job flows and wage dynamics in France and Italy”, Occasional Papers, No 563, Bank of Italy, Economic Research and International Relations Area, 2020, who find a similar result for France and Italy, albeit to a lesser extent.
- In a similar way, several profiles are drawn up for the unemployment rate forecast on the basis of the estimated long-term coefficients for the job finding rate and the assumptions underpinning the separation rates. We consider two scenarios for the separation rate: (i) no change with respect to the fourth quarter of 2019, and (ii) a monthly increase in the separation rate comparable to half of that observed during the average month during the global financial crisis. This is an important caveat to this exercise. Separation rates have also been affected by the significant policy support that has benefited both firms and workers alike, including the widespread use of job retention schemes. As such, the impact that a reduction in policy support may have on the separation rate and the unemployment rate as economic activity resumes warrants further analysis.
- Carvalho et al., for instance, use credit card spending data to track the impact of the pandemic on consumption in Spain. They find a strong response in consumption due to lockdowns and their easing at national and regional levels, particularly in the goods basket of low-income households. Carvalho, V.M., Hansen, S., Ortiz, Á., García, J.R., Rodrigo, T., Rodriguez Mora, S. and Ruiz, J., “Tracking the COVID-19 Crisis with High-Resolution Transaction Data”, CEPR Discussion Papers, No 14642, Centre for Economic Policy Research, 2020.
- In particular, this includes Google searches, views of Wikipedia pages, air quality indicators (where pollution acts as an indicator of activity), aviation micro data, news-based indicators on subjects such as the economy, unemployment and inflation, news-based sentiment, electricity prices and consumption corrected for weather conditions, indicators from Airbnb data, indicators of mobility based on mobile phone data, Google mobility indicators and HGV toll data.
- Several papers were presented at the ECB Workshop “Tracking the economy with high-frequency data”, 16 October 2020.
- See Lewis, D.J., Mertens, K., Stock, J.H. and Trivedi, M., “Measuring Real Activity Using a Weekly Economic Index”, Federal Reserve Bank of New York Staff Report, No 920, 2020.
- See Eraslan, S. and Götz, T., “An unconventional weekly activity index for Germany”, Technical Paper, No 02/2020, Deutsche Bundesbank, 2020.
- See Woloszko, N., “Tracking activity in real time with Google Trends”, OECD Economics Department Working Papers, No 1634, OECD, 2020.
- Readers might be interested in the following recommended surveys of the literature: Banbura, M., Giannone, D. and Reichlin, L., “Nowcasting”, in Clements, M.P. and Hendry D.F. (eds), Oxford Handbook of Economic Forecasting, Oxford University Press, 2011, pp. 63-90; Camacho, M., Pérez-Quirós, G. and Poncela, P., “Short-term Forecasting for Empirical Economists: A Survey of the Recently Proposed Algorithms”, Foundations and Trends in Econometrics, Vol. 6, No 2, 2013, pp. 101-161.
- Delle Chiaie, S. and Pérez-Quirós, G., “High frequency indicators. why? when? and how? A users’ guide”, mimeo, 2021.
- The weekly frequency indicators are electricity consumption, German HGV toll mileage index, Google searches (restaurants, jobs, travel, hotels) and financial indicators (CISS, EURO STOXX, VSTOXX). The monthly frequency indicators are airport cargo and employment for the four largest euro area countries, euro area industrial production, industrial orders, car registrations, retail sales (volume), intra and extra euro area exports of goods (value), PMI composite output and economic sentiment indicator.
- Stock, J.H. and Watson, M.W., “Macroeconomic Forecasting Using Diffusion Indexes”, Journal of Business and Economic Statistics, Vol. 20, Issue 2, 2002, pp. 147-162.
- Since some months have five weeks and others four, the convention used is that the monthly growth rate for the fifth week of the month is always compared with the last week of the previous month.
- By design, the tracker does not have units since PCA requires data standardisation. Therefore, the tracker needs to be re-scaled to make it compatible with the mean and variance of real GDP growth. The scaling factor can be determined using the relation between monthly activity and quarterly activity explained in Mariano and Murasawa. See Mariano, R.S. and Murasawa, Y., “A new coincident index of business cycles based on monthly and quarterly series”, Journal of Applied Econometrics, Vol. 18, Issue 4, 2003, pp. 427-443.
- A good overview of ML concepts and applications in the context of central banking and policy analysis can be found in Chakraborty, C. and Joseph, A., “Machine learning at central banks”, Staff Working Paper, No 674, Bank of England, 2017.
- See, for example, Farrell, M.H., Liang, T. and Misra, S., “Deep Neural Networks for Estimation and Inference”, Econometrica, Vol. 89, No 1, 2021, or Semenova, V., Goldman, M., Chernozhukov, V. and Taddy, M., “Estimation and Inference on Heterogeneous Treatment Effects in High-Dimensional Dynamic Panels”, arXiv.org, 2021.
- See Giannone, D., Lenza, M. and Primiceri, G., “Economic Predictions with Big Data: The Illusion of Sparsity”, Econometrica, forthcoming.
- Choi, H. and Varian, H., “Predicting the Present with Google Trends”, Economic Record, Vol. 88, Issue s1, The Economic Society of Australia, June 2012, pp. 2-9.
- These data are only available as “semi-processed” time series; in particular, they are first detrended according to some criteria known by Google, then resized so that they always have values between 0 and 100.
- See Coulombe, P.G., Leroux, M., Stefanovic, D. and Surprenant, S., “How is Machine Learning Useful for Macroeconomic Forecasting?”, arXiv.org, 2020. For recession probabilities, see Vrontos, S.D., Galakis, J. and Vrontos, I.D., “Modelling and predicting U.S. recessions using machine learning techniques”, International Journal of Forecasting, Vol. 37, Issue 2, 2021, pp. 647-671. For random forest to capture non-linearity between financial conditions and economic activity, see Kiley, M.T., “Financial Conditions and Economic Activity: Insights from Machine Learning”, Finance and Economics Discussion Series, 2020-095, Board of Governors of the Federal Reserve System, 2020. For predictions of consumer defaults, see Albanesi, S. and Vamossy, D.F., “Predicting Consumer Default: A Deep Learning Approach”, NBER Working Paper Series, No w26165, National Bureau of Economic Research, 2019. For corporate defaults, see Pike, T., Sapriza, H. and Zimmermann, T., “Bottom-up leading macroeconomic indicators: An application to non-financial corporate defaults using machine learning”, Finance and Economics Discussion Series, 2019-070, Board of Governors of the Federal Reserve System, 2019.
- See, for instance, Huber, F., Koop, G., Onorante, L., Pfarrhofer, M. and Schreiner, J., “Nowcasting in a pandemic using non-parametric mixed frequency VARs”, Journal of Econometrics, in press, 2020.
- Le, Q. and Mikolov, T., “Distributed Representations of Sentences and Documents”, Proceedings of the 31st International Conference on Machine Learning, Vol. 32, 2014, pp. 1188-1196.
- See Baker, S.R., Bloom, N. and Davis, S.J., “Measuring Economic Policy Uncertainty”, Quarterly Journal of Economics, Vol. 131, Issue 4, 2016, pp. 1593-1636.
- This box summarises the main findings of the paper by Ashwin, Kalamara and Saiz.
Ashwin, J., Kalamara, E. and Saiz, L., “Nowcasting Euro Area GDP with News Sentiment: A Tale of Two Crises”, manuscript, 2021. - The articles come from 15 major print newspapers in France, Germany, Italy and Spain. They have been extracted from Dow Jones Factiva DNA database for the period from 1 January 1998 to 31 December 2020.
- The news articles are translated into English using Google Translate API. Robustness checks have been performed comparing this method with using dictionaries in the national languages or even translating the dictionaries into English. Overall, translating the articles into English provides the most robust and reliable results.
- The financial stability dictionary is taken from Correa, R., Garud, K., Londono-Yarce, J.-M. and Mislang, N., “Constructing a Dictionary for Financial Stability”, IFDP Notes, Board of Governors of the Federal Reserve System, June 2017. The VADER (Valence Aware Dictionary and sEntiment Reasoner) dictionary is taken from Hutto, C.J. and Gilbert, E., “VADER: A Parsimonious Rule-based Model for Sentiment Analysis of Social Media Text”, Eighth International AAAI Conference on Weblogs and Social Media (8th ICWSM 2014), Ann Arbor, MI, June 2014.
- See, for example, Thorsrud, L.A., “Words are the New Numbers: A Newsy Coincident Index of the Business Cycle”, Journal of Business & Economic Statistics, Vol. 38, Issue 2, 2020, pp. 393-409; Larsen, V.H. and Thorsrud, L.A., “The value of news for economic developments”, Journal of Econometrics, Vol. 210, Issue 1, 2019, pp. 203-218; Kalamara, E., Turrell, A., Redl, C., Kapetanios, G. and Kapadia, S., “Making text count: economic forecasting using newspaper text”, Staff Working Paper, No 865, Bank of England, May 2020; Shapiro, A.H., Sudhof, M. and Wilson, D.J., “Measuring news sentiment”, Journal of Econometrics, in press, 2020.
- See Baker, S.R., Bloom, N. and Davis, S.J., “Measuring Economic Policy Uncertainty”, The Quarterly Journal of Economics, Vol. 131, Issue 4, 2016, pp. 1593-1636.
- More specifically, a continuous bag-of-words model is used to identify the words most closely related to “economy” and “uncertainty” in the context of each language. Then, a Latent Dirichlet Allocation (LDA) algorithm is applied to classify news articles into topics. See Azqueta-Gavaldón, A., Hirschbühl, D., Onorante, L. and Saiz, L., “Economic policy uncertainty in the euro area: an unsupervised machine learning approach”, Working Paper Series, No 2359, ECB, January 2020.
- See the box entitled “Sources of economic policy uncertainty in the euro area: a machine learning approach”, Economic Bulletin, Issue 5, ECB, 2019.
- See Born, B. and Pfeifer, J., “Policy risk and the business cycle”, Journal of Monetary Economics, Vol. 68, 2014, pp. 68-85, and Fernández-Villaverde, J., Guerrón-Quintana, P., Kuester, K. and Rubio-Ramírez, J., “Fiscal Volatility Shocks and Economic Activity”, American Economic Review, Vol. 105, No 11, 2015, pp. 3352-3384.
- For instance, Gulen and Ion find evidence that the relation between policy uncertainty and capital investment is not uniform in the cross-section, being significantly stronger for firms with a higher degree of investment irreversibility and for firms that are more dependent on government spending. Husted, Rogers and Sun document evidence that monetary policy uncertainty significantly delays firm-level investment in the United States. See Gulen, H. and Ion, M., “Policy Uncertainty and Corporate Investment”, Review of Financial Studies, Vol. 29, Issue 3, 2016, pp. 523-564, and Husted, L., Rogers, J. and Sun, B., “Monetary policy uncertainty”, Journal of Monetary Economics, Vol. 115, 2020, pp. 20-36.
- Doerr et al. note that a key challenge for central banks is to set up the necessary IT infrastructure. For most applications concerning business cycle analysis, the required computational power is rather low. Doerr, S., Gambacorta, L. and Serena, J.M., “Big data and machine learning in central banking”, BIS Working Papers, No 930, Bank for International Settlements, 2021.
- Joseph proposed a new framework based on Shapley regressions that generalises statistical inference for non-linear or non-parametric models such as artificial neural networks, support vector machines and random forests. See Joseph, A., “Parametric inference with universal function approximators”, Staff Working Paper, No 784, Bank of England, 2019, revised 22 July 2020.
- See Farrell, M.H., Liang, T. and Misra, S., “Deep Neural Networks for Estimation and Inference”, Econometrica, Vol. 89, Issue 1, January 2021, pp. 181-213.