
Interpreting recent developments in market‑based indicators of longer‑term inflation expectations
Published as part of the ECB Economic Bulletin, Issue 6/2018.
Private sector inflation expectations are a key component of a broad range of indicators that the ECB considers when determining the appropriate monetary policy stance for achieving its price stability objective. Inflation expectations can not only affect inflation itself through the wage and price‑setting processes, but also serve as a useful cross‑check on the ECB’s and the Eurosystem’s own projections.
This article focuses on market‑based measures of longer‑term inflation expectations, which are timely indicators derived from the prices of instruments that are traded in financial markets and linked to future inflation outcomes. It reviews recent developments in the information that can be extracted from different types of market‑based indicator, starting from the period leading up to the ECB’s announcement of its expanded asset purchase programme (APP).
The fall in market‑based indicators of longer‑term inflation expectations between 2014 and mid‑2016 was consistent across major jurisdictions, possibly reflecting global concerns about weak aggregate demand and associated disinflationary pressures. Their subsequent recovery has been driven by a partial dissipation of these concerns and, in particular, a significant improvement in the euro area macroeconomic environment. The lion’s share of the movement in longer‑term inflation expectations over the past few years has stemmed from the inflation risk component of these indicators, suggesting that the balance of risks to the inflation outlook has been one of the main drivers. Indeed, information extracted from the prices of inflation options implies that the risk‑neutral probability of deflation increased noticeably in late 2014 and early 2015, before declining more recently.
1 Introduction
Inflation expectations play a central role in the ECB’s monetary policy, as its primary and overriding objective is to maintain price stability in the euro area. In 1998 the ECB’s Governing Council defined price stability as a year‑on‑year increase in the Harmonised Index of Consumer Prices (HICP) for the euro area of below 2%. In 2003 it then clarified that in the pursuit of price stability it aims to maintain inflation rates at levels below, but close to, 2% over the medium term. In this context, private agents’ inflation expectations serve two main purposes in the conduct of monetary policy. First, inflation expectations are relevant in their own right in that they influence private agents’ economic decisions in areas such as consumption and investment, as well as wage and price setting, and thus euro area inflation. Similarly, financial market participants’ inflation expectations are relevant in the pricing of other financial instruments, such as nominal bonds, and can thus directly affect the transmission of monetary policy to the real economy. Second, they serve as a valuable cross‑check on the inflation outlook in the Eurosystem/ECB staff macroeconomic projections, which in turn inform the ECB’s monetary policy decisions.
The ECB therefore closely monitors private agents’ inflation expectations in the form of both survey‑based and market‑based measures. Survey‑based measures reflect future inflation expectations, as expressed directly in the context of regular expert surveys conducted on a monthly or quarterly basis. One such survey that plays a prominent role in the ECB’s monetary policymaking is its own Survey of Professional Forecasters (SPF), a quarterly survey of experts affiliated with financial and non‑financial institutions based in the European Union. By contrast, market‑based measures reflect the information derivable from the prices of financial instruments, such as inflation‑linked swaps (ILSs), inflation‑linked bonds or inflation options, which are linked to future inflation outcomes. Since such financial instruments are traded continuously, market‑based measures not only provide additional valuable information on the inflation expectations of informed investors, but can also give more timely indications of potential shifts in the inflation outlook. Furthermore, they embody not only the inflation expectation, but also a premium related to inflation uncertainty, which can vary over time. Despite these differences, both survey‑based and market‑based indicators of inflation expectations are part of a broad range of indicators that the ECB considers in its monetary policy decision‑making.
This article reviews recent developments in market‑based measures of euro area inflation expectations, in particular the shift in the balance of risks to the inflation outlook since 2014. Following on from an earlier review of market‑based indicators of euro area inflation that covered the impact of the global financial crisis,[1] the present article examines both the phase of weakening inflation dynamics in the run‑up to the ECB’s launch of the APP as a (further) non‑standard monetary policy measure and the evolution of market‑based measures of inflation expectations thereafter. Section 2 of the article explores the drivers of market‑based indicators of inflation expectations over the two aforementioned periods, also drawing on a model‑based analysis. Section 3 focuses on one of the main drivers, namely the shift in the balance of risks to the inflation outlook, which is inferred from information derived from option prices, and corroborated by information extracted from the ECB SPF. Box 1 sheds some light on the conclusions drawn in Section 3 by highlighting the important difference between risk‑neutral and “physical” probabilities.
2 Review of recent developments in market‑based measures of inflation expectations and their drivers
This section reviews recent developments in investors’ longer‑term inflation expectations by analysing the evolution of inflation‑linked swap (ILS) rates. An ILS is a derivative contract that involves an exchange of a payment defined in terms of a fixed rate on a notional amount (the “fixed leg” of the swap) for a payment defined in terms of the realised inflation rate over a predetermined horizon on that same notional amount. Only the net cash flows are exchanged at the maturity of the swap, i.e. the difference between the rate on the fixed leg and the realised inflation rate applied to the notional value of the contract.[2] Thus, the ILS rate on the contract is indicative of the market’s expected inflation rate over the relevant horizon. The swap contract is usually linked to a non‑seasonally adjusted consumer price index (CPI). In the euro area, the relevant index is the HICP excluding tobacco (HICPxT), while in the United States it is the Consumer Price Index for All Urban Consumers (CPI‑U) and in the United Kingdom it is the Retail Price Index (RPI).
ILS rates provide a cleaner measure of longer‑term inflation expectations than bond‑derived break‑even inflation rates (BEIRs). The latter is calculated as the spread between nominal and inflation‑linked bond yields, often of a particular euro area country. Currently, Germany, France, Italy and Spain all have inflation‑linked bonds which refer to the euro area HICPxT. In contrast to ILS rates, BEIRs can be influenced by significant time‑varying liquidity effects and country‑specific risk premia.[3] Therefore, market participants prefer to use market‑based measures of longer‑term inflation expectations derived from ILS rates rather than from BEIRs.
However, ILS rates still contain risk premia as compensation for inflation risk exposure. As with all indicators derived from financial market prices, ILS rates are not immune to the influence of risk premia. In particular, ILS rates contain an inflation risk premium which compensates investors for the risks surrounding their central estimates of inflation over the forecast horizon. The inflation risk premium also has informational content – it is not just a correction that needs to be applied in order to reveal central expectations, it also tells us which inflation outcomes investors care about most. Although the inflation risk premium is unobservable, it can be estimated either by modelling the inflation swap curve with an affine term structure model or by using a non‑model‑based proxy, such as the differential between market‑based and survey‑based inflation expectations. Both approaches imply that the lion’s share of the movement in ILS rates over the past few years has been due to fluctuations in inflation risk premia.
During the period from 2014 to mid‑2016, ILS rates fell significantly across major jurisdictions (see Chart 1). A widely used measure of longer‑term market‑based inflation expectations is the “5y5y ILS rate”, i.e. the average inflation rate over a five‑year period starting in five years’ time, as implied by ILS rates. We examine two distinct periods in 5y5y ILS rate developments. First we look at the period from 2014 to mid‑2016 when 5y5y ILS rates fell considerably across major jurisdictions. In the euro area, the 5y5y ILS rate fell by almost 1 percentage point, down from around 2.20% to 1.20%, while in the United States and the United Kingdom it went down by 1.10 percentage points (to 1.85%) and 0.70 percentage point (to 2.90%) respectively. We then look at the period since mid‑2016, during which ILS rates have recovered somewhat. Indeed, in the euro area, the 5y5y ILS rate stood at 1.75% in early July 2018, around 50 basis points higher than its trough in 2016.
Chart 1
5y5y ILS rates
(percentages per annum)

Sources: Bloomberg and ECB calculations.
Notes: The chart shows ILSs that reference the Harmonised Index of Consumer Prices excluding tobacco (HICPxT) for the euro area, the Consumer Price Index for All Urban Consumers (CPI‑U) for the United States and the Retail Price Index (RPI) for the United Kingdom. The latest observation is for 31 July 2018.
Consistent with these observations, econometric analysis suggests that global factors have increasingly influenced the euro area 5y5y ILS rate. Chart 1 shows considerable co‑movement in the time series of 5y5y ILS rates in the United Kingdom, United States and euro area. To ascertain the significance of this relationship and the extent to which it has evolved over time, we have conducted a forecast error variance decomposition of various ILS rates and other financial variables.[4] We use this vector autoregressive (VAR) model to construct two sets of spillover indices: a) overall spillovers within the VAR model and b) spillovers to longer‑term inflation expectations in each jurisdiction. For the latter, the spillover index for the euro area measures how much of the two‑week‑ahead forecast error variance of the 5y5y ILS rate is explained by the other variables in the VAR model.
Spillovers to longer‑term inflation expectations rose substantially in 2015, possibly reflecting global concerns about weak aggregate demand and associated disinflationary pressures (see Chart 2). The error variance decomposition implies a high degree of spillovers between the 5y5y ILS rates of all three economic areas. In addition, the emergence of a positive wedge between spillovers to 5y5y ILS rates and total spillovers (see the green line in Chart 2) suggests that spillovers to longer‑term inflation expectations were unusually high from 2015 relative to the other variables in the VAR model. While spillovers from oil prices to 5y5y ILS rates also increased over that period, they were not the main driving factor behind the overall increase in connectedness between 5y5y ILS rates and other variables in the VAR model. Instead, overriding concerns regarding weak global aggregate demand and associated disinflationary pressures are more likely to have been the cause.
Chart 2
Spillovers between longer‑term inflation expectations and other financial variables
(as a percentage of error variance)

Sources: Thomson Reuters and ECB calculations.
Notes: Each jurisdiction‑specific index represents the contribution of shocks from all other variables in the VAR model to the error variance in the 5y5y ILS rate in each jurisdiction. Total spillovers can be interpreted as the average contribution of shocks from all other variables in the VAR model to the error variance of each variable in the VAR model. Contributions are calculated from the forecast error variance matrix inferred from the generalised identification of shocks. The latest observation is for 31 July 2018.
The inflation risk premium entered into negative territory towards the end of 2015, as deflation rather than excessive inflation became the key concern and investor appetite for inflation‑linked instruments fell (see Chart 3). To further explore the drivers of the decline in ILS rates, we model the euro area 5y5y inflation risk premium using an affine term structure model.[5] The resulting decomposition of the 5y5y ILS rate into expectations and the inflation risk premium suggests that most of the fall over the period from 2014 to 2016 stemmed from the inflation risk premium component. In late 2015 the inflation risk premium even turned negative, indicating that adverse economic outcomes were associated with the spectre of deflation and, moreover, that investors did not feel the need to protect themselves against inflationary scenarios. Indeed, actual inflation outcomes were persistently below the survey forecasts of most economists during that period. If investors in inflation‑linked products also found themselves being continually surprised on the downside, and thus paying more for these products than anticipated, this may also have contributed to the lack of appetite for inflation‑linked instruments. In turn, this may have led to a downward repricing of inflation risks and a corresponding decline in the perceived value of inflation protection, i.e. the risk premium.[6]
Chart 3
Euro area 5y5y ILS rate, adjusted for inflation risk premia
(percentages per annum)

Sources: ECB and Thomson Reuters.
Note: The decomposition is based on an affine term structure model and fitted to the euro area zero‑coupon ILS curve. The estimation method follows Joslin, S., Singleton, K. and Zhu, H. (2011). For details see Camba‑Méndez, G. and T. Werner, ECB Working Paper 2033 (2017). The latest observation is for July 2018.
The inflation risk premium fell around the same time as the balance of risks to the inflation outlook shifted downwards, as implied by surveys (see Chart 4). The forecasts in the ECB SPF are for inflation in five years’ time. Therefore, for ease of comparison, we take a shorter horizon estimate of the inflation risk premium, namely the one‑year ILS rate in four years’ time (1y4y). The inflation risk premium fell in tandem with the balance of risks to the inflation outlook, as reflected in the skewness measure derived from the survey data.[7] These developments may have been driven by concerns about weak aggregate demand and associated disinflationary pressures. As Section 3 will discuss, they also coincided with a rise in the probability of deflation, as reflected in the prices of inflation options.
Chart 4
Inflation risk premium and survey‑derived balance of risks
(left‑hand scale: percentages per annum; right‑hand scale: number of standard deviations from zero)

Sources: ECB calculations and Thomson Reuters.
Notes: The inflation risk premium is based on the decomposition of an affine term structure model and fitted to the euro area zero‑coupon ILS curve. The estimation method follows Joslin, S., Singleton, K. and Zhu, H. (2011). The skewness measure includes the following measures: skewness, quantile skewness, mean‑median and mean‑point forecast of continuous distributions derived from linear and cubic spline interpolation. The individual series comprising the skewness measure have been standardised by their standard deviation (since 2001) for ease of comparison. A negative (positive) sign means the balance of risks is perceived as being to the downside (upside). The latest observation is for July 2018.
Since mid‑2016 measures of longer‑term inflation expectations have trended upwards. The euro area 5y5y ILS rate reached a trough in June 2016 (at around 1.20%), shortly after the United Kingdom’s referendum on European Union membership and the turbulent market conditions which ensued. Since then, measures of longer‑term inflation expectations have trended upwards in the euro area, United States and United Kingdom. Looking again at the term structure model decomposition of euro area 5y5y ILS rates shown in Chart 3, it is evident that throughout this recovery there has been a measurable increase in the inflation risk premium component, albeit from historically low and negative levels. This increase is likely to have reflected a dissipation of perceived downside risks to the inflation outlook amid a broad‑based improvement in global economic prospects and an accommodative monetary policy stance. The recovery in inflation across all three jurisdictions suggests that common factors, such as the global economic cycle, have had a strong influence on longer‑term inflation expectations. The analysis of spillovers to ILS rates in Chart 2 indicates that, while spillovers have moderated somewhat, ILS rates remain highly connected across jurisdictions.
Model‑based analysis corroborates the notion that the recovery of ILS rates has reflected a dissipation of perceived downside risks to the inflation outlook amid a broad‑based improvement in global and euro area economic prospects (see Chart 5). To shed further light on the recent recovery in market‑based measures of inflation expectations, particularly with a view to understanding the driving forces behind it and more formally disentangling their impact, we have employed a model‑based decomposition. The decomposition is based on a four‑jurisdiction (United States, United Kingdom, China and the euro area) Bayesian VAR model at monthly frequency, which gauges contributions to fluctuations in variables using a historical shock decomposition. Besides the euro area 5y5y ILS rate, the set of variables includes real and financial variables, uncertainty indicators and commodity prices. It has been selected on the basis of economic rationale and relevance, as suggested by existing studies and market reports. The decomposition of the cumulative increase in the euro area 5y5y ILS rate since June 2016 (when the 5y5y ILS rate hit a trough) suggests that it was due primarily to a combination of euro area and international factors. This would be consistent with the dissipation of perceived downside risks to the inflation outlook amid a broad‑based improvement in global economic prospects. Since then the euro area 5y5y ILS rate has gained further momentum owing to improvements in the euro area growth outlook. Commodity prices have played a limited role over the entire time horizon, but over the course of 2018 they have had a positive impact on the euro area 5y5y ILS rate.
Chart 5
Macroeconomic drivers of euro area 5y5y ILS rates
(percentage points; difference to June 2016)

Sources: Bloomberg, Thomson Reuters and ECB calculations.
Notes: The chart shows a historical shock decomposition from a large Bayesian VAR model, with estimates starting in 2005 at a monthly frequency. Endogenous variables include: US Purchasing Managers’ Index (PMI), euro area (EA) PMI, UK PMI, US Producer Price Index (PPI), Chinese PPI, EA PPI, EA unemployment, EA Consumer Price Index (core), oil prices, metals prices (in EUR), S&P500, EuroStoxx, EA two‑year risk‑free rate, EA ten‑year risk‑free rate, VIX, Italian‑German ten‑year sovereign yield spread, EUR NEER‑38, EA 5y5y ILS rate. Exogenous variables include: outstanding amount of EA sovereign inflation‑linked bonds. Shocks are identified using a Cholesky ordering. The chart includes cumulative changes since June 2016. The latest observation is for June 2018.
3 The distribution of market‑based inflation expectations
Analysing the prices of euro area inflation options provides timely insights into the distribution of market participants’ inflation expectations over and above the central tendency reflected in swap rates. Inflation options differ from ILSs in that they are instruments with “non‑linear” pay‑offs. In the case of euro area inflation options, this means that either (i) they pay out if inflation as measured by the euro area HICPxT exceeds a certain threshold, and zero otherwise (inflation caps) or (ii) they pay out if inflation falls short of a certain threshold, and zero otherwise (inflation floors). Inflation options thus effectively offer insurance against a certain inflation event and, all else equal, investors’ willingness to pay for such insurance will depend on the probability of the given event. By comparing the prices of options that insure against different outcomes, it is possible to infer the probability that investors assign to those different outcomes – in other words, the probability distribution of market participants’ inflation expectations.
Developments in option‑implied probabilities for a range of inflation events show that the distribution of inflation expectations has changed considerably in recent years (see Chart 6). The chart tracks the so‑called risk‑neutral probability of various relevant inflation outcomes, as implied by “zero‑coupon” options whose pay‑offs depend on average euro area inflation over a five‑year period (see Box 1 for a discussion of the appropriate interpretation of risk‑neutral probabilities).[8] As such, the probabilities essentially reflect spot inflation expectations over the next five years starting today and hence cannot be compared one for one with, for example, the aforementioned 5y5y ILS rate, which is a five‑year forward rate starting in five years. The evolution of the implied distribution is nonetheless useful as five years is a sufficiently long period to cover not only market participants’ expectations regarding near‑term developments of euro area inflation, but crucially also the medium‑term inflation outlook.
Chart 6
Option‑implied risk‑neutral distribution of euro area average inflation over the next five years
(percentages)

Sources: Bloomberg, Thomson Reuters and ECB calculations.
Notes: Probabilities implied by five‑year zero‑coupon inflation options, smoothed over five business days. Risk‑neutral probabilities may differ significantly from physical, or true, probabilities. The latest observation is for 31 July 2018.
In particular, the option‑implied distributions shifted towards concerns about deflation in late 2014 and early 2015, which then steadily receded following the introduction of the APP. Chart 6 shows that the risk‑neutral probability of deflation had started to increase noticeably towards the end of 2014, before peaking significantly above previously recorded levels in January 2015 when the APP was announced. At that point in time, the balance of probabilities around investors’ inflation outlook for the euro area was heavily tilted towards deflationary and low, but positive, outcomes (i.e., between 0% and 1.5%) – a clear shift from three years earlier when the option‑implied distribution revealed market participants were assigning a far greater probability to high inflation outcomes (i.e., above 2.5%). Following the announcement of the APP, the risk of deflation as implied by euro area inflation option prices declined markedly, albeit remaining somewhat elevated for some time thereafter. However, as the APP continued and the general inflation outlook improved, the spectre of deflation in the euro area gradually vanished and is now seen as negligible by market participants.
The information contained in the prices of euro area inflation options also suggests that investors have started to price in gradually decreasing levels of inflation uncertainty. This trend is not only evident from Chart 6, which illustrates that the aforementioned steady decline in the option‑implied risk of deflation has not been accompanied by a concomitant increase in the likelihood of high inflation outcomes, and that the option‑implied probability currently assigned to high inflation and deflation outcomes combined is noticeably below the level prevailing towards the beginning of the period under review. It is also evident from Chart 7, which shows the evolution of inflation uncertainty as measured by the option‑implied volatility – a gauge of the spread of the distribution (see the blue line) – next to developments in the five‑year swap rate – a gauge of the central tendency of the distribution (see the yellow line).[9] Clearly, the downward trend in option‑implied volatilities throughout the period from 2012 to 2014 that went hand in hand with declines in the swap rate was subsequently not reversed. In fact, despite the noticeable recovery in the swap rate since the second half of 2016, implied volatilities have remained at very low levels and, if anything, declined even further. This suggests that investors’ uncertainty regarding euro area inflation and the risk premia they are demanding continue to be relatively low, also given the substantial improvement in the inflation outlook (see also Chart 3).
Chart 7
Inflation uncertainty as implied by euro area inflation options
(left‑hand scale: basis points; right‑hand scale: percentages)

Sources: Bloomberg, Thomson Reuters and ECB calculations.
Notes: “Implied volatility” refers to the average of implied volatilities across five‑year zero‑coupon inflation options with different strike rates (both “cap” and “floor” options). “Swap rate” refers to five‑year euro area HICPxT‑linked swaps. The latest observation is for 31 July 2018.
Box 1 Interpreting option‑implied probabilities
It is important to stress that option‑implied “risk‑neutral” probabilities, while containing valuable information, must not be interpreted as being identical to the underlying “physical” probabilities of inflation events. Practically speaking, this means that an option‑implied probability of, for example, 25% for deflation does not imply that investors believe there is a one‑in‑four chance that deflation will actually emerge. This is somewhat counterintuitive, but as this box explains, it is due to the presence of risk premia in financial markets.
Option‑implied “risk‑neutral” probabilities are obtained under standard no‑arbitrage considerations without making assumptions about investors’ risk preferences. The option‑implied distributions of euro area inflation expectations presented in this article build on, among other things, the well‑known Black‑Scholes option pricing model. That model postulates that investors cannot earn a risk‑free profit by buying (or selling) an option and simultaneously selling (or buying) a portfolio of other assets that exactly replicates the future pay‑off from the option. This notion of “no arbitrage” is central to asset pricing theory and gives rise to probabilities under a risk‑neutral probability measure, typically denoted by . More formally, and to put it simply, the price of an inflation‑linked asset today ( ) depends on the risk‑neutral probabilities and expected one‑period‑ahead pay‑offs associated with different inflation events , as well as the risk‑free rate :
(1)
The price of the asset under the no‑arbitrage condition is thus a probability‑weighted sum of expected future pay‑offs discounted at the risk‑free rate. Letting equal the current market price, it is possible to determine the risk‑neutral probabilities based on the expected pay‑offs and the known risk‑free rate .
However, as real‑world investors tend to be risk‑averse, the extracted risk‑neutral probabilities reflect risk preferences as much as they reflect the underlying physical probabilities of different outcomes. Risk‑averse investors are willing to pay a premium to insure against the disutility associated with particularly adverse outcomes. For instance, in the context of inflation, this can mean that investors value more highly the pay‑offs from options that pay out in the case of tail events such as deflation or (very) high inflation than those that pay out in the case of low, but positive, inflation. The actual price of inflation options therefore reflects the discounted sum of the values that investors assign to future pay‑offs in different states of the world , with those states weighted by the actual, or physical, probabilities under the measure.
As a result, risk‑neutral probabilities tend to overstate the corresponding physical probabilities for tail events and vice versa for non‑tail events. To see this, note that extracting based on equation (1) is conditional on the expected future pay‑offs across inflation events , rather than on how much value investors actually assign to them. Hence, will generally represent a relative underestimation of these values in the case of tail events and a relative overestimation in the case of non‑tail events. Clearly, for a given market price , this needs to be compensated by extracted risk‑neutral probabilities that are higher than the true, physical probabilities in the case of tail events, but lower in the case of non‑tail events.
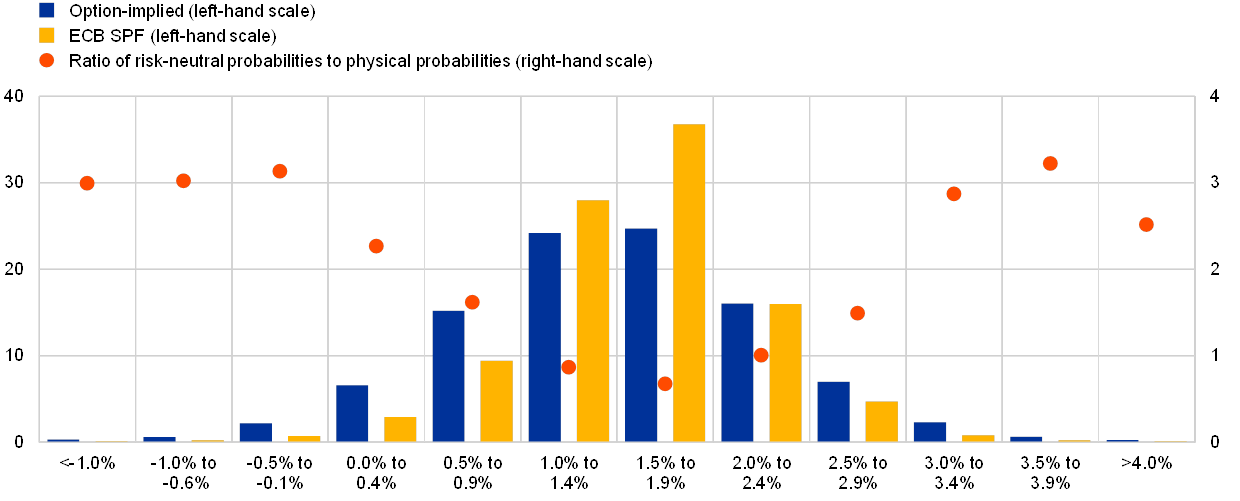
The impact of risk premia on the level of option‑implied risk‑neutral probabilities for euro area inflation can also be illustrated by comparing them with the results reported in the ECB Survey of Professional Forecasters (SPF). The SPF lends itself to this purpose as it asks survey participants not only for their expectations regarding euro area inflation over different time horizons, but also for the probabilities they assign to different outcomes across the entire inflation spectrum for those same horizons. These probabilities can be interpreted as true, physical probabilities that are unaffected by risk premia and therefore provide a natural reference point for assessing the degree to which market participants price risk premia into inflation options.
Chart A
Option‑implied risk‑neutral probabilities versus physical probabilities from the ECB SPF
(left‑hand scale: percentages; right‑hand scale: ratios)
Sources: Bloomberg, Thomson Reuters and ECB calculations.
Notes: “Option‑implied” refers to the risk‑neutral probability of a given inflation outcome, as extracted from the prices of one‑year zero‑coupon options based on the (three‑month lagged) euro area Harmonised Index of Consumer Prices excluding tobacco (HICPxT) inflation. “ECB SPF” refers to the physical probability for euro area HICP inflation over the next year, as implied by the responses of professional forecasters surveyed by the ECB (based on the results for the first quarter of 2018). For ease of comparison, risk‑neutral probabilities are evaluated at the date of the deadline for SPF participants to respond (11 January 2018). The “Ratio of risk‑neutral probabilities to physical probabilities” is calculated by dividing the option‑implied probabilities by the SPF‑implied probabilities.
Chart A shows that the option‑implied probabilities indeed tend to be larger than the survey‑implied physical probabilities in the tails of the distribution, which is consistent with the notion that investors require risk premia for the associated inflation events. The chart compares the results for one‑year‑ahead euro area inflation, which is the horizon that allows for the closest matching given the availability of euro area inflation options and the horizons considered in the SPF. The option‑implied probabilities (see the blue bars) clearly exceed the survey‑implied probabilities (see the yellow bars) for those scenarios in which inflation is either negative or above 3%. In each case, risk‑neutral probabilities are roughly three times higher than the physical probabilities (see the red markers). By contrast, physical probabilities tend to be higher than their risk‑neutral counterparts for the low, but positive, inflation outcomes in between the aforementioned tail events. These observations are consistent with risk‑averse investors valuing the pay‑off from inflation options more highly in deflation and high inflation regimes, resulting in a larger wedge between the associated risk‑neutral and physical probabilities.[10]
Although option‑implied probabilities need to be interpreted bearing in mind the above considerations, tracking their evolution over time does convey important information on changes in investors’ assessment of the euro area inflation outlook. The reason is that changes in risk‑neutral probabilities and their physical counterparts will broadly be in line with each other, unless there is a negative correlation between the true, physical probabilities and risk premia. However, this latter scenario would mean that, in the case of deflation for example, an investor would need to systematically revise downwards the risk premium for deflation whenever the odds of this event materialising are seen as increasing. This seems quite implausible – in fact, physical probabilities and risk premia would generally be expected to move together over time (to varying degrees). Tracking the evolution of option‑implied probabilities therefore provides useful and timely signals regarding shifts in investors’ underlying inflation outlook.
4 Conclusions
Market‑based indicators of euro area inflation expectations have recently recovered on the back of a significant improvement in the domestic macroeconomic outlook, following a marked decline between 2014 and mid‑2016. The review of developments in longer‑term market‑based indicators of inflation expectations in this article suggests that this decline correlated with similar trends in other major jurisdictions. Further analysis indicates that, in addition to domestic factors, global concerns about sluggish aggregate demand and related disinflationary pressures played their part in the fall in market‑based measures of euro area inflation expectations. The subsequent recovery appears to have been driven by a partial dissipation of these concerns and, in particular, a substantial improvement in the macroeconomic picture for the euro area, notably also as a reflection of the ECB’s accommodative monetary policy.
The recent developments in longer‑term market‑based indicators have been due primarily to the inflation risk premium, which changed in line with the shifts in the balance of risks to the inflation outlook. A decomposition of the movements in market‑based indicators shows that both the pure expectations component and the inflation risk premium component contributed to the initial decline and subsequent recovery. However, most of the fall between 2014 and mid‑2016 is estimated to have stemmed from the risk premium component, which fell around the same time as the downward shift in the balance of risks implied by the skewness of the probability distributions reported in the SPF. Taken together, these two factors indicate that investors felt little need to hedge against inflationary scenarios at the trough of mid‑2016, but were instead concerned about deflationary outcomes.
Market‑based indicators also suggest that the spectre of deflation in the euro area has steadily receded following the ECB’s launch of the APP and is now regarded as negligible by investors. This article has used the prices of inflation options that insure against different inflation outcomes to extract market‑implied probability distributions for the euro area inflation outlook. The implied probability of deflation peaked markedly above previously recorded levels in January 2015, when the ECB announced its APP. At that time, the balance of probabilities around investors’ inflation outlook was tilted heavily towards deflationary and low, but positive, inflation outcomes. However, as the APP continued and the general economic and inflation outlook in the euro area improved, the spectre of deflation in the euro area gradually vanished.
- See the article entitled “Inflation expectations in the euro area: a review of recent developments”, Monthly Bulletin, ECB, February 2011.
- For example, if counterparty A wishes to hedge against unexpectedly high inflation over the next year, it may enter into a one‑year ILS contract with counterparty B for a notional amount of, for illustrative purposes, €1 million and pay a fixed leg of 1.90% to counterparty B. If at the end of the contract, realised inflation were to stand at 2.50%, counterparty A would receive a net payment of €6,000 = [€1 million * (2.50%-1.90%)] from counterparty B (who owes realised inflation to counterparty A). To hedge against lower than expected inflation, counterparty A can enter into the other side of this contract (that counterparty B undertakes in this example). In any case, the net pay‑off to either counterparty is a linear function of the level of realised inflation. Note that this example is highly simplified and does not account for some technicalities, such as indexation lags, that are present in ILS contracts.
- For example, during the euro area sovereign debt crisis there were distortions in the market prices for the sovereign debt of some euro area countries. In particular, concerns regarding Italy’s sovereign credit risk were reflected in an increase in bond yields, which was more pronounced in inflation‑linked bonds, thus depressing the implied BEIR. More recently, during periods of financial market risk aversion, safe haven flows into nominal German bonds have tended to depress the implied BEIR on German debt.
- The decomposition is conducted according to the methodology put forward in Diebold, F.X. and Yilmaz, K., “Measuring financial asset return and volatility spillovers, with application to global equity markets”, Economic Journal, Royal Economic Society, Vol. 119, No 534, pp. 158‑171, January 2009. The analysis is based on a VAR model containing a multitude of financial indicators for the euro area, United States and United Kingdom. The VAR model is estimated in levels with five lags, using daily data and a two‑year rolling window. The error variance decomposition is a statistical exercise, which means that causality is difficult to ascertain.
- The decomposition is based on an affine term structure model and fitted to the euro area zero‑coupon ILS curve. The estimation method follows that described in Joslin, S., Singleton, K. and Zhu, H., “A new perspective on Gaussian dynamic term structure models”, Review of Financial Studies, Vol. 24, No 3, pp. 926‑970, 2011. For further details, see Camba‑Mendez, G. and Werner, T., “The inflation risk premium in the post‑Lehman period”, Working Paper Series, No 2033, ECB, March 2017.
- In fact, Section 3 shows that the value of deflation protection increased noticeably in late 2014 and early 2015, before declining more recently.
- See the box entitled “How do professional forecasters assess the risks to inflation?”, Economic Bulletin, Issue 5, ECB, 2017.
- The extraction of risk‑neutral probabilities is based on Breeden, D. and Litzenberger, R., “Prices of State‑Contingent Claims Implicit in Option Prices”, Journal of Business, Vol. 51, No 4, pp. 621‑651, 1978. Option prices are translated into implied volatilities using the Black‑Scholes formula, and implied volatilities are interpolated following Shimko, D., “Bounds of Probability”, RISK, No 6, pp. 33‑37, 1993.
- Implied volatility is an important concept in option pricing. It denotes the level of volatility in the option’s underlying asset over the life of the option contract that, given an option pricing model, is consistent with the current market price of the option. Intuitively, higher prices for options that insure against a certain event are associated with higher probabilities of that event occurring in the future. In turn, all else equal, higher probabilities require higher levels of future volatility in the underlying. Implied volatilities can therefore be extracted from prices based on a given option pricing model. For example, if investors become more uncertain about the inflation outlook, i.e. they assume a higher volatility going forward, the prices of inflation options will increase. It is important to note the forward‑looking and subjective nature of implied volatility, which sets it apart from the concept of historical, or realised, volatility.
- It is important to note that probabilities reported in surveys rely on subjective distributions. However, there is evidence that experts tend to be overly confident in the accuracy of their assessment of the future – in other words, they may assign too small a probability to tail events. Some of the wedge between the survey‑implied probabilities for tail events and their option‑implied risk‑neutral counterparts may therefore also be attributable to this “overconfidence effect”.