
The ECB Survey of Professional Forecasters - Third quarter of 2021
Summary
In the ECB Survey of Professional Forecasters (SPF) for the third quarter of 2021, HICP inflation expectations were revised up, standing at 1.9%, 1.5% and 1.5% for 2021, 2022 and 2023 respectively.[1] Compared with the previous round (second quarter of 2021), these were 0.3 and 0.2 percentage points higher for 2021 and 2022 respectively. Longer-term inflation expectations were revised upward to 1.8% for 2026 from 1.7% for 2025 in the previous round. Regarding GDP growth, SPF respondents revised up their expectations for 2021-23. Unemployment expectations have been revised down for all horizons. Indicators of the uncertainty surrounding expectations for the main macroeconomic variables mostly eased somewhat further but still remained relatively elevated by historical standards.
Table 1
Results of the SPF in comparison with other expectations and projections
(annual percentage changes, unless otherwise indicated)
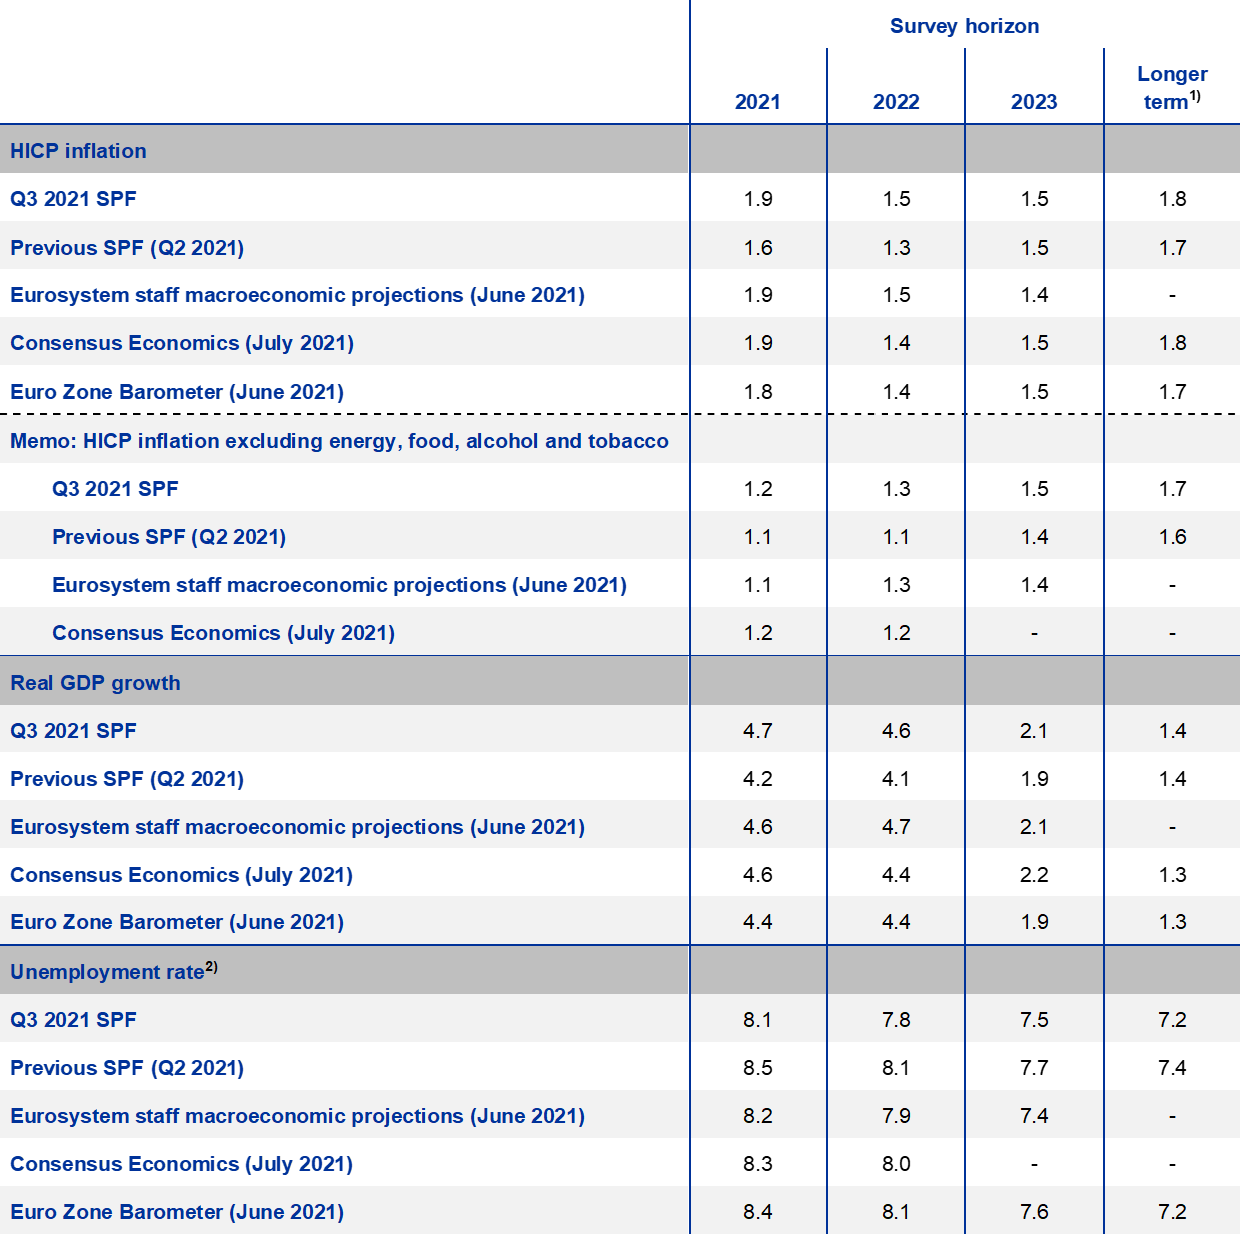
1) Longer-term expectations refer to 2026 (in the SPF round of the second quarter of 2021 and in the Eurozone Barometer they refer to 2025). Eurozone Barometer data for 2023 and longer-term expectations are from April 2021 surveys.
2) As a percentage of the labour force.
1 HICP inflation expectations revised up
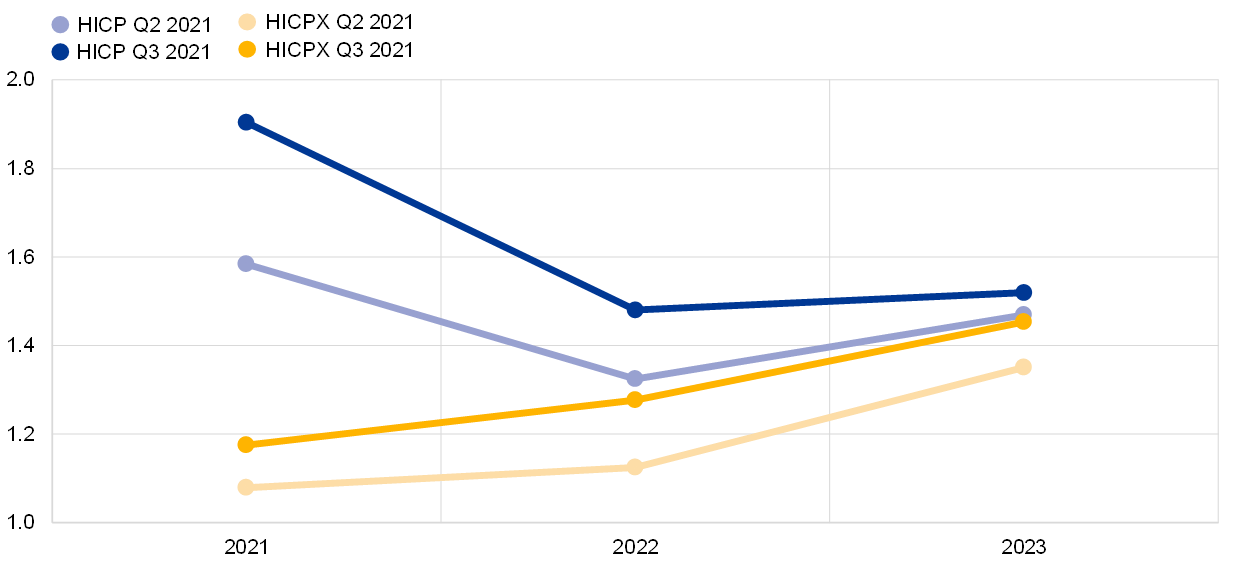
SPF respondents revised up their inflation expectations for across all horizons. Average inflation expectations for 2021, 2022 and 2023 were 1.9%, 1.5% and 1.5% respectively in the ECB SPF survey for the third quarter of 2021 (see Chart 1). For 2021 and 2002 these were revised upward by 0.3 and 0.2 percentage points respectively compared to the previous survey round for the second quarter of 2021. Respondents reported that the expected further improvement in economic activity as well as somewhat higher assumptions for oil prices were the main factors behind the upward revisions. Compared with those in the June 2021 Eurosystem staff macroeconomic projections, inflation expectations were the same for 2021 and 2022 and slightly higher, by 0.1 percentage point, for 2023 (see Table 1).
Chart 1
Inflation expectations: overall HICP inflation and HICP inflation excluding energy, food, alcohol and tobacco
(annual percentage changes)
Respondents once again confirmed that they considered some of the factors behind the expected increase in inflation in 2021 to be temporary. These factors included the “normalisation” of the VAT rate in Germany and the strong rebound in oil prices from the low levels observed during much of 2020. Some respondents noted that there could be higher than usual volatility in inflation over the coming months, reflecting both technical (changes in HICP weights and COVID-19-related changes in the use of imputed prices) and economic factors (relative price shifts as consumption switches back to some services sectors heavily hit by the pandemic, such as restaurants, hotels and travel).
In response to a special question on “unusual price pressures”, respondents generally reported that while these were likely to affect inflation, any impact would be relatively limited and temporary in nature.[2] Participants noted that supply chain issues and bottlenecks in certain areas (e.g. semiconductor chips in the automotive industry and international logistics costs) as well as higher commodity and raw material costs were likely to have an impact on inflation in the near term. However, they considered that this would be relatively limited in terms of magnitude, scope (specific sectors) and duration. They suggested that following the pandemic, firms in many instances had relatively limited pricing power and that workers’ wage bargaining power was also relatively limited.
Regarding the broader factors influencing the inflation outlook, respondents on average believed that underlying inflation pressure would gradually rise in line with the recovery in economic activity. They also cited fiscal and monetary policy as supporting factors. However, they generally considered that the rise in inflation pressure would be gradual, reflecting what they estimated to be the considerable economic slack remaining. Respondents expected wage growth to remain relatively moderate even if increasing slightly from 2021 to 2023. See the Section entitled “Expectations for other variables” for more detailed information on assumptions regarding oil prices, the USD/EUR exchange rate, ECB policy rates and wage growth.
SPF expectations for inflation excluding energy, food, alcohol and tobacco (HICPX) were also revised up for all horizons and continued to be for a steady but gradual upward movement (see Chart 1). HICPX expectations for 2021, 2022 and 2023 stood at 1.2%, 1.3% and 1.5%, representing upward revisions of 0.1, 0.2 and 0.1 percentage points respectively. HICPX inflation expectations remain approximately 0.1-0.2 percentage points lower than those for HICP at medium-term horizons. Respondents’ explanations suggest that the main factor behind the upward profile for underlying inflation is the expected economic recovery and subsequent gradual reduction of the amount of slack in the economy. The SPF forecasts for HICPX in 2021 and 2023 were slightly higher (by 0.1 percentage point) than those from the June 2021 Eurosystem staff macroeconomic projections but the same for 2022.
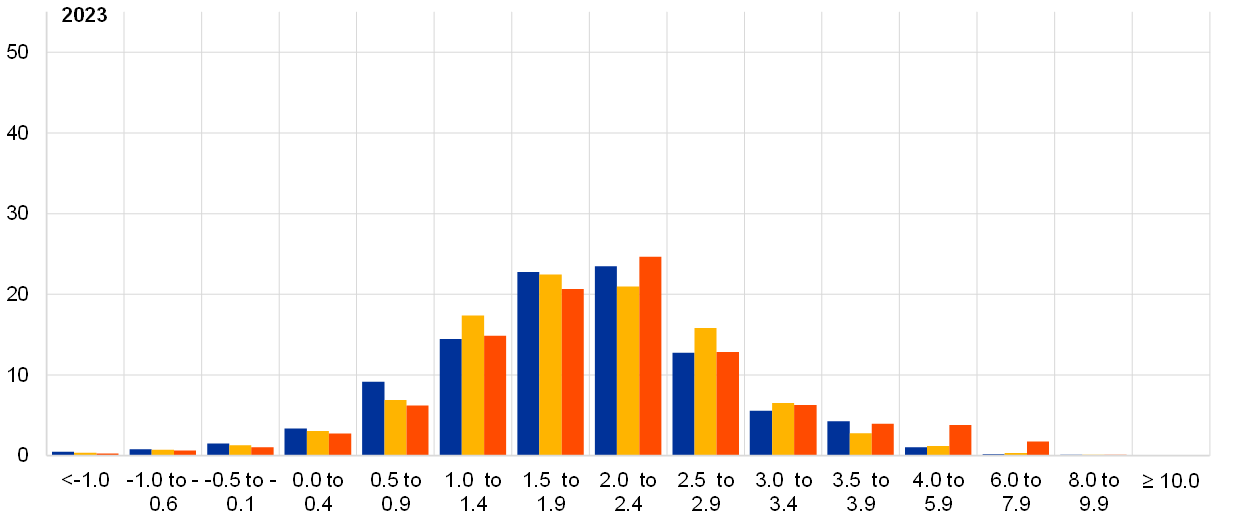
For the shorter- and medium-term horizons, quantitative indicators of uncertainty in the inflation outlook eased back somewhat further and risks were assessed to be close to balanced on average. In their qualitative remarks, respondents reported that a key source of uncertainty remained the evolution and impact of the pandemic, but respondents now also mentioned the possibility that supply bottlenecks and shortages may persist for longer than expected. Respondents noted both upside and downside risks associated with the pandemic. Downside risk components included the spread of the Delta variant, the chance of renewed lockdowns and reduced travel. On the upside, the release of pent-up savings and the resumption of strong consumption in sectors hardest hit by the pandemic were mentioned as a possible trigger for higher inflation in affected sectors. Costs associated with re-opening and the possibility that firms might attempt to rebuild margins were also mentioned as upside risks. On supply bottlenecks and shortages, whilst the baseline assumption of most respondents was that they would have a limited impact and be relatively temporary, some flagged the risks that they could persist for longer and have a greater-than-expected impact on prices and wages. Quantitative indicators of uncertainty for inflation derived from the reported probability distributions eased somewhat further. The width of the reported probability distributions indicates the perceived degree of uncertainty, whereas the asymmetry of the distributions indicates whether that uncertainty is more concentrated on higher or lower outturns, i.e. it measures the perceived balance of risks. The aggregate probability distributions for the calendar years 2021-23 are presented in Chart 2. For 2021, the modal bin range (i.e. the one with the largest associated probability) remained 1.5-1.9%, although the probability mass shifted clearly towards higher outcomes. For 2022 and 2023, the modal bin ranges have shifted up and are now also 1.5-1.9%.
Chart 2
Aggregate probability distributions for expected inflation in 2021, 2022 and 2023
(x-axis: HICP inflation expectations, annual percentage changes; y-axis: probability, percentages)
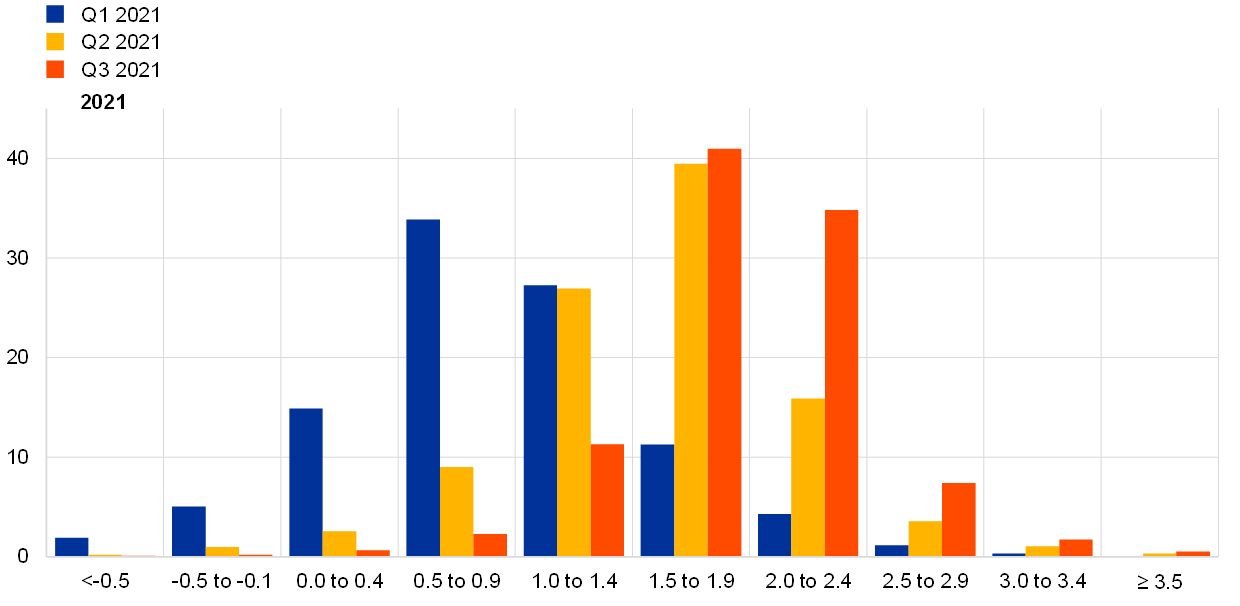
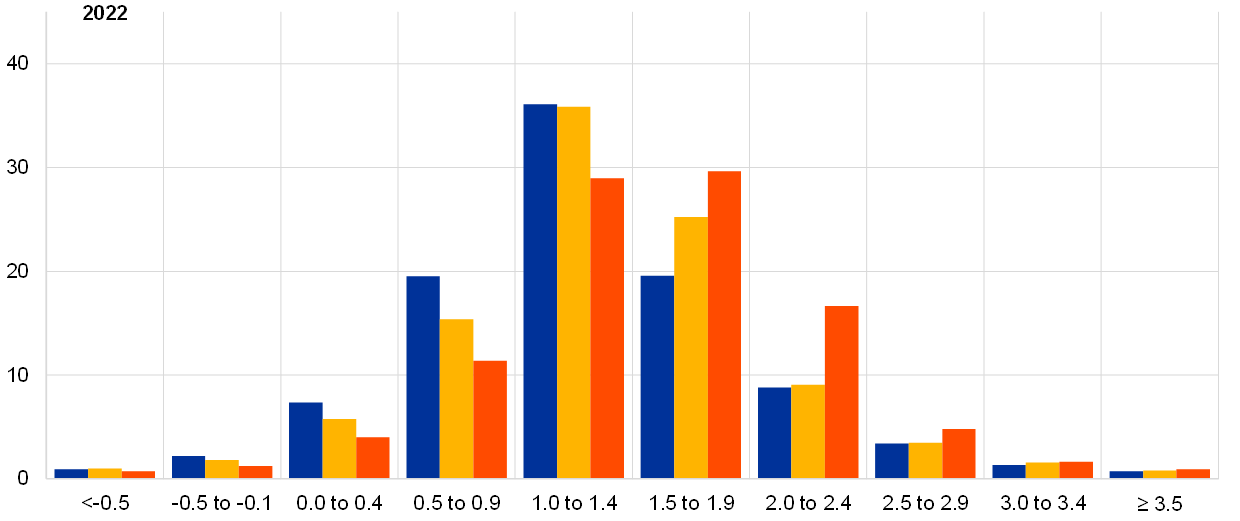
Notes: The SPF asks respondents to report their point forecasts and to separately assign probabilities to different ranges of outcomes. This chart shows the average probabilities they assigned to different ranges of inflation outcomes in 2021, 2022 and 2023.
2 Longer-term inflation expectations increased to 1.8%
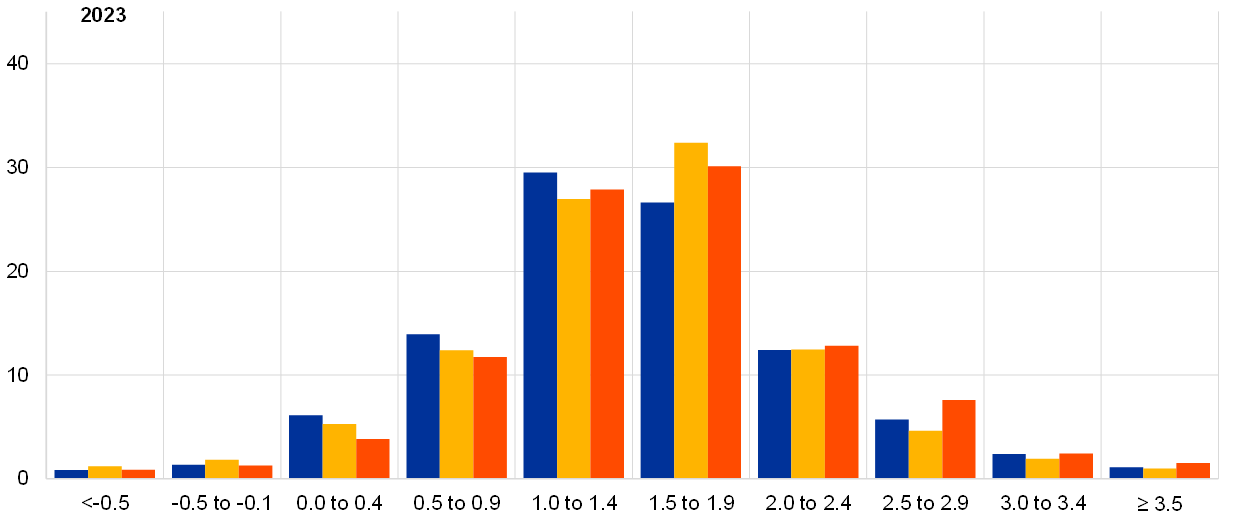
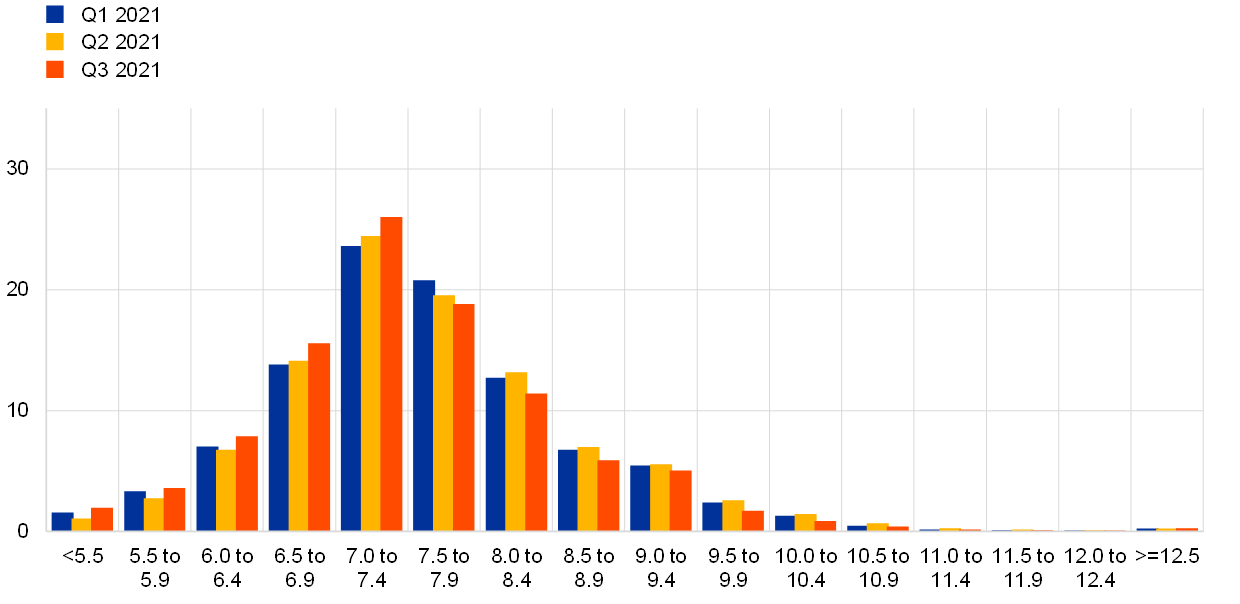
Longer-term inflation expectations averaged 1.8% for 2026, an upward revision from 1.7% for 2025 in the previous round. Having remained in the narrow range (1.64-1.69%) in the SPF rounds since the fourth quarter of 2019, longer-term inflation expectations were revised significantly this round. While part of the upward revision was owing to two outliers, the upward revision excluding them was still relatively strong. Considering a balanced panel between the two rounds, many more respondents revised their longer-term inflation expectations upward than downward, although the bulk kept them unchanged.[3] Other summary statistics, such as the median point forecast and the estimated mean of the aggregate probability distribution, also moved up notably (see Chart 3). The distribution of individual point forecasts changed somewhat when compared with recent rounds. There was no clear modal response with relatively similar fractions reporting 1.4% to 1.9% (see Chart 4). There was also a striking increase in the share (26% from 11% in the previous round) reporting 2.0% or above.
The longer-term expectations for HICP inflation excluding energy, food, alcohol and tobacco (HICPX) were also revised upward significantly. They increased to 1.7% for 2026 from 1.6% for 2025 in the previous round.[4] The median longer-term point expectations for HICPX also increased to 1.7% from 1.6% previously. The evolution of longer-term expectations for HICP and HICPX inflation has been broadly similar for the period of available data since the fourth quarter of 2016 and the level difference of around 0.1 percentage point on average remained broadly unchanged in the third quarter of 2021 round.
Chart 3
Longer-term inflation expectations
(annual percentage changes)
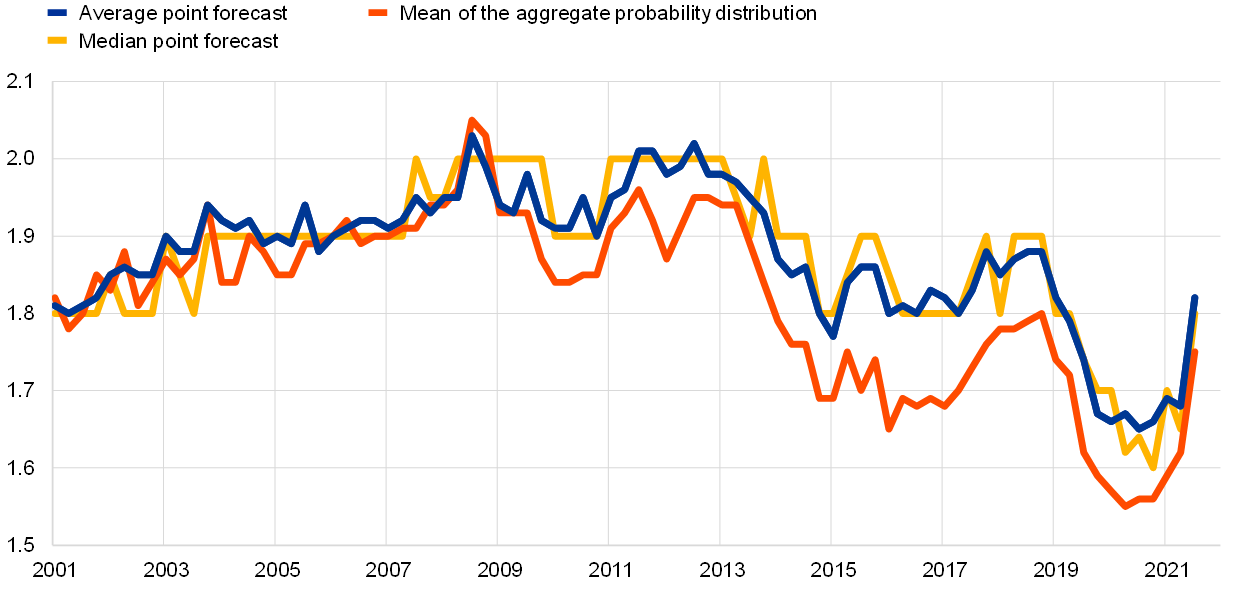
Chart 4
Distribution of point expectations for HICP inflation in the longer term
(x-axis: longer-term HICP inflation expectations, annual percentage changes; y-axis: percentages of respondents)
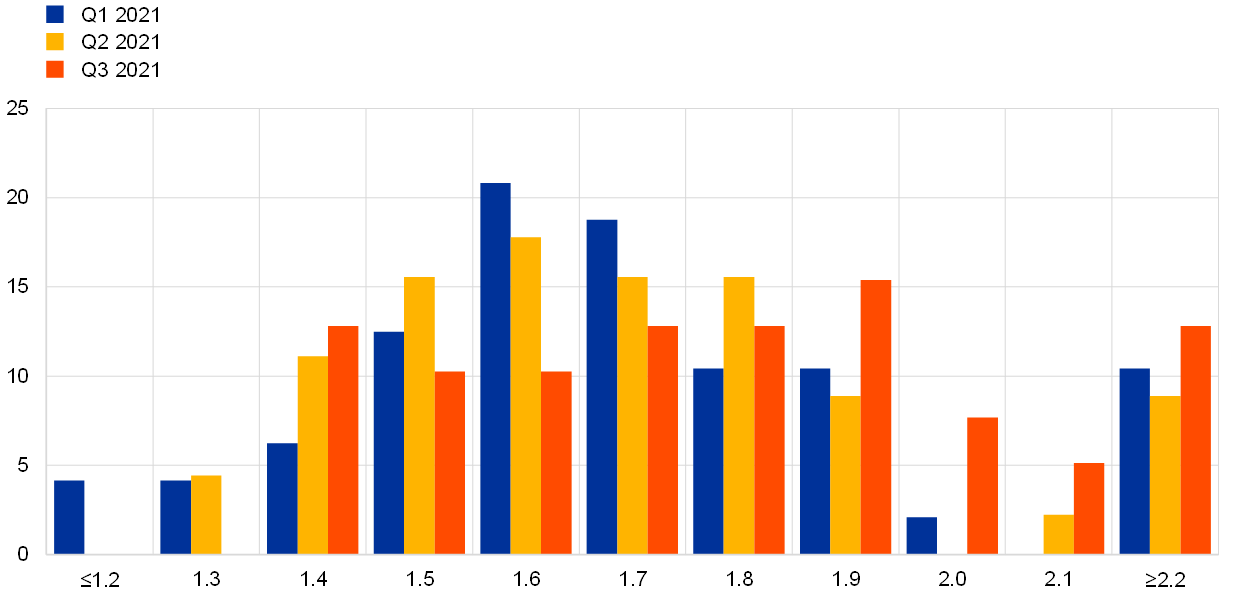
Notes: The SPF asks respondents to report their point forecasts and to separately assign probabilities to different ranges of outcomes. This chart shows the spread of point forecast responses.
Uncertainty surrounding longer-term inflation expectations remained elevated and the balance of risks stayed to the downside. The standard deviation of the aggregate probability distribution increased somewhat, owing mainly to increased disagreement (reflecting in part the two outliers mentioned above), although there was also a small increase in individual uncertainty.[5] Notwithstanding the upward revision in point expectations, respondents’ probability distributions imply that the balance of risks surrounding these remained clearly to the downside. The probability associated with longer-term inflation being negative remained broadly unchanged from the previous round at around 2%. (see Chart 5).
Chart 5
Aggregate probability distribution for longer-term inflation expectations
(x-axis: HICP inflation expectations, annual percentage changes; y-axis: probability, percentages)

Notes: The SPF asks respondents to report their point forecasts and to separately assign probabilities to different ranges of outcomes. This chart shows the average probabilities they assigned to different ranges of inflation outcomes in the longer term.
3 Real GDP growth expectations revised upwards for shorter and medium-term horizons
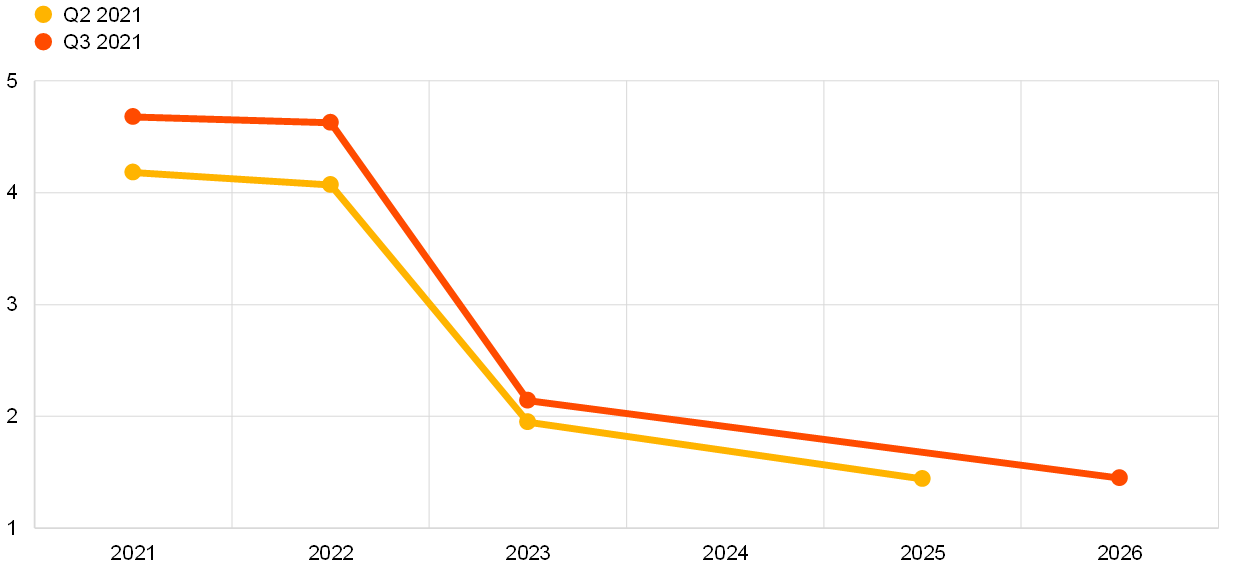
GDP growth expectations in the third quarter survey round stood at +4.7% for 2021, +4.6% for 2022 and +2.1% for 2023 (see Chart 6). These expectations implied upward revisions of 0.5 percentage points for 2021 and 2022 and 0.2 percentage points for 2023. Respondents explained that these revisions were a result of the now clearly more advanced vaccination rollout in Europe, which is making it possible to ease COVID-19 containment measures. While a number of respondents pointed out the already apparent strength in industrial activity, the larger impact is expected from consumption picking up, as consumers are eager to spend part of their savings accumulated over the lockdown period on services (including international tourism). In addition, a substantial number of respondents expect positive fiscal stimulus from the Next Generation EU plans as well as higher foreign demand as a spillover from the stimulus package in the United States. The average SPF point forecasts are very similar to the baseline of the June 2021 Eurosystem staff Broad Macroeconomic Projection Exercise (BMPE) (see Table 1). Longer-term growth expectations (which refer to 2026) remained stable at 1.4% (in the previous round, these referred to 2025).
Chart 6
Expectations for real GDP growth
(annual percentage changes)
Respondents were again asked to provide the profile of their short-term GDP outlook. In this round, 44 respondents provided their expected quarterly profile of quarter-on-quarter GDP growth from the second quarter of 2021 until the first quarter of 2022. On average, they expected real GDP to have increased by 1.4% in the second quarter of 2021, to accelerate further to 2.6% in the third quarter and finish the year in the fourth quarter with a quarter-on-quarter growth rate of 1.5%. These forecasts imply only minor revisions for the second and third quarters of 2021, but a more sizeable upward revision of 0.3 percentage points for the fourth quarter of 2021 (see Chart 7). In the first quarter of 2022, although moderating, real GDP growth is expected to remain relatively robust at 0.9% quarter-on-quarter (or 3.6% in annualised terms). The growth expectations imply that economic activity is now expected to surpass its pre-pandemic level (fourth quarter of 2019) in the fourth quarter of 2021, i.e. one quarter earlier than previously expected. Compared with the June 2021 BMPE, SPF respondents were on average broadly in line for the second quarter of 2021, somewhat less optimistic for the third quarter of 2021 and marginally more optimistic for subsequent quarters.
Chart 7
Expected profile of quarter-on-quarter GDP growth
(quarter-on-quarter percentage changes)
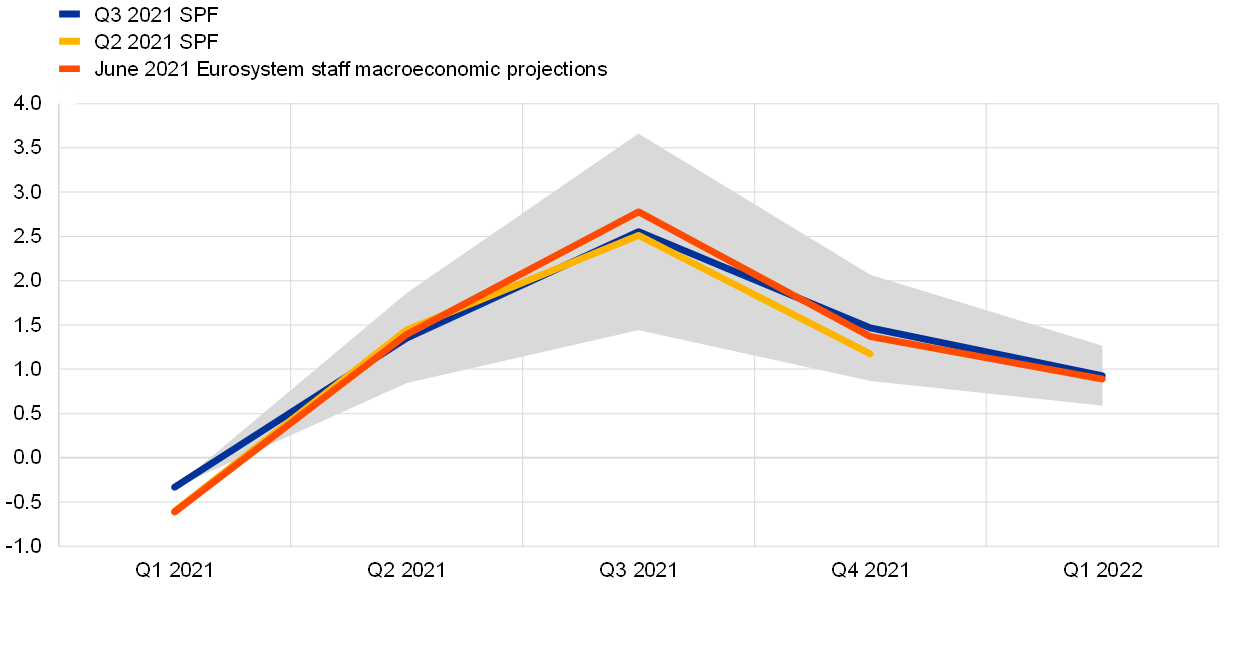
Notes: Grey area indicates one standard deviation (of individual expectations) around average SPF expectation.
While GDP is expected to return above its pre-pandemic level at the end of 2021, respondents expected it would not return to its pre-pandemic path until around 2024/2025 (see Chart 8). In annual terms, the expected level of GDP is expected to be above the 2019 level by 2022 and at that point stand higher (by 1.1 percentage points) than anticipated in the previous survey round. However, this would still be 1.5 percentage points lower than the level forecast for 2022 in the first quarter of 2020 round (i.e. before COVID-19 hit Europe). Looking further ahead, respondents expected the level of GDP growth to catch up on its pre-pandemic path at some point around 2024/25.
Chart 8
Forecast profile of real GDP level
(2019 = 100)
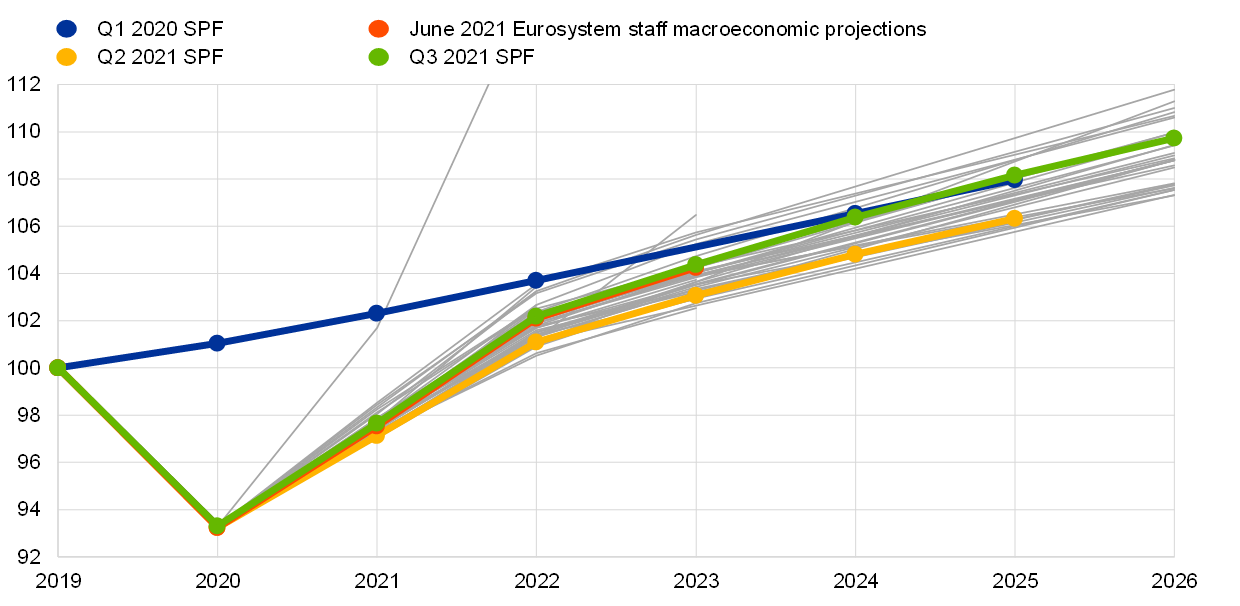
Notes: Growth expectations for years not surveyed have been interpolated linearly. Grey lines denote individual forecaster profiles in the round for the third quarter of 2021. The profile of one respondent was significantly outside the range (to the upside) of the other respondents and is not completely represented in the chart for presentational reasons.
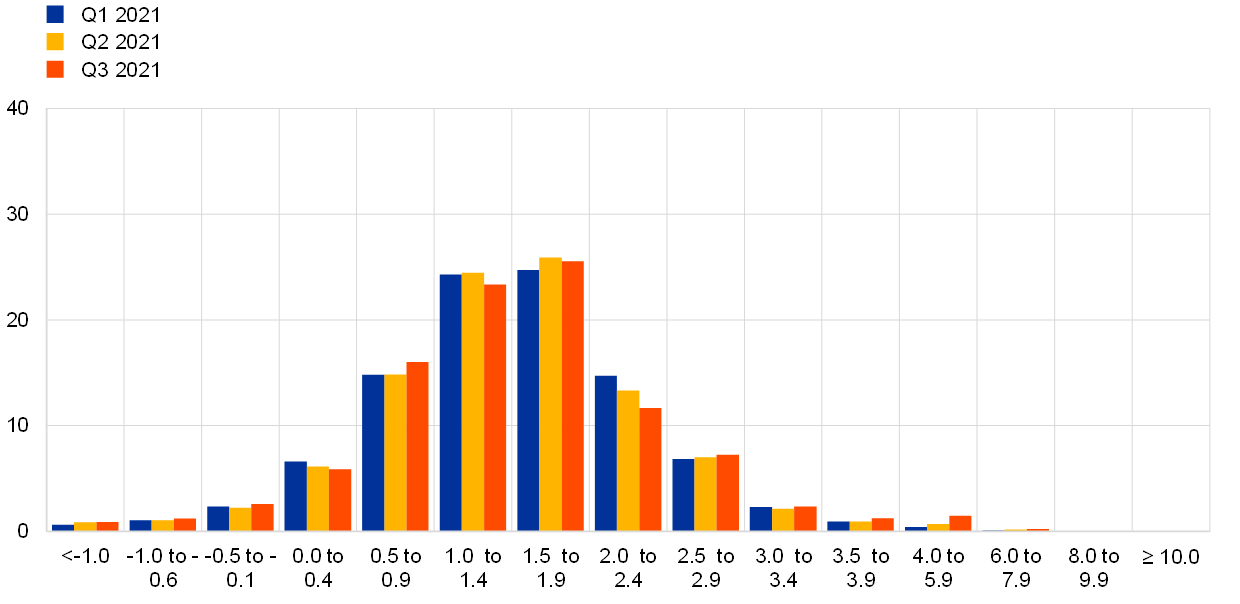
Although the quantitative measures of uncertainty have eased slightly, they remained at high levels while the balance of risk indicators nudged slightly further into positive territory. Chart 9 and Chart 10 present the aggregate probability distributions for GDP growth for the years 2021-23 and in the longer term (2026) respectively. Uncertainty decreased marginally at the two-years ahead horizon while it increased slightly for the longer term. Uncertainty remained higher than before the pandemic but was considerably lower than at its peak in the second and third quarters of 2020. In the qualitative comments, respondents cited increasingly more upside risks to their baseline forecasts than in previous survey rounds, focusing mainly on the risk that containment measures could be lifted sooner than anticipated. However, some also see an upside risk related to the amount of accumulated savings that would be spent by consumers. Nonetheless, respondents continued to point to downside risks, with the most cited one being that of a worsening of the pandemic due to the emerging Delta variant (or other new variants) which could delay the easing of restrictions or require new lockdowns in the autumn. A number of respondents also expressed concerns about the growth outlook in the manufacturing sector due to the various supply side bottlenecks, such as the shortage of semiconductor chips.
Chart 9
Aggregate probability distributions for GDP growth expectations for 2021, 2022 and 2023
(x-axis: real GDP growth expectations, annual percentage changes; y-axis: probability, percentages)
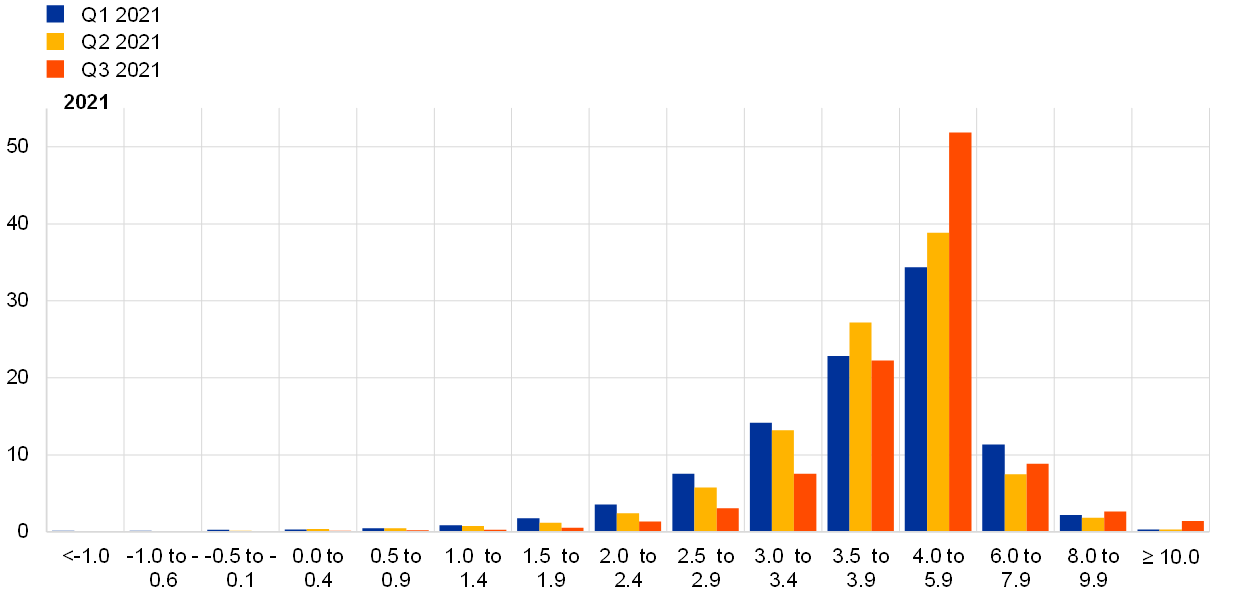
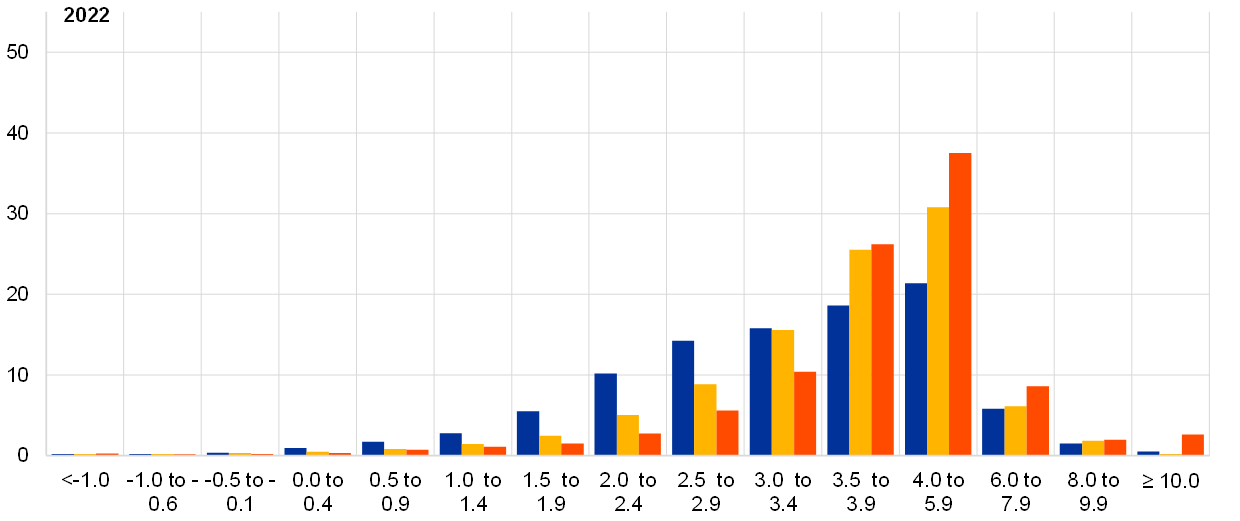
Notes: The SPF asks respondents to report their point forecasts and to separately assign probabilities to different ranges of outcomes. This chart shows the average probabilities they assigned to different ranges of real GDP growth outcomes in 2021, 2022 and 2023. For outcomes above 4%, bins are 2 percentage points wide.
Chart 10
Aggregate probability distribution for longer-term GDP growth expectations
(x-axis: real GDP growth expectations, annual percentage changes; y-axis: probability, percentages)
Notes: The SPF asks respondents to report their point forecasts and to separately assign probabilities to different ranges of outcomes. This chart shows the average probabilities they assigned to different ranges of real GDP growth outcomes in the longer term.
4 Unemployment rate expectations revised down for all horizons
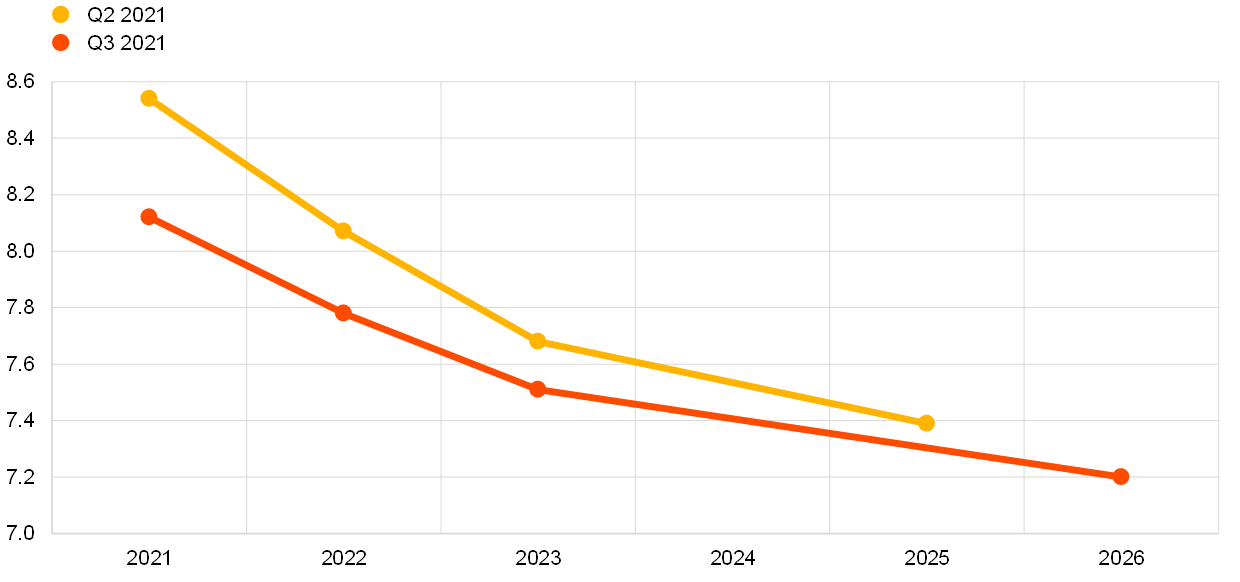
The average point forecasts for the unemployment rate in the third quarter of 2021 round were 8.1%, 7.8% and 7.5% for 2021, 2022 and 2023, respectively (see Chart 11). This still results in an expected steady decline in the euro area unemployment rate to 7.2% by 2026, the lowest level recorded since the third quarter of 2008. Downward revisions steadily decline over longer horizons, from 0.4 percentage points in 2021 to 0.2 percentage points in 2023, thereby resulting in a somehow flatter downward-sloping trajectory than in the previous round. The clear reduction in the expected unemployment rate for 2021 seems to reflect lower than expected outcomes combined with expected high growth over the second half of the year. In the medium term, many respondents reported high growth and the extension of job-retention schemes to be the main drivers for lower unemployment rates in 2022. However, some forecasters perceive upside risks in the spread of new COVID-19 variants and the eventual reintroduction of containment measures, weaker than expected growth of the tertiary sector and low hiring rates by financially constrained firms. On the contrary, a few respondents mentioned recent higher than expected labour demand to be a signal for even further future reductions of the unemployment rate.
Chart 11
Expectations for the unemployment rate
(percentages of the labour force)
Uncertainty surrounding unemployment rate expectations remained broadly unchanged and still at very high levels, while risks were neutral overall. Aggregate uncertainty about the expected unemployment rate (as measured by the average width or standard deviations of the aggregated probability distributions) were roughly unchanged compared to the previous SPF round and continued to stand at historically high levels. On balance, the probability distributions were broadly neutral for the shorter horizons but remained slightly skewed to the upside for the longer horizon (see Chart 12 and Chart 13).
Chart 12
Aggregate probability distributions for the unemployment rate in 2021, 2022 and 2023
(x-axis: unemployment rate expectations, percentages of the labour force; y-axis: probability, percentages)
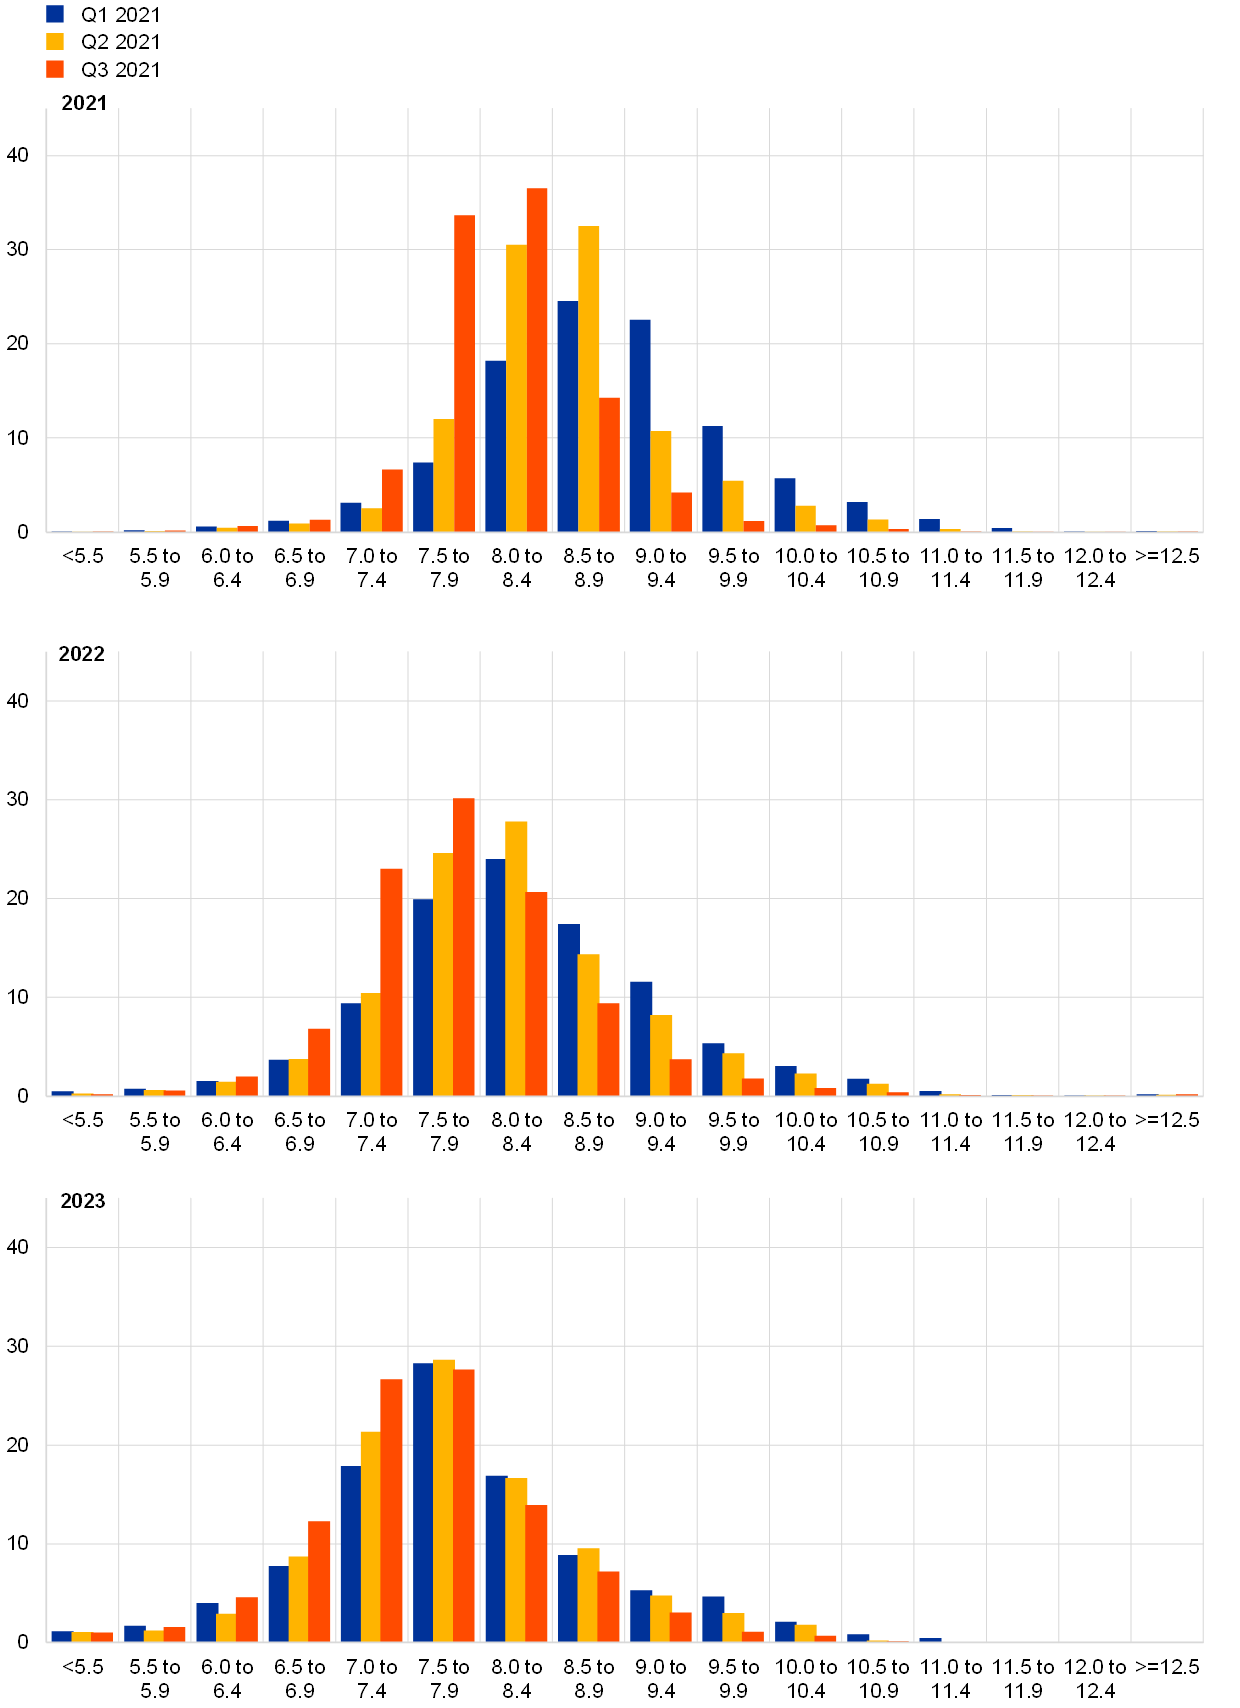
Notes: The SPF asks respondents to report their point forecasts and to separately assign probabilities to different ranges of outcomes. This chart shows the average probabilities they assigned to different ranges of unemployment rate outcomes for 2021, 2022 and 2023.
Chart 13
Aggregate probability distribution for the unemployment rate in the longer term
(x-axis: unemployment rate expectations, percentages of the labour force; y-axis: probability, percentages)
Notes: The SPF asks respondents to report their point forecasts and to separately assign probabilities to different ranges of outcomes. This chart shows the average probabilities they assigned to different ranges of unemployment rate outcomes in the longer term.
5 Expectations for other variables
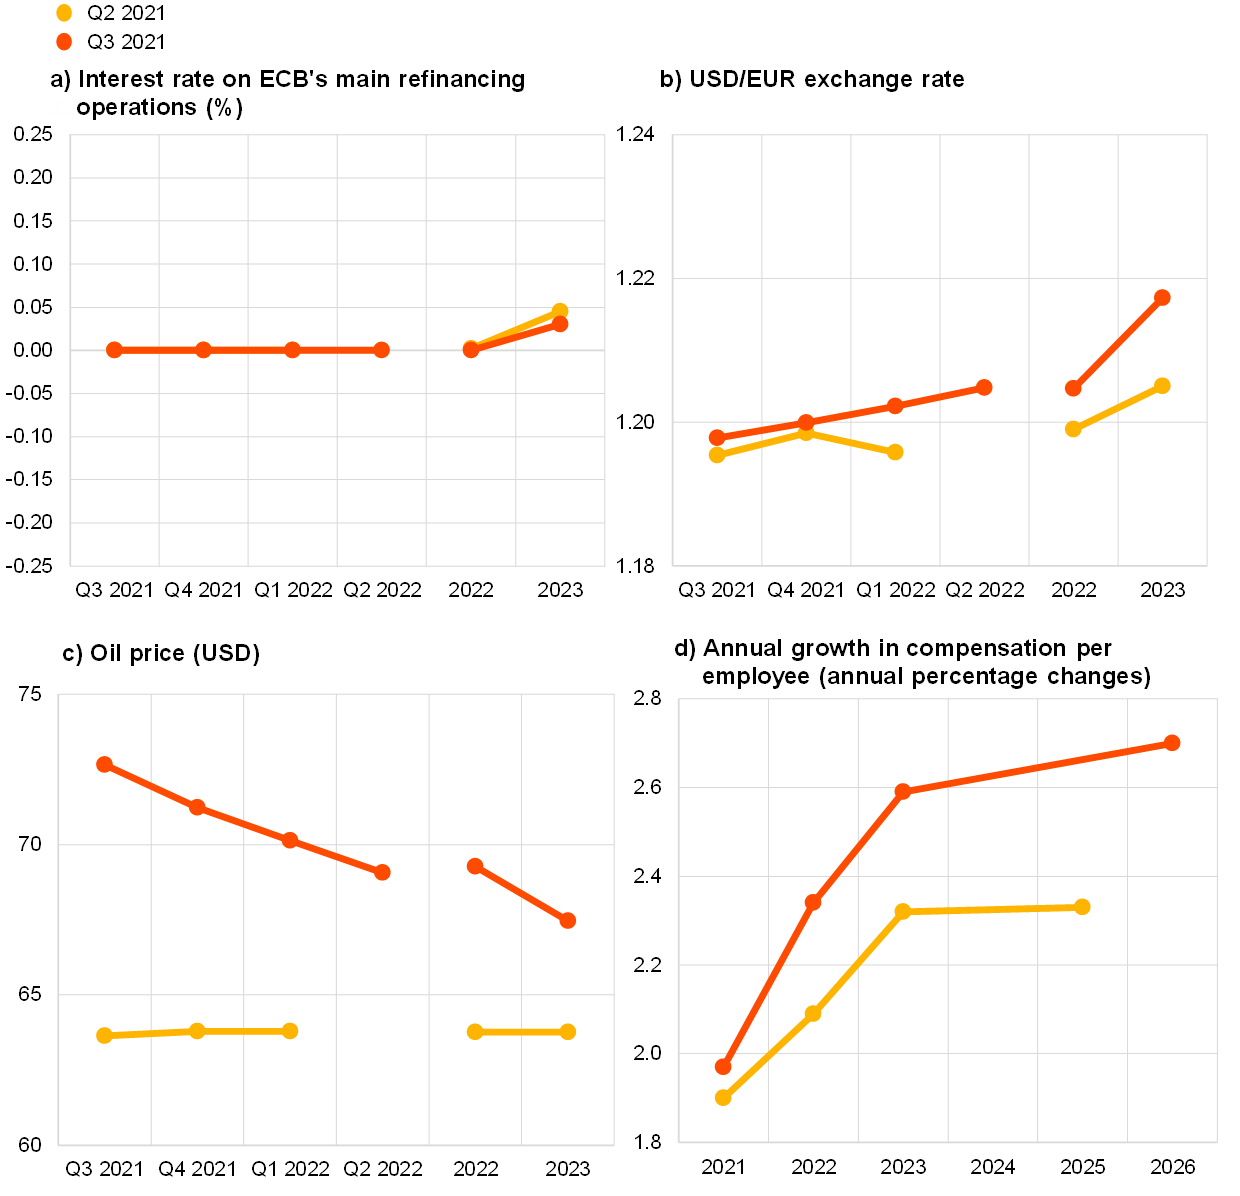
Respondents expected: (i) the ECB’s main policy rates to remain unchanged until at least 2023; (ii) the euro to be largely stable against the dollar at about 1.20 until 2023; (iii) oil prices to decrease gradually to levels around USD 68 per barrel until 2023; and (iv) nominal wage growth to increase over the whole forecast horizon from around 2.0% in 2021 to 2.7% by 2026.
The median (and majority) expectation for the rate on the ECB’s main refinancing operations was for it to remain at 0% until at least 2023. Overall, interest rate expectations were essentially unchanged from the previous round (see panel (a) of Chart 14).
The average USD/EUR exchange rate was expected to remain broadly constant at 1.20 over the reported period – with a slight increase to 1.22 foreseen in 2023. This profile was marginally higher when compared with the previous SPF round (see panel (b) of Chart 14).
Compared with the previous round, the expected level of US dollar-denominated oil prices (per barrel) was revised upwards. The revisions were larger at around USD 9 per barrel for the third quarter of 2021 but more modest at around USD 4 per barrel for 2023. The profile of expected oil prices is for a decline from about USD 73 per barrel in the third quarter of 2021 to around USD 68 per barrel in 2023 (see panel (c) of Chart 14). Given the broadly unchanged expectations for the USD/EUR exchange rate, the implied revisions to the profile for the oil price in euro terms are similar to the revisions to the profile in US dollar terms.
The profile of the average expectation for the annual growth in compensation per employee was revised upwards compared to the previous round and was expected to follow an upward-sloping trajectory. Average point forecasts were 2.0% in 2021, 2.3% in 2022 and 2.6% in 2023, therefore higher than in the previous round. For 2026, annual growth in compensation per employee was expected to increase to 2.7% – see panel (d) of Chart 14.
Chart 14
Expectations for other variables
6 Annex (chart data)
Excel data for all charts can be downloaded here.
© European Central Bank, 2021
Postal address 60640 Frankfurt am Main, Germany
Telephone +49 69 1344 0
Website www.ecb.europa.eu
All rights reserved. Reproduction for educational and non-commercial purposes is permitted provided that the source is acknowledged.
For specific terminology please refer to the ECB glossary (available in English only).
PDF ISSN 2363-3670, QB-BR-21-003-EN-N
HTML ISSN 2363-3670, QB-BR-21-003-EN-Q
- The survey was conducted between 30 June and 5 July 2021 (before the ECB press conference on 8 July reporting the outcome of the strategy review) with 57 responses received, which is slightly above the average response for the third quarter (July) round (54). Participants were provided with a common set of the latest available data for annual HICP inflation (June 2021 flash estimates: overall inflation, 1.9%; underlying inflation, 0.8%), annual GDP growth (first quarter of 2020, -1.3%) and unemployment (May 2021, 7.9%).
- Respondents were asked “whether and to what extent your shorter-term outlook for consumer price inflation includes unusual price pressures from currently discussed sources such as costs and shortages of inputs and production factors; and whether you expect current inflation developments to feed through to wages”.
- Of the 34 respondents providing longer-term inflation HICP expectations in both rounds, 10 revised them up, one down and 23 were unchanged.
- Of the 27 respondents who provided longer-term HICPX expectations in both the third quarter and second quarter rounds, 8 revised them up, one revised them down and 18 were unchanged.
- The width of the reported probability distributions indicates the perceived degree of overall uncertainty, whereas the asymmetry of the distributions indicates whether that uncertainty is more concentrated on higher or lower outturns, i.e. it measures the perceived balance of risks. Regarding uncertainty, it can be shown that the width (or standard deviation) of the aggregated probability distribution (“aggregate uncertainty”) is a function of the average width (or standard deviations) of the individual probability distribution (“individual uncertainty”) and standard deviation of the individual point forecasts (“disagreement”).
-
23 July 2021