
The fiscal impact of financial sector support measures: where do we stand a decade on from the financial crisis?
Published as part of the ECB Economic Bulletin, Issue 6/2018.
This box takes a further look at the fiscal impact of the financial sector support measures taken in the ten years since the financial crisis struck. With the euro area economy entering its fifth year of expansion, this seems like a good moment to take stock of the fiscal costs of the crisis and the extent to which the recovery has helped to recoup them. This is done by focusing on the measures’ impact on deficits and debt, and on the state guarantees granted to banks and other financial institutions.[1] Steps have been taken since the crisis to improve the supervision of the financial sector, the orderly resolution of failing financial institutions, the sustainability of public finances and the resilience of sovereigns, for example by establishing bodies like the Single Supervisory Mechanism, the Single Resolution Mechanism and the European Fiscal Board.
Financial sector support measures can affect deficit and debt differently. Unless they are financed from cash reserves, financial sector support measures will increase the general government gross debt. Whether they will also affect the budget balance depends on whether the operation presents a clear loss for the government.[2] If so, they are classified as a capital transfer for statistical purposes, meaning they have an impact on the budget balance and debt ratio. The acquisition of financial assets above market price and capital injections to cover bank losses are typical examples of this. However, if the government receives shares in a bank or debt securities that are considered to be of equal value to the capital injection it provides, the support measure is classified as a financial operation that only affects the general government gross debt. The statistical reclassification of entities from the financial sector to the general government sector, notably reflecting the nationalisation of banks, also increases government debt but not the budget deficit.
The fiscal impact of the financial sector support that euro area governments provided following the 2008 financial crisis was large and varied greatly across countries, and has only partially been reversed (see Chart A). During and after the global financial crisis that was marked by the collapse of Lehman Brothers on 15 September 2008, most euro area governments provided support to individual financial institutions in order to safeguard financial stability.[3] The size and timing of the support differed widely across countries (see Chart B and Chart C).[4]
Chart A
Impact of financial sector support measures on euro area deficit and debt, and volume of contingent liabilities
(percentage of GDP)

Source: Eurostat.
Note: Positive figures indicate an increase in the deficit. The impact on the deficit is net of income generated from financial support measures, such as dividends received on shares in financial institutions and fees received for public guarantee.
At the euro area level, financial sector support measures had a very large impact on the aggregate budget deficit in 2010 (0.7% of GDP), 2012 (0.5% of GDP) and 2013 (0.3% of GDP) (see Chart A). Only one country, Germany, recorded a tangible increase in its deficit in 2008 caused by financial sector support measures; this number increased to six in 2009 and peaked at nine in 2012 (see Chart B). While declining until recently, the impact on the euro area deficit has never been zero in the past ten years, and 2017 saw the effect increase again due to capital transfers in Italy, Portugal and Cyprus. Viewed across several years, the scale of the impact was in many cases equal to, or even far greater than, the effect of fiscal measures taken during regular budget cycles. Eight countries saw a cumulative impact between 2008 and 2017 that was higher than the euro area average, varying from an increase in the budget deficit of more than 4 percentage points of GDP in Spain, Austria and Latvia to more than 27 percentage points in Ireland (see Chart B).
Chart B
Net impact of financial sector support measures on the general government deficit
(percentage of GDP)

Source: Eurostat.
Notes: The chart does not include countries without support measures affecting the deficit (Estonia, Malta, Slovakia and Finland) or where such measures only have a marginal impact (0.1% of GDP in France in 2012). Positive figures indicate an increase in the deficit. The impact on the deficit is net of income generated from financial support measures, such as dividends received on shares in financial institutions and fees received for public guarantee. For readability, the countries are divided into two groups in order to present the same number of cases in each panel: the left panel excludes observations with a deficit impact below 0.4% of GDP and the right panel below 0.1% of GDP.
The impact on the euro area debt-to-GDP ratio, which peaked at almost 5.9% in 2012, stood at 4.1% in 2017. The maximum impact of the support measures on the debt-to-GDP ratio was 10% or more in eight euro area countries (see Chart C), including Germany, the Netherlands, Austria and Slovenia as well as the four euro area countries that required an EU/IMF adjustment programme (Ireland, Greece, Cyprus and Portugal). The time profile of the impact of the support measures on the general government gross debt varies considerably. The impact has started to partially and slowly reverse in most countries and in the euro area as a whole, thanks to the income generated from the support measures, such as dividends received on shares in financial institutions and fees received for public guarantees, and the sale of financial assets. Across countries, the recovery from the support provided has been particularly pronounced in Ireland, where the impact of financial sector support measures on the debt-to-GDP ratio had declined by 30 percentage points by 2017 compared with the peak, and also the Netherlands (ten percentage points since the peak), Latvia and Germany (six percentage points since the peak). However, support measures added to the debt in Italy, Cyprus and Portugal in 2017.
Chart C
Impact of financial sector support measures on general government gross debt
(percentage of GDP)
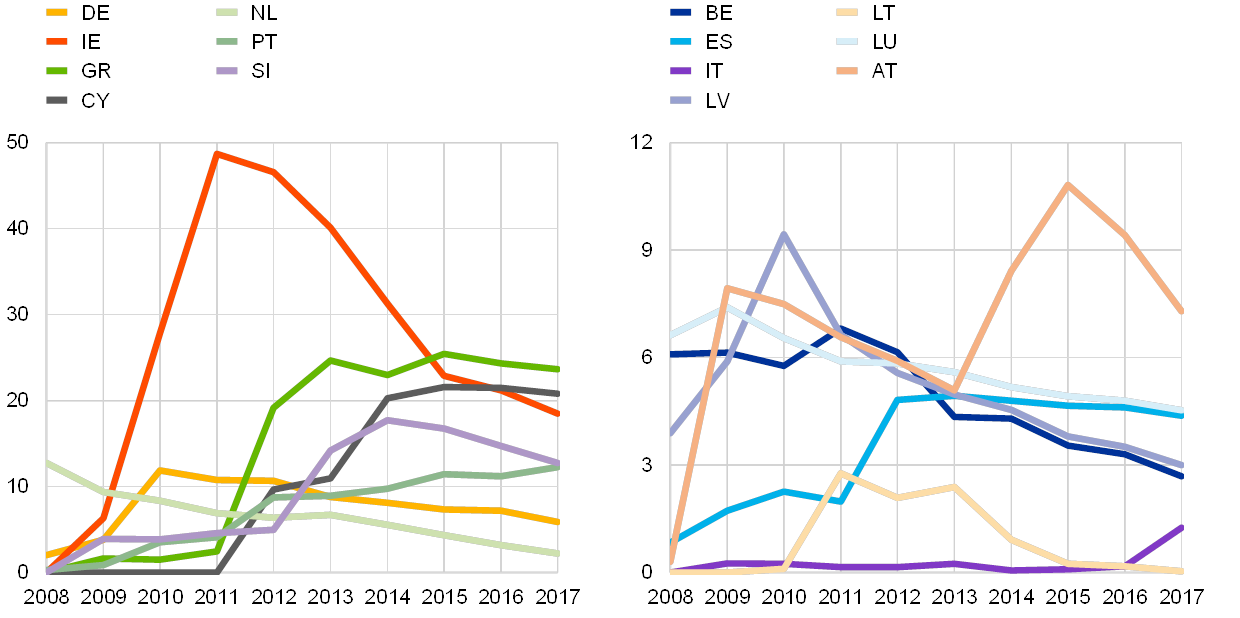
Source: Eurostat.
Note: The chart does not include countries without support measures affecting gross debt (Estonia, Malta, Slovakia and Finland) or where such measures only have a marginal impact (0.6% of GDP in 2008, and 0.1% of GDP in 2012 in France).
Euro area contingent liabilities fell from more than 8% of GDP in 2009 to 1.4% in 2017. In most cases, the explicit guarantees that many euro area governments provided to individual institutions at the height of the financial crisis or, in a few instances, the financing of asset management vehicles have been phased out (see Chart D). This mostly represents a positive development, as a return to financial stability meant there was no need to renew expiring guarantees. However, some guarantees have been called, and receiving entities have been classified in the general government sector, causing the reduction in the guarantee to be matched by an equivalent increase in government debt and/or deficit. For example, one-fifth of the guarantees provided as part of the partial privatisation of the Portuguese bank Novo Banco in October 2017, amounting to 2% of GDP, have been called, serving to increase the 2018 deficit by 0.4 percentage point of GDP. Six euro area countries, including France, Italy and Spain, still had outstanding contingent liabilities exceeding 1% of GDP in 2017. In addition, in July 2018 Cyprus provided guarantees for an asset protection scheme (APS) as part of the sale of the Cyprus Cooperative Bank (CCB). The APS covers potential unexpected losses on assets which have been acquired by the buyer of CCB, amounting to about 13% of GDP.[5]
Chart D
Volume of contingent liabilities
(percentage of GDP)

Source: Eurostat.
Notes: The chart does not include countries without contingent liabilities associated with financial sector support (Estonia, Malta, Slovakia and Lithuania) or where such liabilities are minimal (0.1% of GDP in Finland in 2008). Contingent liabilities refer to government guarantees to the banking sector. The outstanding government guarantees do not include guarantees covering retail deposits (except for Ireland from 30 September 2008 to 29 September 2010) or state guarantees for emergency liquidity assistance.
The widespread, large and long-lasting fiscal impact of financial sector support measures underlines the importance of further reinforcing the institutional framework in the euro area. As the Euro Summit on 29 June 2018 concluded, there is still progress to be made on the completion of the banking union and strengthening the European Stability Mechanism. Further work on this reform agenda, as well as continued efforts to safeguard fiscal sustainability, will be required to prevent future financial crises and mitigate the associated fiscal impact.
- The impact of negative correlations between financial sector stability and government financing conditions that contributed to the sovereign debt crises in a number of euro area countries from 2010 onwards falls beyond the scope of this box. For a description of the channels and risks of the adverse financial-fiscal feedback loop, see “The impact of government support to the banking sector on euro area public finances”, Monthly Bulletin, ECB, July 2009, and “Monetary and fiscal policy interaction in a monetary union”, Monthly Bulletin, ECB, July 2012.
- For more detailed information on the statistical classification of financial sector support measures, see “The fiscal impact of financial sector support during the crisis”, Economic Bulletin, Issue 6, ECB, 2015, and Maurer, H. and Grussenmeyer, P., “ Financial assistance measures in the euro area from 2008 to 2013: statistical framework and fiscal impact”, Statistics Paper Series, No 7, ECB, 2015.
- For a description of the financial crisis and fiscal and financial measures taken, see Riet, A. (ed.), “Euro area fiscal policies and the crisis”, Occasional Paper Series, No 109, ECB, 2010, and Stolz, S. and Wedow, M., “Extraordinary measures in extraordinary times: public measures in support of the financial sector in the EU and the United States”, Occasional Paper Series, No 117, ECB, 2010.
- Only four countries Estonia, Malta, Slovakia and Finland, together representing 3% of euro area GDP did not need to take any measures that affected their deficit or debt.
- These guarantees come on top of state support in the form of bond and cash placements of about 18% of GDP, the statistical classification of which is yet to be determined.
Euroopan keskuspankki
Viestinnän pääosasto
- Sonnemannstrasse 20
- 60314 Frankfurt am Main, Germany
- +49 69 1344 7455
- media@ecb.europa.eu.
Kopiointi on sallittu, kunhan lähde mainitaan.
Yhteystiedot medialle