
Imbalances in China: is growth in peril from a housing market downturn?
Published as part of the ECB Economic Bulletin, Issue 5/2018.
The Chinese economy has recently been playing a key role in the global economic recovery. Recording growth rates of more than 6.5% over the past five years, China has contributed on average one-third of total global growth. It has also become one of the euro area’s largest trading partners, accounting for almost 7% of total extra-euro area exports. While the world economy has benefited from China’s economic strength and growing importance, a downturn would also have large repercussions for global activity. In fact, imbalances in China have been identified as a key external downside risk to the euro area and world economy.[1] One catalyst for such a risk materialising could be the housing market.
An abrupt downturn in the Chinese housing market after a long period of expansion could have a significant adverse effect on the economy, as the real estate and construction sector accounts for approximately 15% of China’s GDP. The real estate sector was a key driver of China’s robust economic growth in 2017. Against this background, this box outlines the recent developments in China’s housing market and presents an estimate of the impact that a housing market shock could have on the Chinese economy.
After a period of expansion lasting an unprecedented two years, China’s housing market has cooled down. Overall house prices in China rose by 10% annually between late 2016 and late 2017, with some prime markets reaching annual growth rates of over 30%. This expansion cycle has contributed to strong domestic demand and the robust pick-up in producer and commodity prices. Average house price growth slowed down to about 5% year on year up until June 2018, while housing sales, which had also expanded rapidly since mid-2015, have also decelerated from their earlier peaks. However, compared with previous episodes of strong house price corrections, housing inventory levels are currently lower, thereby suggesting a less pressing need to absorb excess supply through price concessions. Accordingly, the slowdown in prices and sales thus far has been somewhat less pronounced than in previous downturns (see Chart A), possibly also reflecting a more nuanced approach to domestic policy.
Chart A
House prices, house sales and inventories in China
(left-hand scale: year-on-year percentages; right-hand scale: index)
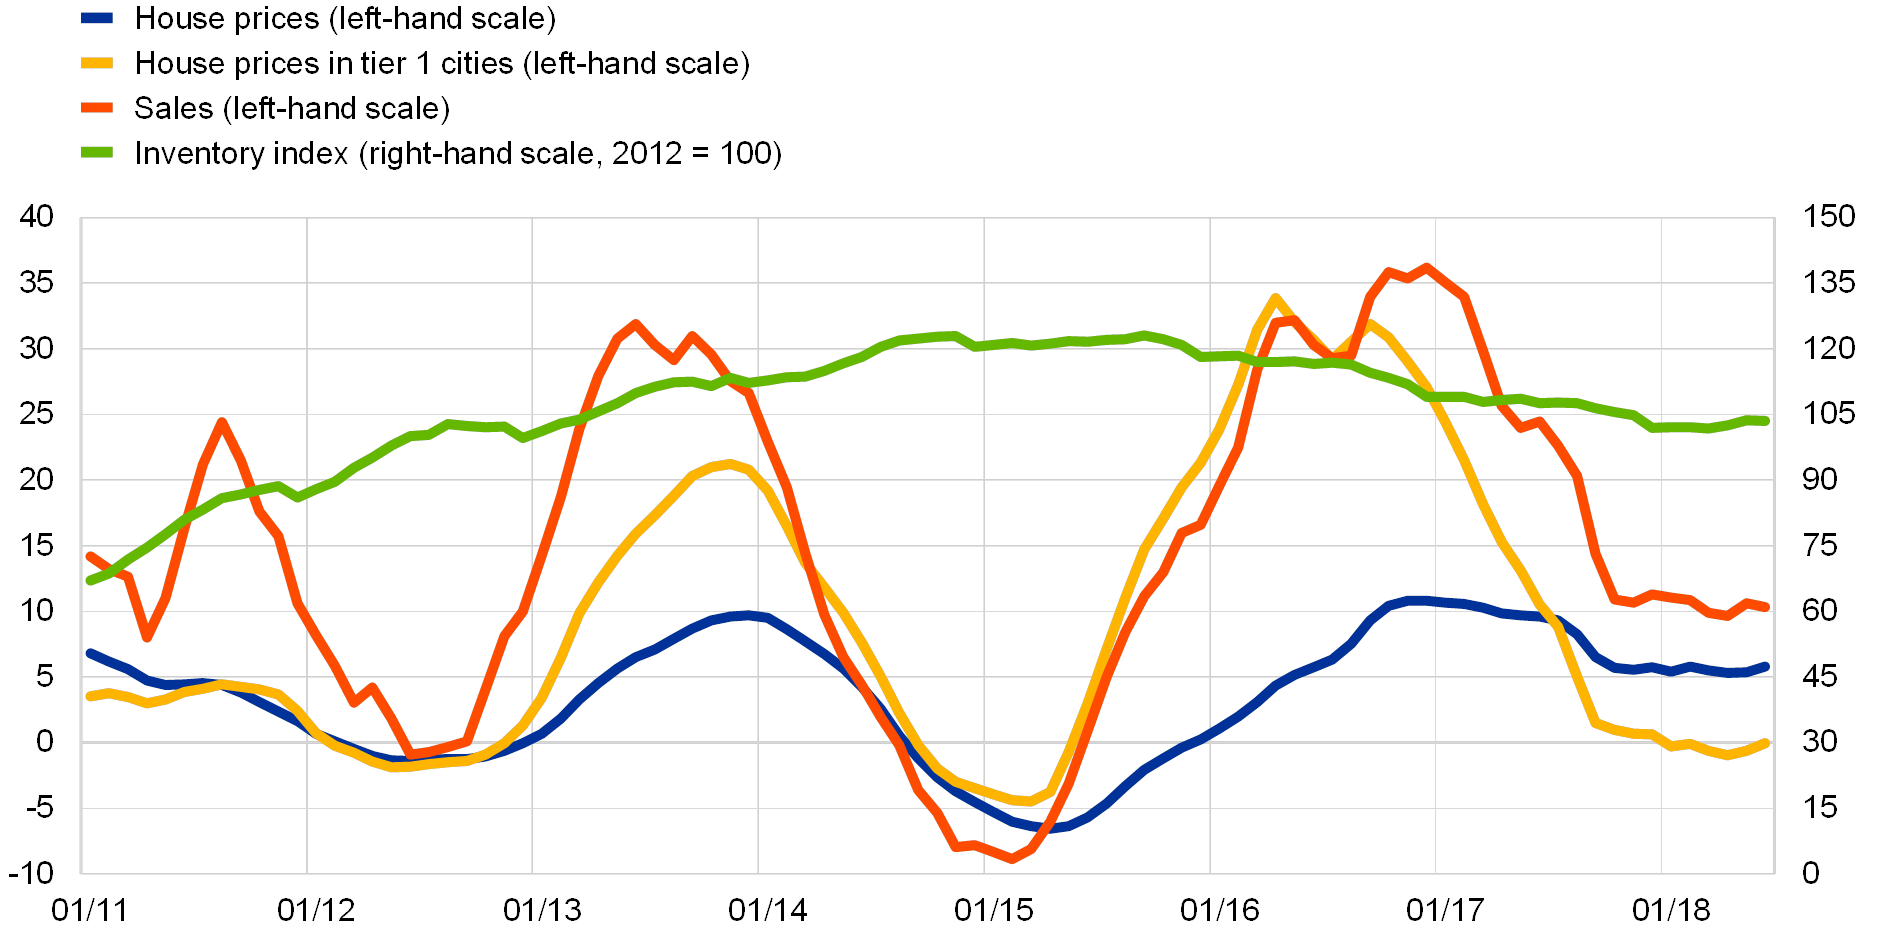
Sources: CEIC, Wind and ECB calculations.
Notes: Inventories are calculated by subtracting house sales from housing starts. Tier 1 cities are China’s largest cities, namely Beijing, Guangzhou, Shanghai and Shenzhen. The latest observations are for June 2018.
While overall house prices in China have risen broadly in line with income growth, housing markets in the largest Chinese cities have decoupled and show signs of disproportionately high valuations. In China’s so-called tier 1 cities – Beijing, Guangzhou, Shanghai and Shenzhen – house price growth has well exceeded income growth over the past ten years. As a result, the rise in house prices relative to income in these cities appears comparable to that observed in Japan in the early 1990s and in the United States and the European Union prior to the global financial crisis, which ultimately proved to be unsustainable (see Chart B). On the one hand, while real estate purchases in tier 1 cities are often seen as a low‑risk financial investment, the divergence of house price and income growth could indicate that prices have indeed decoupled from fundamentals. On the other hand, house prices in the tier 1 cities – which are the political, financial and manufacturing centres of China – may be skewed upwards by housing demand from (high-income) individuals from across China, not just local inhabitants.
Chart B
House price growth relative to income growth in China’s tier 1 cities
(change in percentages, ten years prior to peak or latest data point; x-axis: change in income; y-axis: change in house price)
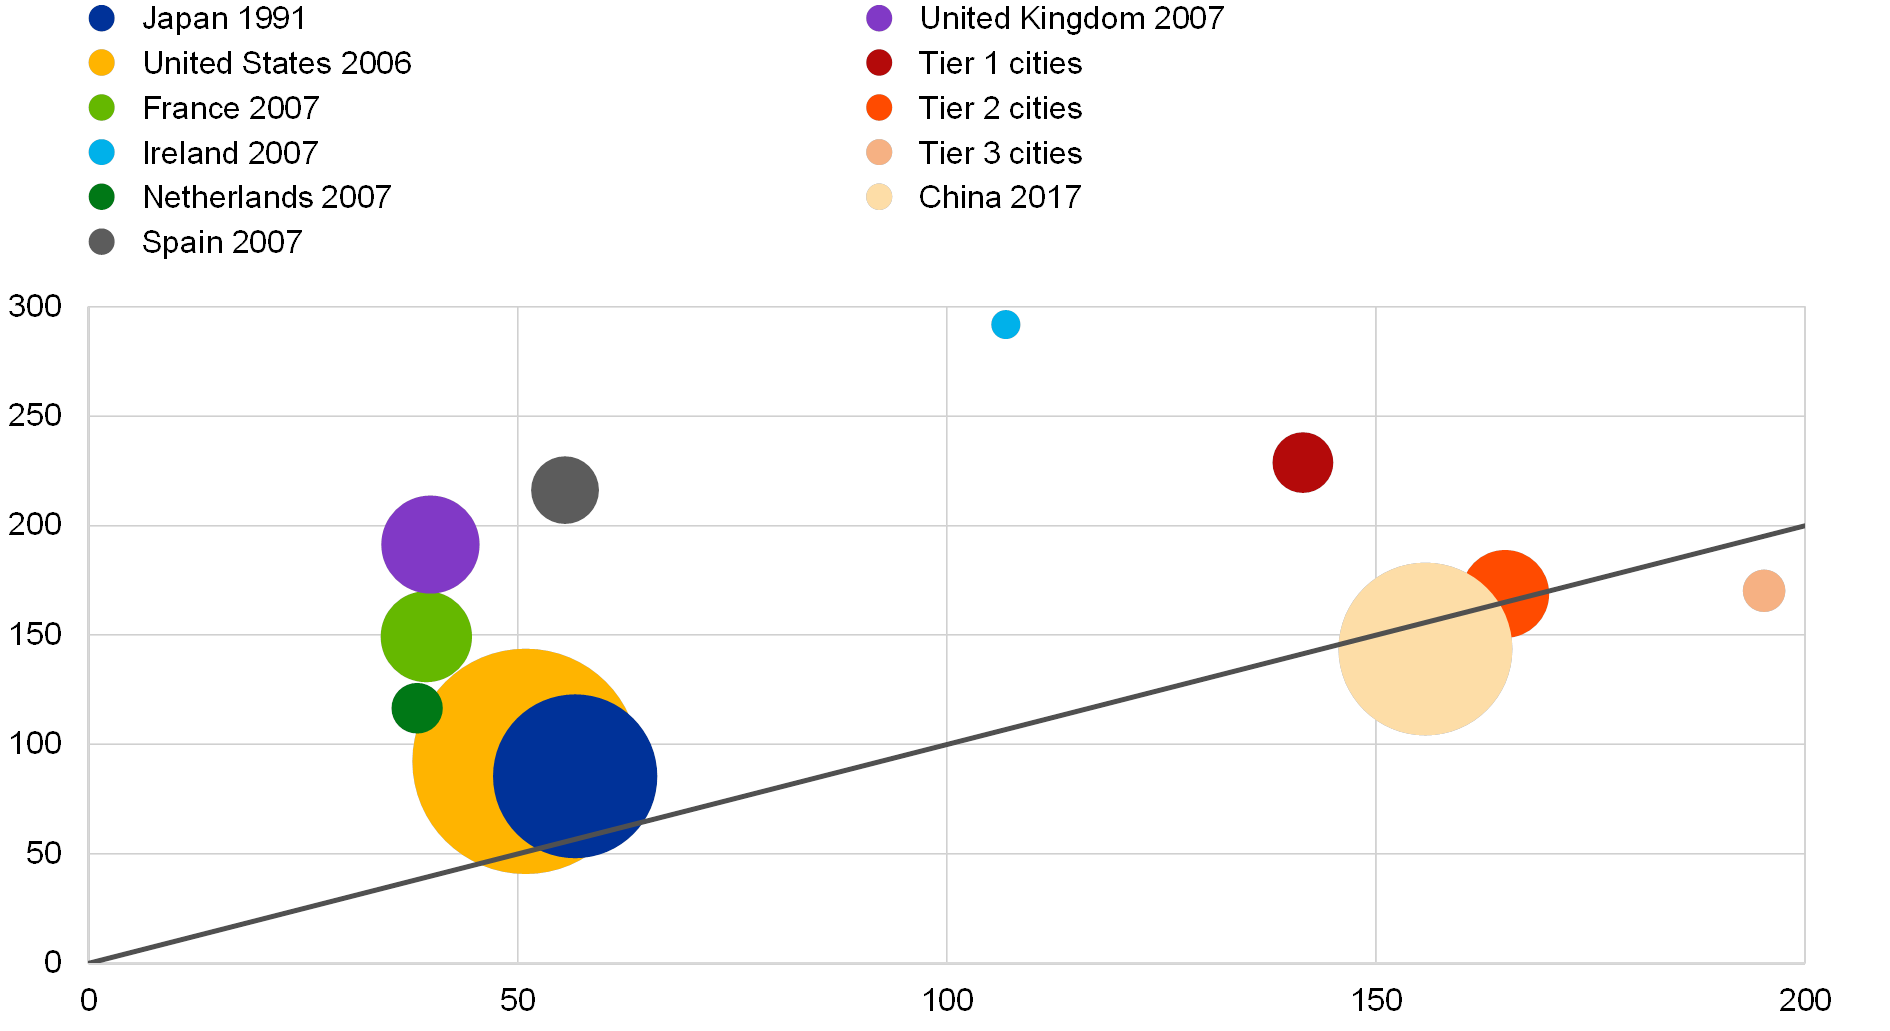
Sources: CEIC, Haver Analytics and ECB calculations.
Notes: The ratios are calculated for a ten-year period prior to the indicated year. The size of the bubbles is relative to each country’s or city tier’s share of world GDP at the end of the ten-year period. Tier 1 cities are China’s largest cities, namely Beijing, Guangzhou, Shanghai and Shenzhen. Tier 2 and tier 3 cities are smaller, provincial cities in China.
Some segments of the property sector could act as triggers for tightening financial conditions. The sharp increases in house prices of recent years were associated with significant property-related borrowing, including from abroad. In the near term, property developers are facing sizeable refinancing needs. Chinese household debt has risen to 48% of GDP, comparable with high-income countries, rendering them vulnerable to rising interest rates. As the Chinese authorities aim at deleveraging the economy, highly leveraged borrowers could face balance sheet pressures as financial conditions tighten. Moreover, local government budgets could be stretched by a pronounced slowdown in the housing sector, as land sales have been an important source of local government financing.
A severe housing market downturn could significantly affect the Chinese economy with possible global spillovers. A model simulation[2] assuming a fall in house prices of 6% and a decline in housing sales of 32% for four quarters (values similar to the 2008-09 downturn in housing activity) suggests that China’s GDP would decrease by close to 2% cumulatively over five quarters compared with the baseline (see Chart C). If financial conditions are allowed to loosen, the cumulative GDP growth impact would be slightly lower at 1.6%. However, declining confidence could further amplify these effects. Spillovers to the global economy and the euro area from a slowdown in China’s GDP could be non-negligible.[3]
Chart C
Impact of a temporary housing shock on GDP
(percentage deviation from potential output growth, quarter on quarter)

Source: ECB calculations.
While the economic impact of a nationwide housing market correction would be sizeable, for the time being sharp house price corrections are more likely to be localised. The risk of a housing market correction may be most pronounced in the tier 1 cities, but they represent less than 10% of China’s total housing market. Furthermore, robust income growth and ongoing urbanisation continue to support fundamental housing demand across China. Policymaking has also changed, taking local circumstances better into account when intervening in the housing market. However, some key risks prevail. A sharp correction in tier 1 cities could lead to tighter financing conditions more generally. Moreover, the current deleveraging campaign could put a number of highly leveraged firms under financial pressure, which could dampen construction activity. More importantly, a reassessment of China’s future growth potential could have a negative effect on housing demand. This would further hamper local government revenues and debt servicing capacity.
- See “China’s economic growth and rebalancing and the implications for the global and euro area economies”, Economic Bulletin, Issue 7, ECB, 2017.
- A Bayesian vector autoregressive model identified through sign restrictions is estimated based on quarterly data from the first quarter of 2001 to the fourth quarter of 2017 using the Bayesian Estimation, Analysis and Regression (BEAR) toolbox. Four shocks are identified: an aggregate demand shock, a monetary policy demand shock, a housing demand shock and a housing supply shock. The variables included in the model are GDP growth (expressed as a deviation from potential growth), the ratio of housing activity over overall activity (to differentiate between a housing demand shock and an aggregate demand shock), house price growth and growth of floor space sold. A financial conditions index is used to measure changes in financial conditions. Measures of global activity and commodity prices are included as exogenous variables to account for the potential influence of external developments. All variables are measured in quarter-on-quarter changes. The simulated shock could for instance be the result of a housing policy kept too tight for too long, adversely affecting both housing demand and supply.
- See “The transition of China to sustainable growth – implications for the global economy and the euro area”, Occasional Paper Series, No 206, ECB, January 2018.
Euroopan keskuspankki
Viestinnän pääosasto
- Sonnemannstrasse 20
- 60314 Frankfurt am Main, Germany
- +49 69 1344 7455
- media@ecb.europa.eu.
Kopiointi on sallittu, kunhan lähde mainitaan.
Yhteystiedot medialle