
- Press release
- 3 July 2019
Euro area quarterly balance of payments and international investment position: first quarter of 2019
- The current account of the euro area recorded a surplus of €327 billion (2.8% of euro area GDP) in the four quarters to the first quarter of 2019, compared with a surplus of €371 billion (3.3% of euro area GDP) a year earlier.
- As regards geographic counterpartsin the four quarters to the first quarter of 2019 the euro area current account recorded its largest bilateral surpluses vis-à-vis the United Kingdom (€154 billion, down from €163 billion a year earlier) and the United States (€122 billion, up from €102 billion), while the largest bilateral deficit in the euro area current account was recorded vis-à-vis China (€67 billion, down from €75 billion).
- At the end of the first quarter of 2019 the international investment position of the euro area recorded net liabilities of €157 billion vis-à-vis the rest of the world (around 1% of euro area GDP), compared with net liabilities of €332 billion in the previous quarter.
Current account
The current account of the euro area recorded a surplus of €327 billion (2.8% of euro area GDP) in the four quarters to the first quarter of 2019, compared with a surplus of €371 billion (3.3% of euro area GDP) a year earlier (see Table 1). The decline in the current account surplus reflected a lower surplus for goods (declining from €322 billion to €281 billion) and a higher deficit for secondary income (increasing from €142 billion to €159 billion). These developments were partly offset by an increase in the surplus for primary income (from €83 billion to €96 billion), while the surplus for services remained at €109 billion.
The surplus for services remained stable owing to countervailing developments in its components. The surplus for telecommunication, computer and information services increased from €72 billion to €83 billion. This was offset by an increase in the deficit for other business services (from €10 billion to €15 billion) and declines in the surpluses for travel (from €42 billion to €39 billion) and insurance, pension and financial services (from €17 billion to €14 billion).
The increase in the primary income surplus was mainly due to increases in the surpluses for other primary income (from €11 billion to €20 billion) and investment income (from €56 billion to €62 billion). The developments in investment income mainly reflected larger surpluses for portfolio debt income (from €21 billion to €30 billion) and direct investment income (from €116 billion to €120 billion), which were partly offset by a larger deficit for portfolio equity income (from €93 billion to €99 billion).
Current account of the euro area
(EUR billions, unless otherwise indicated; transactions during the period; non-working day and non-seasonally adjusted)
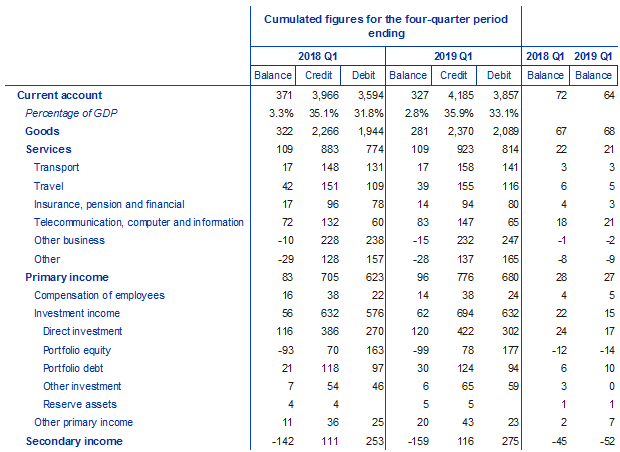
Source: ECB.Notes: “Equity” comprises equity and investment fund shares. Discrepancies between totals and their components may arise from rounding.
Data on the geographic counterparts of the euro area current account (see Chart 1) show that in the four quarters to the first quarter of 2019 the euro area recorded its largest bilateral surpluses vis-à-vis the United Kingdom (€154 billion, down from €163 billion a year earlier), the United States (€122 billion, up from €102 billion), a residual group of other countries (€82 billion, down from €141 billion) and Switzerland (€58 billion, up from €54 billion). The largest bilateral deficit in the euro area current account was recorded vis-à-vis China (€67 billion, down from €75 billion).
The most significant geographic changes in the goods balance in the four quarters to the first quarter of 2019 relative to the previous year were a shift from a surplus to a deficit vis-à-vis a residual group of other countries (from a surplus of €39 billion to a deficit of €35 billion), and an increase in the surplus vis-à-vis the United States (from €135 billion to €151 billion). In services, the deficit vis-à-vis offshore centres increased from €49 billion to €57 billion, while the surplus vis-à-vis Switzerland increased from €38 billion to €42 billion. Moreover, the primary income surplus vis-à-vis the United Kingdom declined from €16 billion to €1 billion, while the surplus vis-à-vis a residual group of other countries increased from €82 billion to €95 billion.
Geographical breakdown of the euro area current account balance
(Four-quarter moving sums in EUR billions; non-seasonally adjusted)
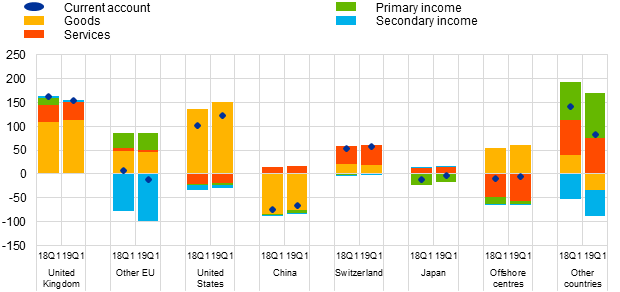
Source: ECB.Note: “Other EU” comprises EU Member States and EU institutions outside the euro area, excluding the United Kingdom.
International investment position
At the end of the first quarter of 2019 the international investment position of the euro area recorded net liabilities of €157 billion vis-à-vis the rest of the world (around 1% of euro area GDP), compared with net liabilities of €332 billion in the previous quarter (see Chart 2 and Table 2).
Net international investment position of the euro area
(Net outstanding amounts at end of period as a percentage of four-quarter moving sums of GDP)
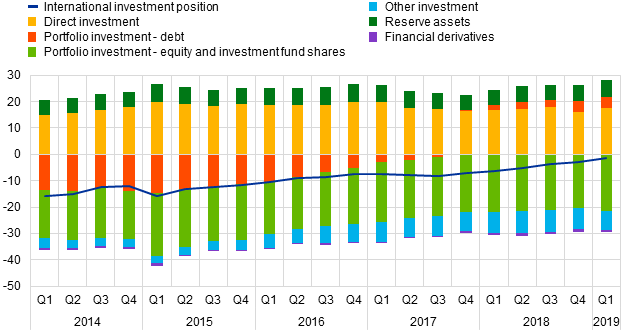
Source: ECB.
This improvement of €175 billion reflected higher net assets for direct investment (€2,050 billion, up from €1,866 billion) and portfolio debt (€482 billion, up from €474 billion), as well as lower net liabilities for other investment (€812 billion, down from €936 billion). These developments were partially offset by higher net liabilities for portfolio equity (€2,518 billion, up from €2,362 billion).
International investment position of the euro area
(EUR billions, unless otherwise indicated; amounts outstanding at the end of the period, flows during the period; non-working day and non-seasonally adjusted)

Source: ECB.Notes: “Equity” comprises equity and investment fund shares. Net financial derivatives are reported under assets. Discrepancies between totals and their components may arise from rounding.
The improvement in the euro area’s net international investment position in the first quarter of 2019 was driven mostly by net positive exchange rate changes and transactions (see Chart 3).
Net assets for direct investment increased on account of all components, namely positive transactions, net exchange rate and price revaluations and other volume changes (see Table 2), while the lower net liabilities for other investment resulted mainly from transactions. Net assets for portfolio debt increased on account of positive net exchange rate and price revaluations. The increase in net liabilities for portfolio equity stemmed mainly from negative net price revaluations.
At the end of the first quarter of 2019 the gross external debt of the euro area totalled €14.4 trillion (around 124% of euro area GDP), which represents an increase of €378 billion compared with the previous quarter.
Changes in the net international investment position of the euro area
(EUR billions; flows during the period)
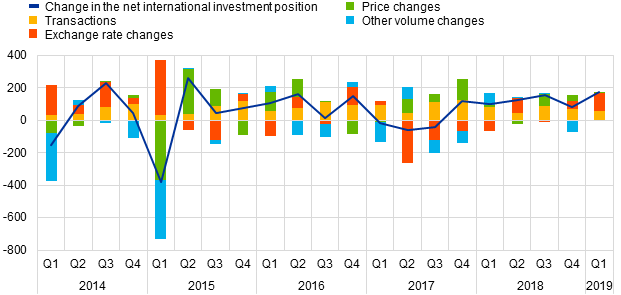
Source: ECB.Note: “Other volume changes” mainly reflect reclassifications and data enhancements.
Data revisions
This press release incorporates revisions to data for all four quarters of 2018. The revisions for direct investment and portfolio investment were particularly sizeable and reflect revised national contributions to euro area aggregates as a result of the incorporation of newly available information.
Next press releases
- Monthly balance of payments: 19 July 2019 (reference data up to May 2019)
- Quarterly balance of payments and international investment position: 2 October 2019 (reference data up to the second quarter of 2019)
For media queries, please contact Philippe Rispal, tel.: +49 69 1344 5482.
Notes
- All data are neither seasonally nor working day-adjusted. Ratios to GDP (including in the charts) refer to four-quarter sums of non-seasonally and non-working day-adjusted GDP figures.
- Hyperlinks in the press release refer to data that may change with subsequent releases as a result of revisions.
Euroopan keskuspankki
Viestinnän pääosasto
- Sonnemannstrasse 20
- 60314 Frankfurt am Main, Germany
- +49 69 1344 7455
- media@ecb.europa.eu.
Kopiointi on sallittu, kunhan lähde mainitaan.
Yhteystiedot medialle