


2026 update of the ECB’s Environmental Statement
Foreword

2025 was an encouraging reminder that steady action delivers real results and a milestone for the European Central Bank (ECB). Coinciding with the 15th anniversary of our environmental management system, we achieved a 46% reduction in CO2 emissions relative to 2019. In practical terms, this means we have already almost met our emissions reduction target for 2030 (46.2%) in full, in line with the 1.5° degrees Celsius goal set out in the Paris Agreement.
This progress is the result of consistent, practical choices to reduce the environmental impact of our day-to-day operations. We have been concentrating on two areas where the ECB can make a measurable difference: emissions from business travel and the energy efficiency of our workplaces. In 2025 we reduced the number of kilometres travelled by plane by around 40% compared with 2019, showing that virtual and hybrid meetings can support international cooperation while cutting emissions. We also continued our move to the Gallileo building – a modern, more sustainable workplace with better energy performance – as part of the plan to reduce the ECB’s footprint in Frankfurt from three buildings to two. Together, these steps have helped us stay on track to meet, and maintain, our Paris-aligned emissions reduction target. Beyond greenhouse gas emissions, we improved how we manage energy usage, materials and waste, biodiversity, procurement and staff awareness. The new educational nature trail on our premises is one example – and a visible reminder – of why biodiversity matters, demonstrating how we can all help protect our natural surroundings.
Looking ahead, the ECB will stay the course on climate and nature work. We will continue to improve how we identify and manage the risks that climate change and nature loss pose to the economy and the financial system. This includes analysing the transition to a greener economy, assessing the growing physical impacts of climate change (such as heatwaves and floods) and gaining a better understanding of the consequences of ecosystem degradation.
At a time when climate and sustainability efforts are being questioned in parts of the public debate, the ECB remains firmly committed to staying the course. This progress reflects the dedication of ECB staff to reducing our environmental footprint and meeting our Paris-aligned emissions reduction target. The 2026 update of the ECB’s Environmental Statement reaffirms our commitment to responsible environmental management. Yet, significant challenges remain; for example, further reducing emissions related to business travel and delivering long-term projects that may have a large environmental footprint. Even so, we are determined to keep on improving, to lead by example in our own operations and to play our part in bringing about a greener and more sustainable future for Europe and beyond.
Myriam Moufakkir
Chief Services Officer of the European Central Bank
1 The year in figures
Figure 1
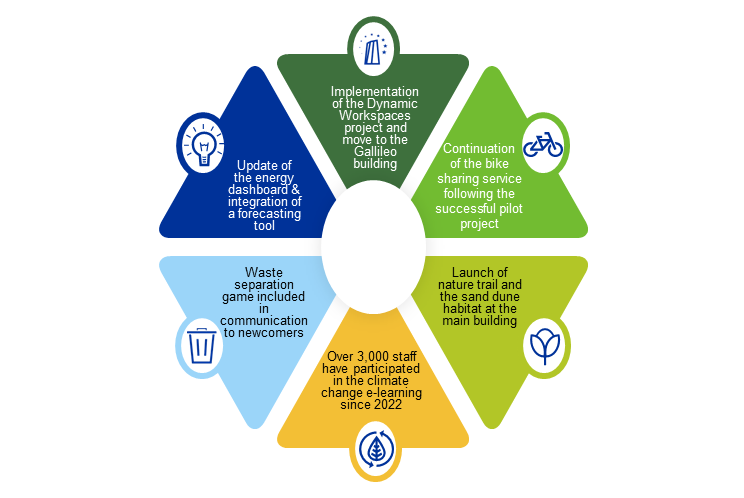
2025 highlights
Source: ECB.
Figure 2
2025 in figures
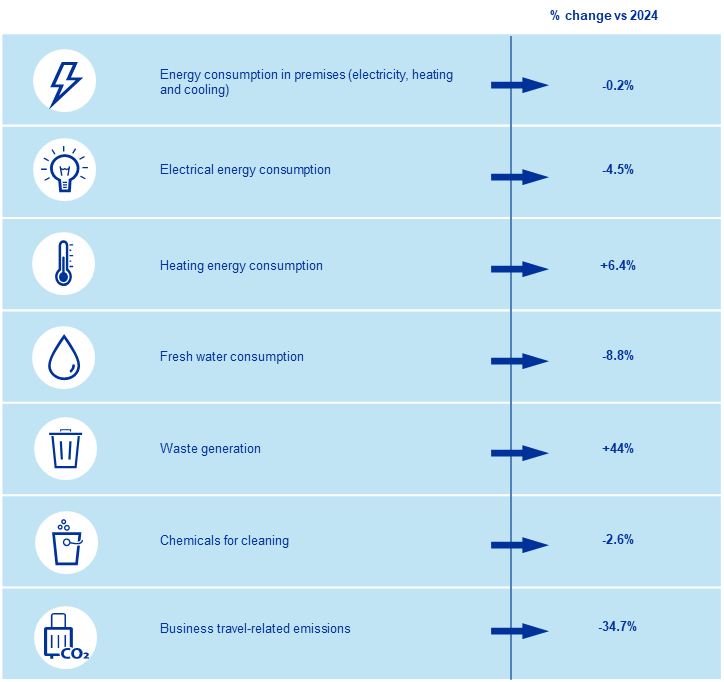
(2025 Percentage changes from 2024 to 2025)[1]
Source: ECB.
Notes: These developments are further described in Chapter 6 – Environmental aspects and impact of the ECB’s activities. Details on environmental data by workplace in 2024 are included in Chapter 7 – Technical information.
Notable improvements can be observed in certain activities in 2025 compared with 2024. For instance, electrical energy consumption and fresh water consumption decreased in 2025 compared with the previous year. Significant reductions in emissions related to business travel and travel by conference participants were also achieved, setting the ECB on a path to meet its target trajectory. Nevertheless, there were also increases – such as the rise in waste generation – which can be traced back to the refurbishments needed to implement the dynamic workspaces concept and the move to the Gallileo building.
2 Environmental management at the ECB
2.1 Organisational context

In 2025 the ECB continued its transition towards more dynamic work environments while preparing to relocate from the Eurotower to the Gallileo building in Frankfurt’s city centre. Following the relocation to the Gallileo building after the summer, all associated environmentally relevant activities are being evaluated and duly integrated into the environmental management system (EMS). Preparing for the move required close coordination with the new landlord, the building operator and future contractors to ensure a smooth transition, reliable building operations and the seamless integration of the new site into the existing EMS. Reporting on environmental performance (environmental indicators) is only possible after one full year of operations has been completed following the relocation. Thus, these indicators will be reflected in the 2027 update of the ECB’s Environmental Statement.
The carbon footprint decreased by 17.7% in 2025 relative to 2024, primarily owing to a significant reduction in business travel-related emissions resulting from updated emission factors and fewer kilometres travelled. The travel-related emissions from conference participants also decreased on account of significantly fewer participants and thus fewer kilometres travelled, as well as updated emission factors. These two emission sources will remain key focus areas as the ECB works towards further reducing its climate impact (see Chapter 3.2 – Indirect emissions).
The future development of the ECB’s EMS will continue to be shaped by changes in the organisational context, including emerging opportunities and risks as well as evolving stakeholder expectations. Material risks, particularly physical and transition risks, that could affect internal business operations need to be assessed as part of the EMS annual processes.
In addition to its internal activities, the ECB continues to address climate and nature-related issues relevant to its mandate.
Climate change and the degradation of nature, as well as the transition to a carbon-neutral society, pose risks to the economy and the financial system. Identifying and addressing these risks is essential for the ECB to fulfil its mandate. The ECB Annual Report and the ECB Annual Report on supervisory activities detail the activities carried out in 2025. Since 2023 the ECB and Eurosystem national central banks (NCBs) have also published annual climate-related financial disclosures, covering the financial assets held in portfolios for monetary policy purposes, as well as in non-monetary policy portfolios. Additional publications are made available on the ECB website on a rolling basis throughout the year.
Over the past two years the ECB has further embedded climate and nature-related risks into its core work by concluding its climate and nature plan 2024-2025. Relevant actions include strengthened integration into the monetary policy framework, climate stress testing and scenario analysis, updated statistical climate indicators, increased understanding of nature-related risks and binding decisions in its role as banking supervisor. The reduced emissions from the ECB’s own operations were also a part of this work.
The economic and financial consequences of climate change and nature degradation continue to grow. The ECB therefore remains firmly committed to embedding climate and nature into its work, ensuring resilience to rising physical risks and transition challenges. Building on the progress made, in the coming years the ECB will continue its efforts in three priority areas: navigating the green transition; assessing and taking into account the increased physical impact of climate change; and advancing work on nature-related risks.
2.2 Overview of the environmental management system

The 2026 update of ECB’s Environmental Statement presents environmental data on the three ECB premises covered by the EMS in 2025. These are the ECB-owned main building and the two rented facilities in Frankfurt’s city centre – the Eurotower and the Japan Center. Following the relocation to the Gallileo building, the ECB will begin reporting environmental data for the new premises; however, the Eurotower will continue to be included in the reporting until three full years of environmental data have been collected for the Gallileo building, in line with the European Union’s Eco-Management and Audit Scheme (EMAS) requirements.
The data for the main building are presented separately from the aggregated data for the city centre premises. All office space across these three buildings is fully occupied by the ECB.
In line with the three-year reporting cycle of the European Union’s EMAS standard, this year’s Environmental Statement is the first update of the ECB Environmental Statement 2025, and as such this publication is only complete when read together with the 2025 publication.
The ECB’s environmental policy sets out its overarching environmental objectives and strategic direction. Information on the ECB’s environmental policy, the governance of its EMS and key stakeholders is outlined in the 2025 publication and on the webpage on environmental protection at the ECB.
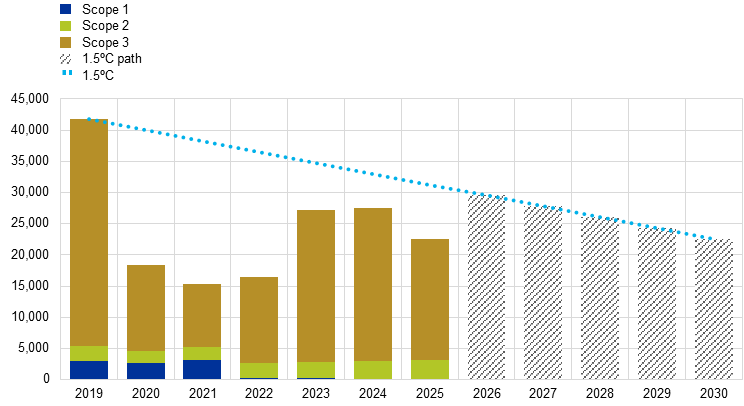
The objective of continuous improvement set out in the EMS was achieved in 2025, as demonstrated by the implementation of new measures. Overall, environmental performance improved considerably relative to the baseline year 2019. The ECB’s operational carbon footprint remains well below the linear decarbonisation path, meaning that it is well on track to meet its Paris-aligned target of a 46.2% reduction in carbon emissions by 2030.
For further information on the ECB’s operational carbon performance, see Chapter 3 – The ECB’s carbon footprint.
3 The ECB’s carbon footprint
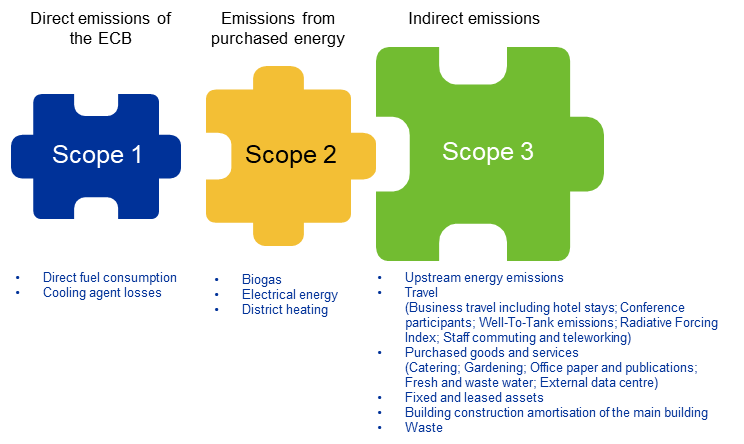
The ECB classifies its emissions in alignment with the Greenhouse Gas Protocol framework. As such, scope 1 emissions include direct emissions from the ECB’s premises while scope 2 and scope 3 emissions entail indirect emissions from the ECB’s operations. Compared with 2024, there have been no changes to the scope of the greenhouse gas inventory. Figure 3 provides an overview of the components of the ECB’s carbon footprint sorted by the respective scopes.
Figure 3
Components of the ECB’s carbon footprint
Source: ECB.
Figure 4
CO2e emissions objectives
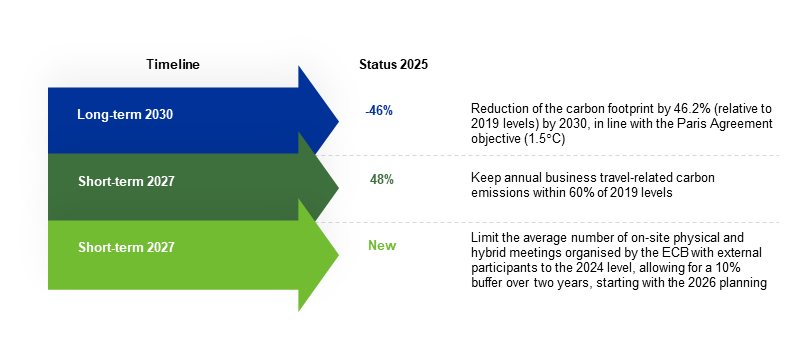
Figure 5
CO2e emissions measures – highlights
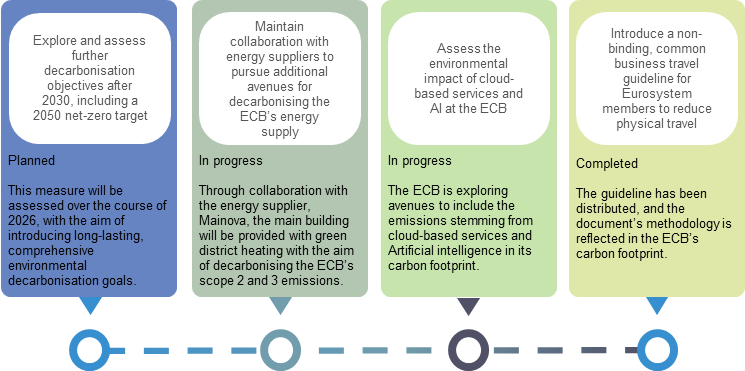
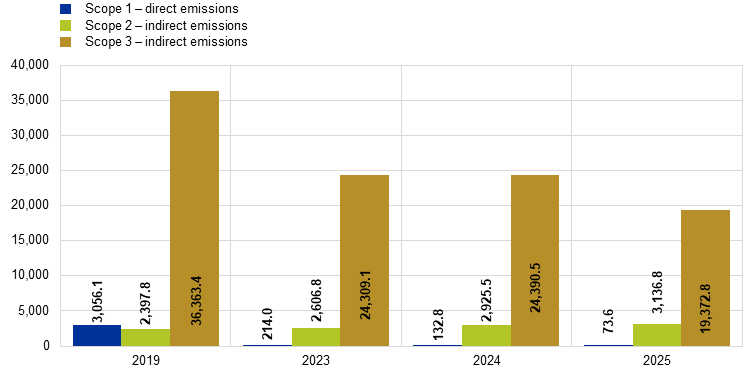
Total emissions saw a significant decrease of 17.7% compared with 2024. While scope 1 emissions continued to decline in 2025 (-45%), mainly owing to the progressive electrification of the ECB’s car fleet, scope 2 emissions increased by 7.2% as a result of increased heating consumption across all three buildings. Scope 3 emissions decreased in 2025 (-21%) and continue to be strongly influenced by emissions related to business travel and travel by conference participants. For updates on all CO2e emission measures see Chapter 7.2 – Emissions reduction measures.
Chart 2
Total CO2e emissions – scopes 1, 2 and 3
(tonnes CO2 equivalent)
Source: ECB.
Notes: Scope 3 values were revised from 14,004.3 to 14,022.3 tonnes of CO2e for 2022 and from 22,609.3 to 22,956.6 tonnes of CO2e for 2023. Results are depicted for 2019, as this is the baseline year for the ECB’s long-term emissions reduction objectives, and for the last three years for which data are available. For earlier results, see previous environmental statements. Cooling agents were replaced in 2024 with an alternative with a lower global warming potential to further support the emissions reduction.
The ECB focuses on avoidance of emissions, followed by their reduction. As the third and final component of its emission management, since 2018 the ECB has fully compensated unavoidable emissions with credits that finance emission avoidance projects worldwide. In addition, suppliers already compensate for upstream emissions from train travel within Germany and a share of office paper[2].
For further information on data, see Chapter 5 – Technical information.
3.1 Emissions related to the operation of the ECB’s premises
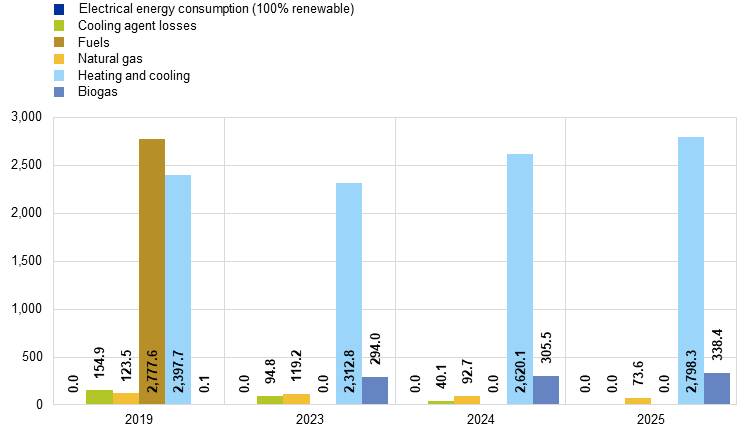
The ECB reports the emissions from the operation of its own premises as direct emissions under scope 1 and as indirect emissions under scope 2. This includes emissions from heating and cooling, fuel use and cooling agent losses. In 2025 scope 1 and scope 2 accounted for 14% of the ECB’s carbon footprint. In this chapter, scope 2 emissions are reported using the market-based approach. Scope 2 emissions using the location-based approach are reported in Chapter 5 – Technical information.
Upstream emissions from the ECB’s energy consumption are included under scope 3 (see Chapter 3.2 – Indirect emissions).
Chart 3
CO2e emissions – scopes 1 and 2
(tonnes of CO2 equivalent)
Source: ECB.
Notes: Biogas values were revised from 3.9 to 294.0 tonnes of CO2e for 2023 and from 2.5 to 305.5 tonnes of CO2e for 2024. Results are depicted for 2019, as this is the baseline year for the ECB’s long-term emissions reduction objectives, and for the last three years for which data are available. For earlier results, see previous environmental statements.
3.2 Indirect emissions
Current indirect emissions reported under scope 3 accounted for 86% of the ECB’s total carbon footprint in 2025. For more information on underlying developments behind the changes to scope 3 emissions, see Chapter 4 – Environmental aspects and impacts of the ECB’s activities.
3.2.1 Business travel and hotel stays
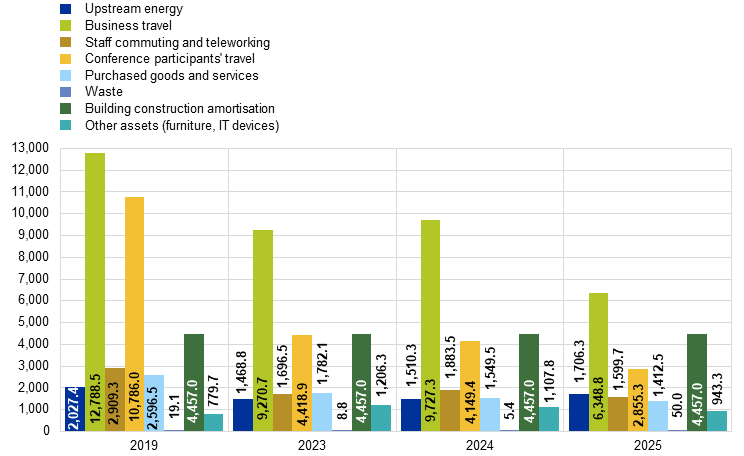
Business travel emissions decreased by 37.2% relative to 2024, while emissions arising from hotel stays rose by 11.3%. Despite this increase, in 2025 the ECB operated at 50.4% below its 2019 travel emissions levels. As such, the objective of limiting annual travel-related CO2 equivalent (CO2e) emissions to a maximum of 60% of pre-pandemic levels has been met, with current levels standing at 48%. The significant reduction in emissions in 2025 relative to 2024 was largely the result of a decrease in flight emission factors. For more information on this development, see Chapter 4.9 – Travel.
Business travel-related emissions remain a key focus for the ECB, with efforts directed at reducing emissions to meet the set target. To support this work, the travel dashboard has been made available to all ECB staff to monitor travel-related emissions in all business areas and to identify key areas of action. Furthermore, the dashboard was expanded in 2025 to include information on hotel-related emissions.
Emission calculations follow a best practice approach, using Well-to-Tank (WTT) emissions for all fossil fuel-based transport and applying the Radiative Forcing Index (RFI) for air travel[3][4]. By adopting these approaches, the ECB ensures a comprehensive and accurate assessment of travel-related emissions using a best practice approach. For further details on travel activities, see Chapter 4.9 – Travel.
3.2.2 Conference participants’ travel
Emissions from conference participants’ travel have decreased by 31.2% in 2025 compared with 2024.
The ECB monitors developments in conference participants’ travel patterns closely and has set an objective in the EMP 2025-27.
The ECB reports on the business travel emissions of its own staff as well as the travel-related emissions from external participants attending conferences and events held at ECB premises. Although the ECB’s influence on emissions stemming from conference participants is limited, the ECB acknowledges its importance and has been reporting on the travel behaviour of conference participants since 2021. The same method is applied to calculate travel emissions related to conference participants as for the business travel emissions of the ECB’s own staff, i.e. applying RFI-factors for plane travel and calculating WTT emissions for fuel-based transport.
The decrease in travel-related emissions from conference participants in 2025 can be explained by a lower number of conference participants compared with the previous year. The overall reduction in the number of participants led to a decrease in overall kilometres travelled, which influences travel-related emissions. Additionally, there were reductions in the emission factors used to calculate the emissions in 2025. For further information on developments related to emission factors, see Chapter 5 – Technical information.
The ECB is aware that the calculation of travel-related emissions from conference participants is reliant on certain assumptions which limit the overall data quality. These emissions are monitored closely and have been identified as a key topic in the Environmental Management Programme (EMP) 2025-27 once again, setting an objective for the number of physical and hybrid meetings organised by the ECB. For further details and data developments, see Chapter 4.9 – Travel.
3.2.3 Staff commuting and teleworking
Emissions from staff commuting have decreased by 25.2% in 2025 compared with 2024, totalling 1,176 tonnes of CO2e emissions.
Emissions from teleworking have increased by 36.4% in 2025 compared with 2024, reaching 424 tonnes of CO2e emissions.
The teleworking regime introduced in 2023 allows ECB employees to work up to 110 days remotely. As a result, a share of the ECB’s emissions has shifted to employees’ homes. As staff commuting and teleworking are intercorrelated aspects, the ECB summarises these emissions in the carbon footprint under the category “Emissions from staff commuting and teleworking data”. To accurately monitor emissions from staff commuting, the ECB conducts a staff survey every two years. The most recent survey was carried out in the summer of 2025.
The decrease in emissions from staff commuting can be explained by a shift in the mode of transport observed in the latest staff survey. In 2025 more employees travelled to the ECB premises by public transport while fewer used their private car for commuting. This influenced the overall emissions from staff commuting in 2025. The increase in emissions from teleworking can be explained by changes to the underlying emission factors for heating and cooling as well as changes in the responses of survey participants about their energy usage. The ECB acknowledges the limited reliability of the teleworking and commuting emission data, which are based on underlying assumptions and a survey-based approach.
To promote green mobility among its staff, the ECB launched a programme that offers free access to the first hour of a bicycle-sharing service. Since this offer is valid in several German cities, it encourages green mobility beyond commuting for work. For further information on the survey-based approach for emissions data, see Chapter 4.9 – Travel.
3.2.4 Waste
The implementation of dynamic workspaces and the move from the Eurotower to the Gallileo building at the end of the year led to an increase in waste generation and waste-related emissions in 2025 compared with the previous year. Overall waste generation was eight times higher in 2025 than in 2024. This was strongly influenced by a change in emission factors for household residual waste which led to a significant increase in emissions from this specific source.[5]
The ECB is aware of this development and is monitoring it closely. The EMP objective for waste accounts for a temporary increase in waste generation and waste-related emissions from household residual waste resulting from the move and the implementation of dynamic workspaces. For further information, see Chapter 4.5 – Waste and recycling.
3.2.5 Purchased goods and services
Emissions from purchased goods and services decreased by 8.8% in 2025 compared with 2024 and represent 11.4% of all scope 3 emissions.
As part of emissions from purchased goods and services, emissions from office supplies and stationery more than doubled compared with 2024.
Emissions from consumption at the external data centre space decreased by 7% in 2025 compared with 2024.
The ECB reports on emissions arising from purchased goods and services. These include emissions from catering and cleaning services, ICT services, office supplies and stationery, external printing, paper consumption for office purposes, ECB publications and other printed materials, gardening services, fresh and waste water consumption, as well as consumption at the external data centre.
Emissions from catering services comprise emissions from ingredients over their full lifecycle. Emissions from ICT services include videoconferences conducted by ECB staff. To estimate the impact of office supplies, stationery and cleaning services, a value-based approach is used to calculate the emissions from these areas, given the lack of detailed consumption data and sufficient emission factors. Emissions related to gardening services include fuel consumption for maintenance work.
The increase in emissions from office supplies and stationery is the result of estimating these emissions following a value-based approach, and because prices for items were updated over the course of 2025.
Chart 4
CO2e emissions – scope 3
(tonnes CO2 equivalent)
Source: ECB.
Notes: Bars match the order listed in the legend (Left to right, top to bottom). Business travel values were revised from 8,731.3 to 9,270.7 tonnes of CO2e for 2023 and from 9,134.5 to 9,727.3 tonnes of CO2e for 2024. Upstream energy values were revised from 655.8 to 1,468.8 tonnes of CO2e for 2023 and from 384.7 to 1,706.3 tonnes of CO2e for 2024. Upstream energy includes emissions from the car fleet, the emergency unit, biogas and district heating, as well as electricity from renewable energy sources (wind and hydropower). Results are depicted for 2019, as this is the baseline year for the ECB’s long-term emissions reduction objectives, and for the last three years for which data are available. For earlier results, see previous environmental statements.
Chart 5
Scope 3 – shares of CO2e emissions in 2025

Source: ECB.
Aside from CO2e emissions, the ECB records and calculates other emissions generated by its activities. Thus, emissions of sulphur dioxide (SO2), nitrogen oxides (NOx) and particulate matter (PM) from the fuel consumption of the ECB’s vehicle fleet and emergency power unit test runs are reported. In contrast to the previous year, the upstream emissions from these sources are reported in the carbon footprint. In addition, the ECB reports on biogenic emissions resulting from biogas consumption in line with the requirements of the Greenhouse Gas Protocol. For more information, see Chapter 5 – Technical information.
4 Environmental aspects and impact of the ECB’s activities
4.1 Update of the environmental aspects assessment
The ECB's direct and indirect environmental impacts are assessed annually, taking into account the organisation's ability to influence each impact and its importance for the ECB’s environmental performance, also in line with the requirements laid out in Annex I, No. 4 of EMAS.
The ECB works to better understand how climate change, nature degradation and the transition to a carbon-neutral society pose risks to the economy and the financial system, with respect to how this affects its mandate to maintain price stability and its role as supervisor. Over the past years, progress has been made to include these considerations in the conduct of tasks and duties that the ECB together with the National Central Banks as part of the European System of Central Banks (ESCB) have been entrusted with.
The objectives of and the activities carried out by the ECB, as well as the ESCB/Eurosystem and the Single Supervisory Mechanism (SSM), are publicly available on the ECB’s website and described in the ECB Annual Report and the ECB Annual Report on supervisory activities. They encompass ongoing work to embed climate and nature-related risks assessments into ECB’s activities and focused efforts in three priority areas: navigating the green transition; assessing and taking into account the increased physical impact of climate change; and advancing work on nature-related risks.
Some of these activities take place beyond the ECB’s EMS perimeter and are conducted via the ESCB/Eurosystem committees, the SSM, and the related decision-making bodies. In virtue of this, and in accordance with the principle of independence,[6] the ECB’s EMS focuses on the day-to-day operations, including those that support the fulfilment of its mandated tasks, and in close synergy with the ECB climate and nature strategy. This is ensured via continued exchanges between the environmental management team and the ECB climate change centre, as well via reporting to the ECB decision making bodies.
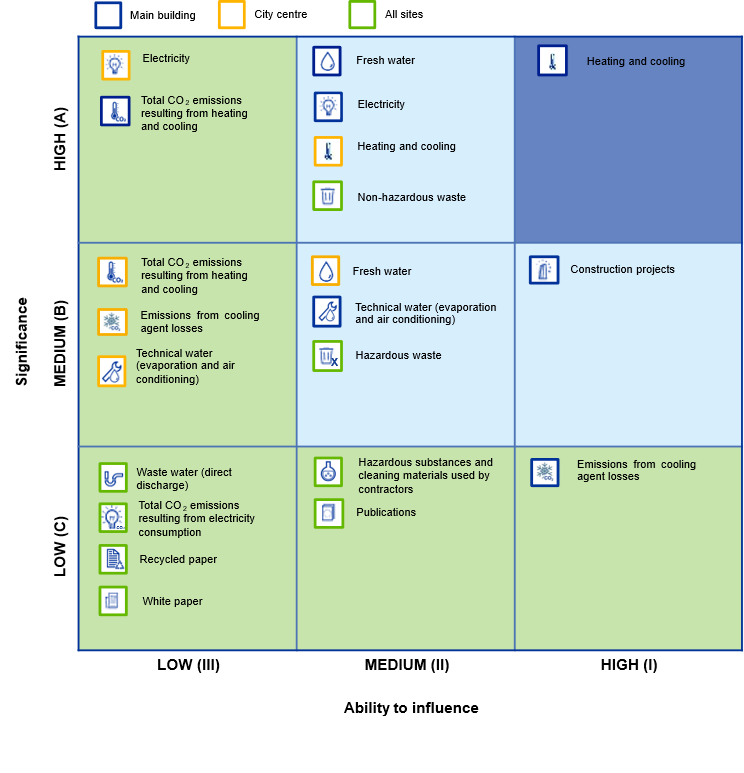
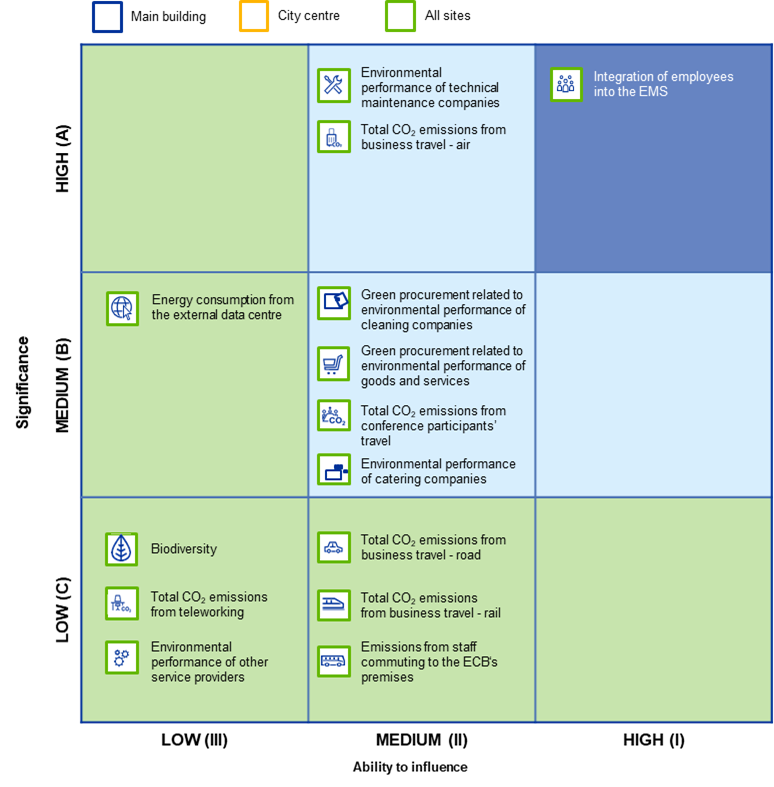
The ratings for 2025 remained stable compared with the environmental aspects assessment for 2024, with the exception of waste and technical fresh water. As a result of the preparations for the move to the Gallileo building and the implementation of the dynamic workspaces concept, non-hazardous waste increased by 40.6% and hazardous waste generation more than doubled in all premises. Therefore, the classification of non-hazardous waste shifted from medium to high significance, while hazardous waste increased from low to medium significance. Both these developments are expected to be tied to the move and the dynamic workspaces concept and thus only influence the environmental aspects assessment temporarily. The significance level of technical water shifted from high to medium, given that technical water consumption in the Eurotower decreased by 68%. As technical water is also classified as having a medium significance level in the Japan Center, the environmental aspect was classified as medium for the city centre buildings.
Figure 6
Assessment of the ECB’s direct environmental aspects
Source: ECB.
Notes: The significance level of non-hazardous waste shifted from medium to high as a result of the increased waste generation stemming from the move to the Gallileo building and the implementation of the dynamic workspaces concept. Similarly, the significance level of hazardous waste shifted from low to medium for the same reasons. The significance level of technical water at the city centre premises changed from high to medium.
Figure 7
Assessment of the ECB’s indirect environmental aspects
Source: ECB.

4.2 Energy efficiency
Figure 8
Energy efficiency objectives
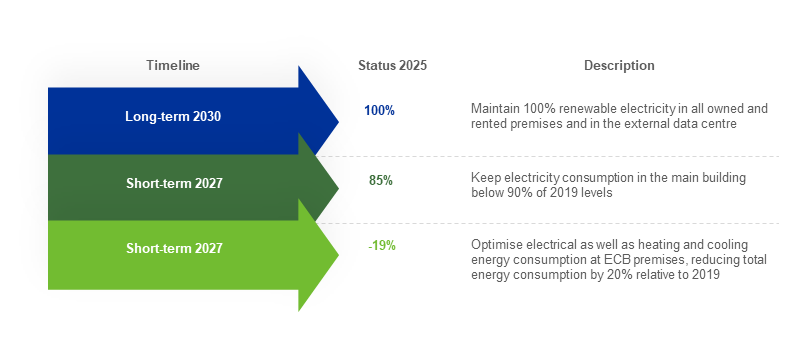
Figure 9
Energy efficiency measures – highlights
Energy consumption in all premises decreased by 0.2% in 2025 compared with 2024 while heating energy consumption increased by 6.4%.
At the main building, electrical energy consumption decreased by 5% in 2025.
In addition to procured energy, a small amount of heating is provided by geothermal energy.
Total electricity consumption in 2025: 28,785 MWh
Total heating consumption in 2025: 21,143 MWh
The ECB’s overall energy consumption decreased by 0.2% in 2025 compared with the previous year and was 18.9% lower than in 2019.
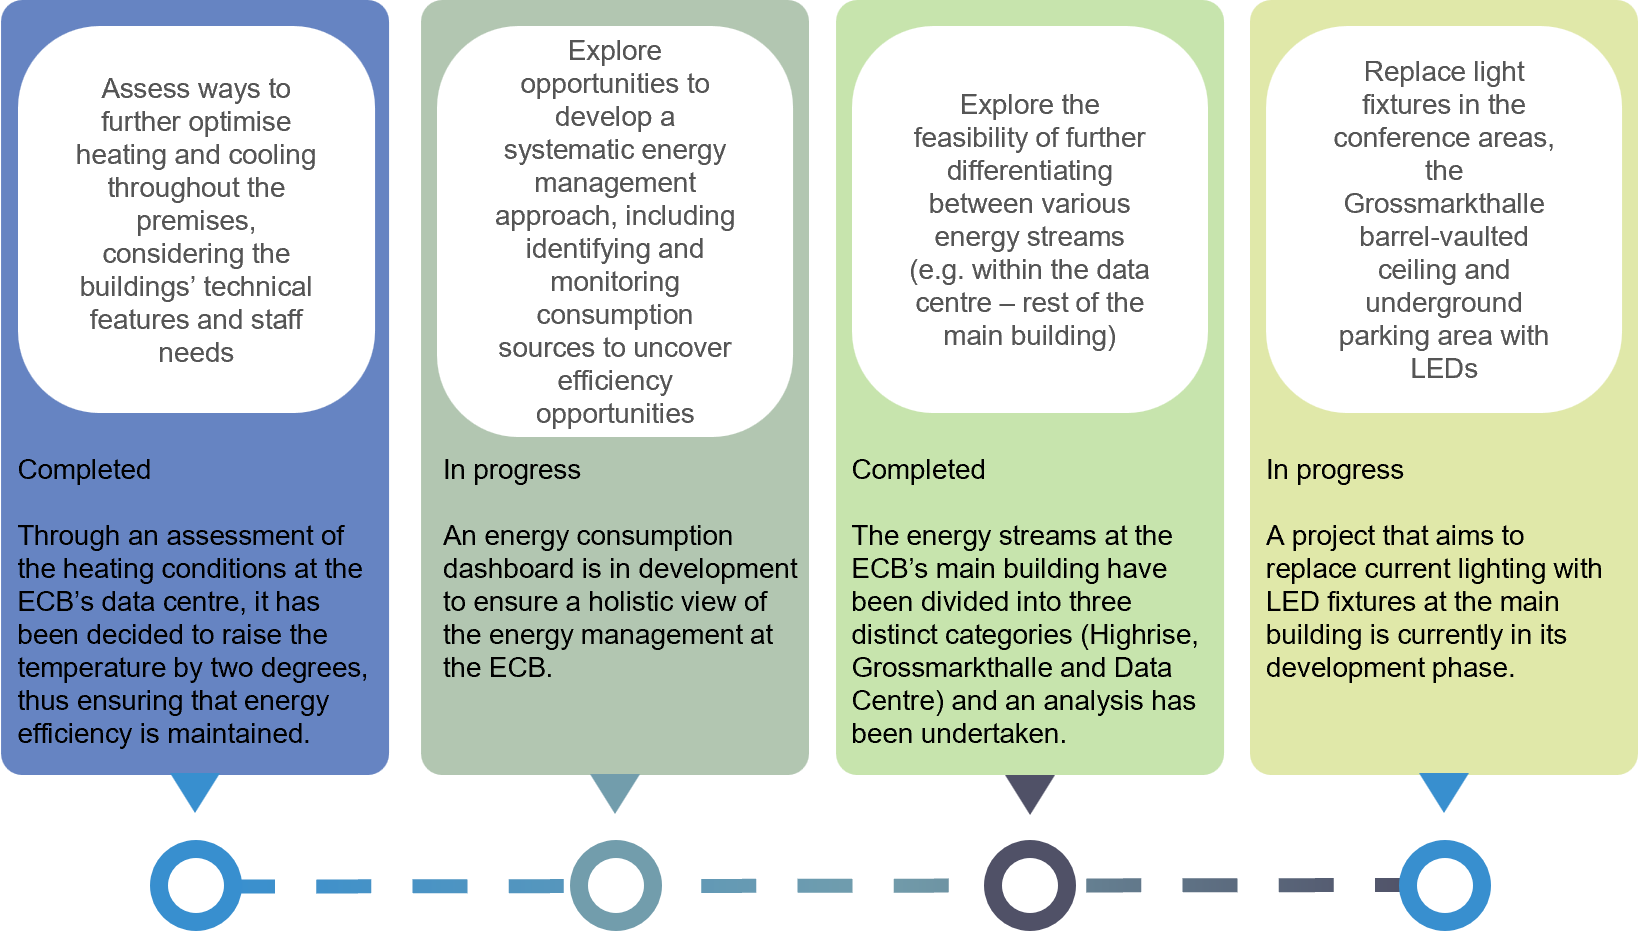
Increasing energy efficiency in all three premises continues to be a priority for the ECB. As such, the ECB is continuously working on identifying and implementing new measures. In 2025 the temperature in the data centre was increased by an additional two degrees after a successful testing period. The development of an energy dashboard represents a substantial pillar in the ECB’s efforts to increase energy efficiency. The energy dashboard is being constantly improved, and the ECB has placed particular emphasis on the overall development of the dashboard in the EMP 2025-27 cycle. By improving the dashboard, more granular data will be available in the future, which will help to identify promising areas for energy saving measures. For updates on all energy efficiency measures see Chapter 7.3 – Energy efficiency measures.
Changes in the working environment at the ECB are continuously assessed. As such, the ECB monitors its utilisation of cloud services and artificial intelligence and works closely with a multitude of stakeholders to assess and quantify the environmental impact of these services. The availability of teleworking and the associated utilisation of office space through new working models is evaluated as well. With the implementation of the dynamic workspaces concept, office space at the buildings has been allocated differently, allowing for space to be used more efficiently.

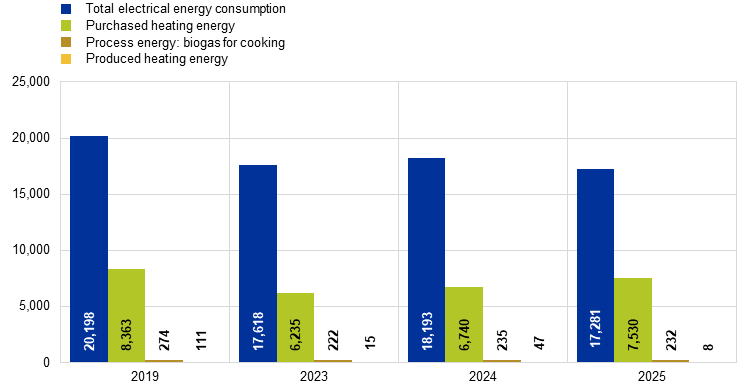
Electrical energy consumption in the main building decreased by 3.5% in 2025, while energy consumption for heating rose by 11.7% compared with the previous year. The amount of biogas used for cooking in the kitchen of the main building also decreased by 1.2%. By contrast, the stepwise migration to cloud services has led to a gradual reduction in electricity consumption in the internal data centre.

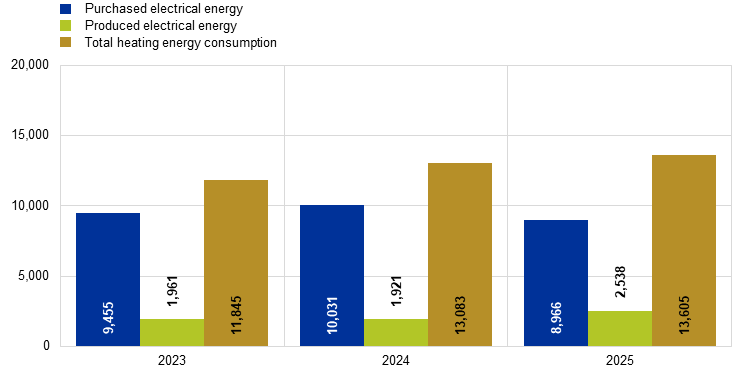
At the city centre premises, electrical energy consumption decreased by 3.7% in 2025. The consumption of energy for heating rose by 32.1%, which was partially explained by the bleeding of the radiators throughout the Japan Center, leading to more units being brought back into service. In addition to procured energy, two cogeneration plants powered by biogas are used in the Eurotower to generate heat and electrical energy. In 2025 the consumption of biogas increased by 11.1% compared with 2024. In comparison with previous years, an increase in generated energy was observed following changes in the run times of both cogeneration plants.
Chart 6
Energy consumption – main building
(MWh)
Source: ECB.
Notes: Results are depicted for 2019, as this is the baseline year for the ECB’s long-term emissions reduction objectives, and for the last three years for which data are available. For earlier results, see previous environmental statements. For geothermal energy, it is necessary to keep the source (namely the ground) in balance, taking into account a full annual cycle (summer = cooling energy/heating up the source; winter = heating energy/cooling down the source). In 2022 the heating energy saving activities led to a significant imbalance in the source. The Frankfurt city authority (Environmental Office) decided that the system should remain out of operation in 2023 to allow for the thermal regeneration of the source. In 2024 the system was recommissioned. However, it should be noted that approximately only one-quarter of the geothermal energy consumed in 2022 was used in 2024.
Chart 7
Energy consumption – city centre buildings
(MWh)
Source: ECB.
Notes: Energy consumption at the external data centre is no longer included in this chart, as the related emissions have been allocated to “purchased goods and services” as part of the expansion of scope 3. For more information, see Chapter 3.2 – Indirect emissions. Results are depicted for 2019, as this is the baseline year for the ECB’s long-term emissions reduction objectives, and for the last three years for which data are available. For earlier results, see previous environmental statements. For more information on greenhouse gas emissions associated with energy consumption, see Chapter 3.1 – Emissions related to the operation of ECB premises.
4.3 Material efficiency
Figure 9
Material efficiency objectives
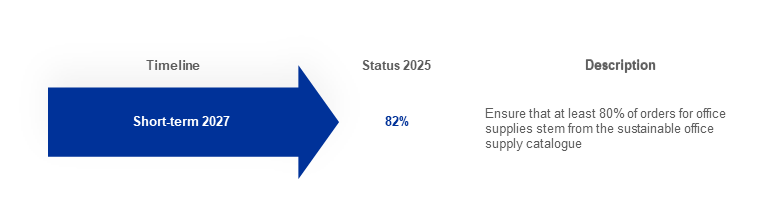
Figure 10
Material efficiency measures – highlights
Office paper consumption decreased by 78%, with recycled paper accounting for 97.2% of total purchases.
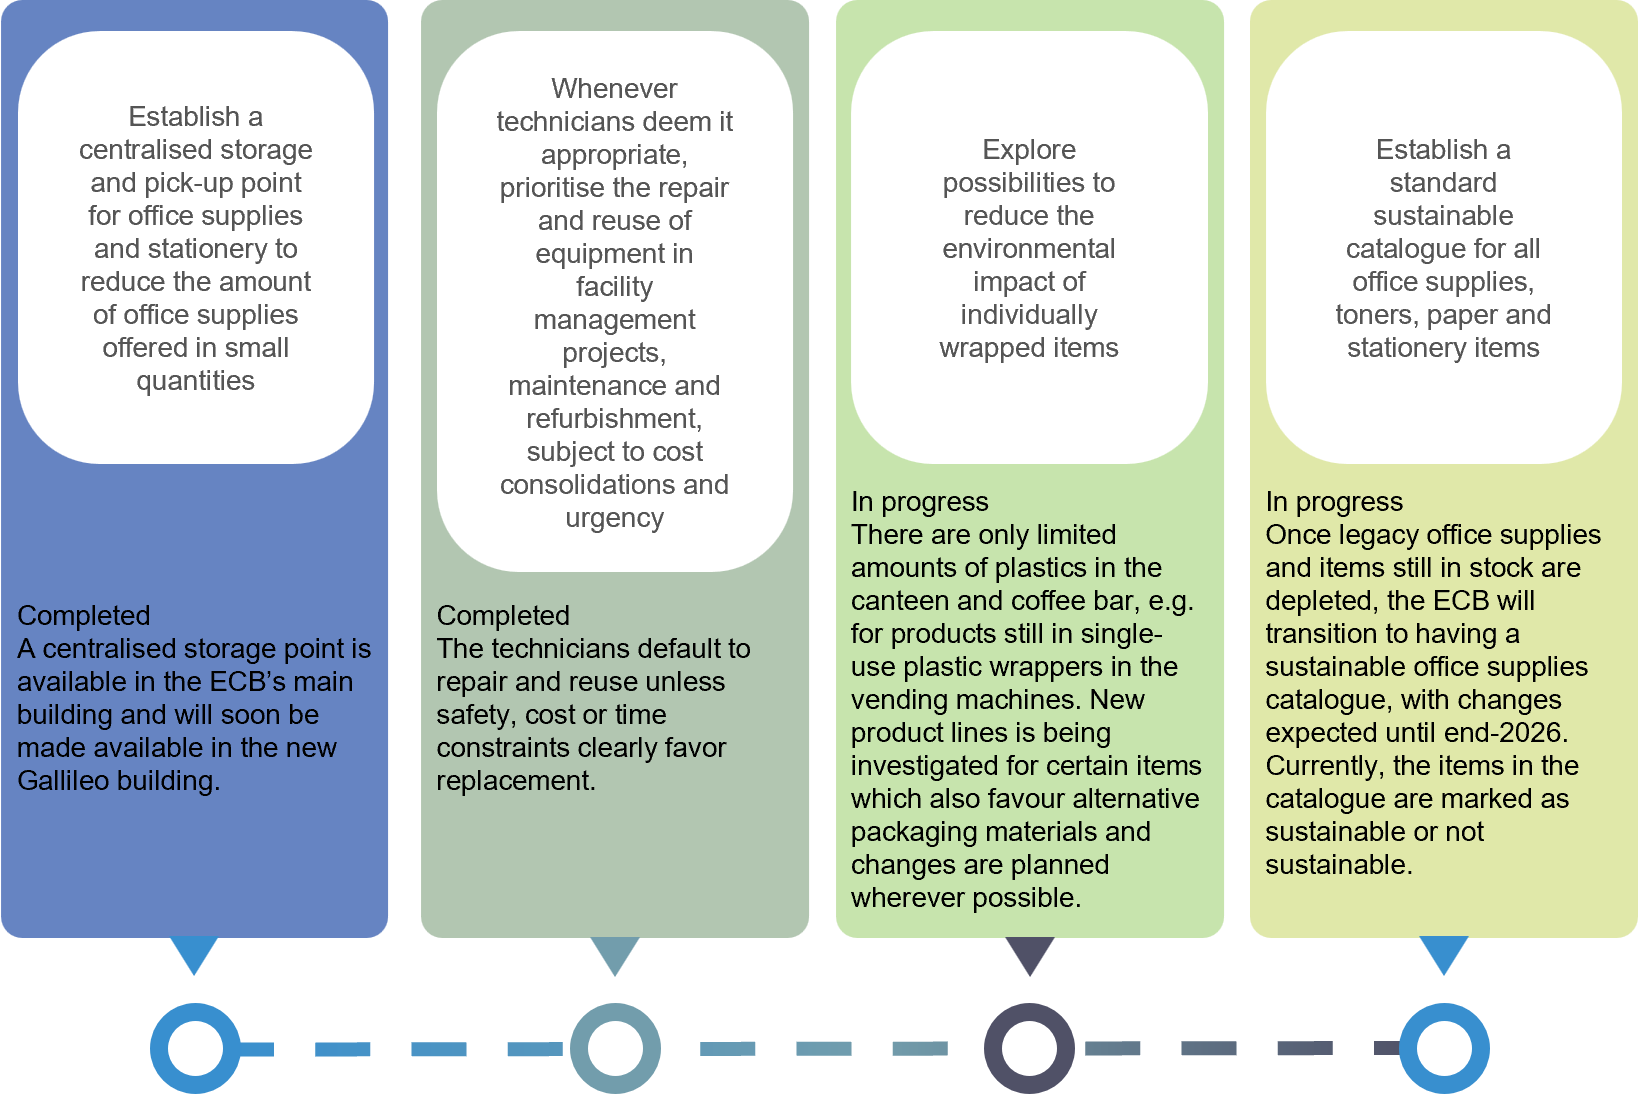
The share of eco-friendly stationery items in the catalogue reached 81.8% in the second half of the year.
The use of non-hazardous cleaning agents declined by 65.7%, reflecting ongoing efforts to reduce chemicals in cleaning processes.
The continuous reduction of packaging waste in its own operations remains a priority for the ECB. As such, the ECB continues to work on eliminating single-use plastic items in customer-facing outlets in close collaboration with its external service providers. The ECB favours more environmentally sustainable and reusable packaging solutions wherever possible.
Office supplies are another critical aspect of material efficiency at the ECB. With the goal of procuring at least 80% of orders for office supplies from the sustainable office supply catalogue, the ECB ensures that environmental considerations are at the centre of the procurement of office supplies.
The following sections provide an overview of resource consumption for office paper, cleaning agents, office supplies, chemicals for water treatment and cooling agents. Chapter 3.2 – Indirect emissions presents details on the CO2e emissions of these resources. For updates on all material efficiency measures see Chapter 7.3 – Material efficiency measures.
4.3.1 Office paper and official publications
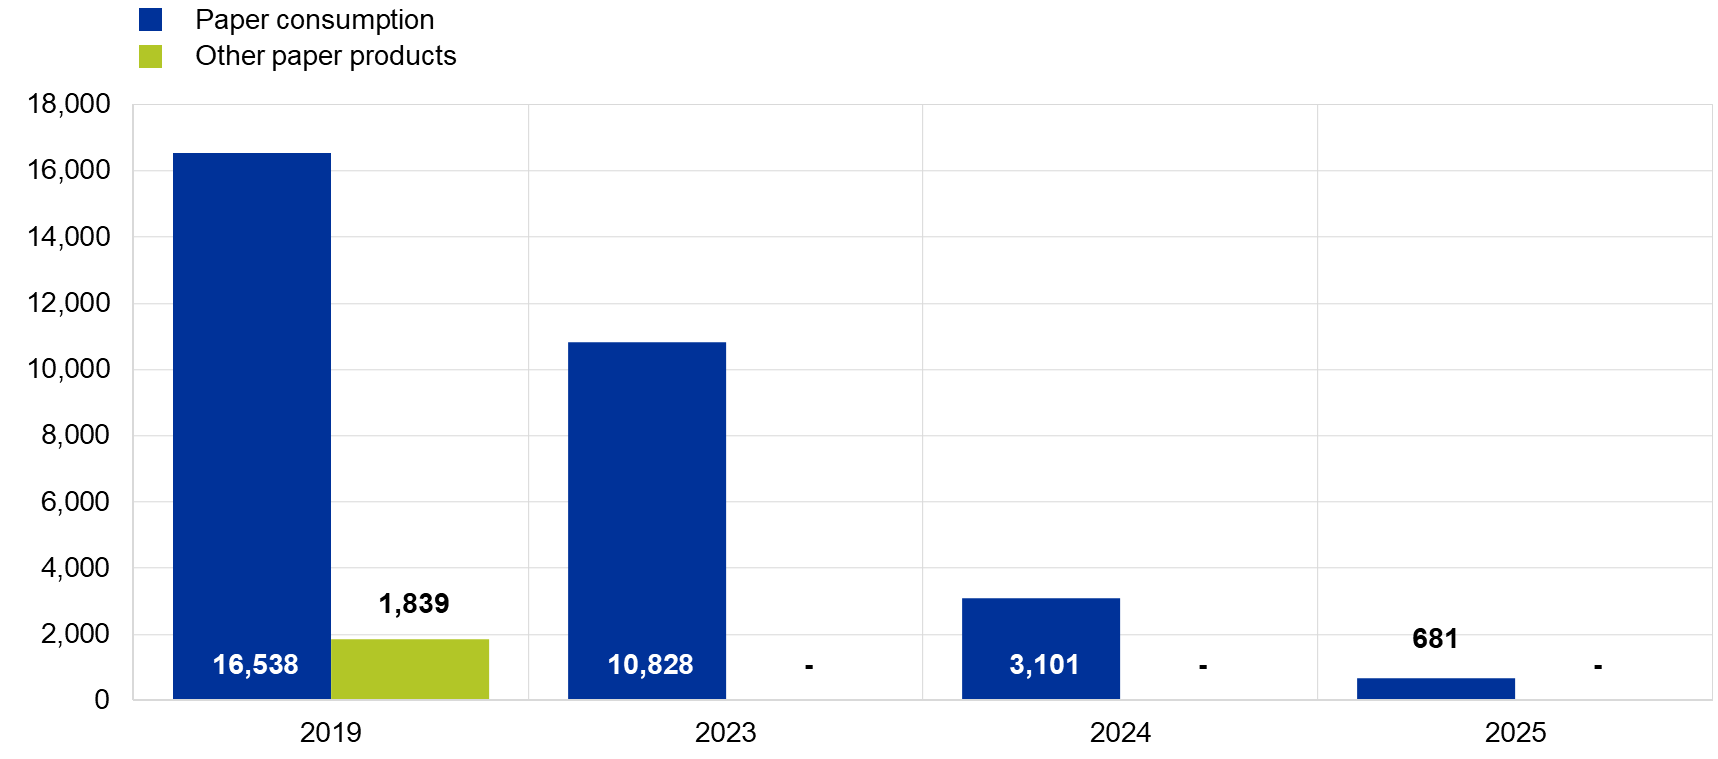
Office paper consumption has steadily decreased over the past years, declining by 78% in 2025 compared with 2024. As larger quantities of recycled office paper were still in stock, only small quantities had to be ordered. Recycled paper accounted for 97.2% of total purchases in 2025. As in previous years, the ECB calendars were printed on-site.
ECB’s official publications continue to be produced exclusively in digital format, resulting in no recorded paper consumption for official publications.
Chart 8
Office paper consumption
(thousands of sheets of A4 equivalent)
Source: ECB.
Notes: Results are depicted for 2019, as this is the baseline year for the ECB’s long-term emissions reduction objectives, and for the last three years for which data are available. For earlier results, see previous environmental statements.
4.3.2 Cleaning agents

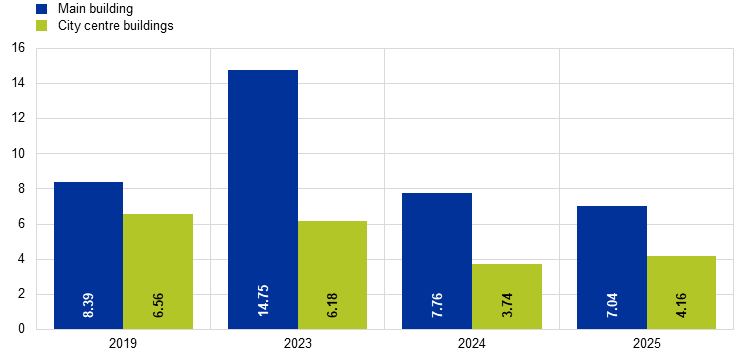
The use of non-hazardous cleaning agents for all cleaning activities in all buildings decreased by 65.7% in 2025 compared with 2024.
For catering operations at the main building, the use of non-hazardous cleaning agents increased by 3.8% compared with 2024. The use of hazardous cleaning agents decreased by 2.5%.
For catering operations at the city centre buildings, non-hazardous cleaning agents use decreased by 14.5% while the use of hazardous cleaning agents decreased by 23.9%.
A non-chemical cleaning system is implemented at the ECB for regular cleaning activities in all buildings, using microbiological detergents, aqueous ozone and mechanical cleaning techniques. The ECB continues to implement the established measures and is constantly looking for ways to further reduce the consumption of cleaning agents in all buildings.
As in previous years, the catering operation in all three buildings was conducted by an external service provider. Given that the same service provider is responsible for all three buildings, cleaning processes are streamlined. The decrease in hazardous cleaning agents in the city centre buildings can be attributed to the optimisation of dosage systems. The opening of the pop-up restaurant at the Japan Center after the closure of the Eurotower further influenced consumption.
Chart 9
Cleaning agent consumption
(tonnes)
Source: ECB.
Notes: Results are depicted for 2019, as this is the baseline year for the ECB’s long-term emissions reduction objectives, and for the last three years for which data are available. For earlier results, see previous environmental statements.
4.3.3 Office supplies

To encourage sustainable office supply choices, the ECB highlights eco-labelled items within its stationery catalogue and analyses the share of eco-friendly stationery over time. A change in suppliers in 2025 means that data are only available for June-December 2025. During this time, the share of eco-friendly stationery items reached 81.8%, representing an increase from 51.7% in the previous year.
The ECB is exploring ways to further increase this share. Staff are encouraged to return unused stationery and other office supplies to logistics storage for reuse. Additionally, a loan catalogue has been introduced as a pilot project, where staff can take items out on loan and return them when they are no longer needed. When purchasing non-standard office supplies outside the stationery catalogue, priority is given to sustainable products whenever possible.
4.3.4 Chemicals for water treatment and cooling agents

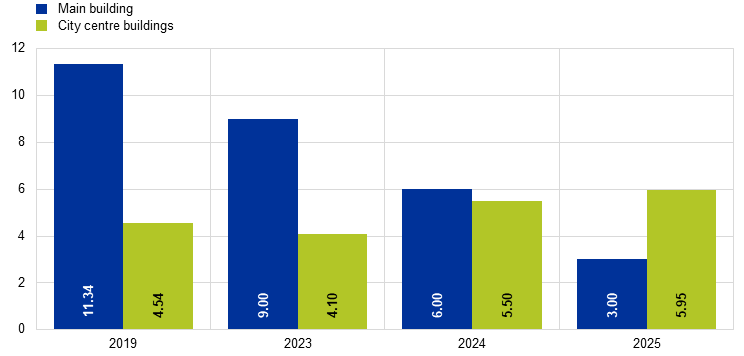
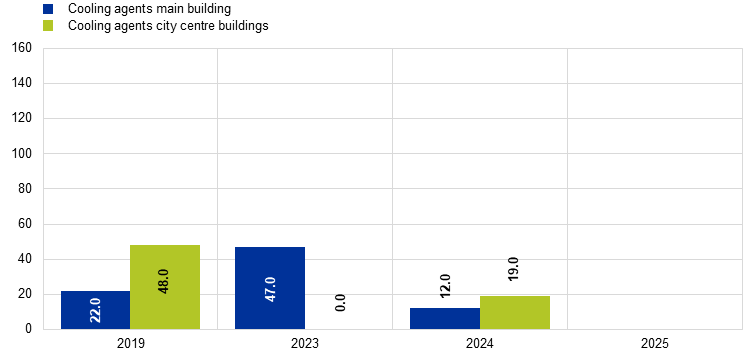
The consumption of chemicals used for water treatment decreased by 50% in the main building in 2025 compared with 2024, while increasing by 8.2% at the city centre buildings compared with the previous year. For all three buildings no cooling agent losses were reported in 2025.
Chart 10
Chemicals used for water treatment
(tonnes)
Source: ECB.
Chart 11
Cooling agent losses
(kilograms)
Source: ECB.
Notes: Results are depicted for 2019, as this is the baseline year for the ECB’s long-term emissions reduction objectives, and for the last three years for which data are available. For earlier results, see previous environmental statements.
4.4 Water and waste water

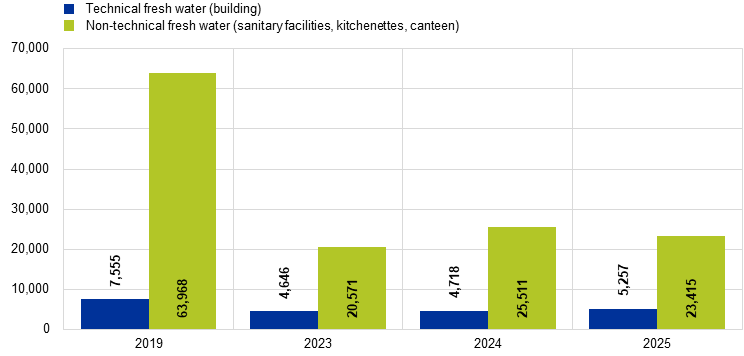
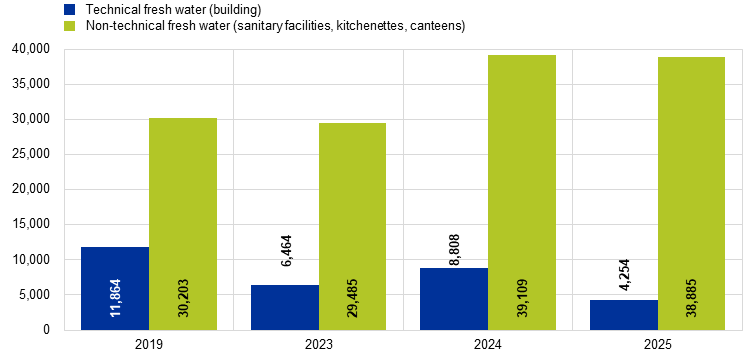
Water consumption in all three buildings is monitored closely, and the ECB is continuously looking for ways to optimise its utilisation. Technical fresh water refers to water used for temperature control in the premises. Non-technical fresh water includes water used in all sanitary facilities, kitchenettes and canteens. Irrigation water for the trees in the green areas of the main building is included under non-technical fresh water consumption and thus influences overall consumption when comparing non-technical fresh water consumption in the main building with that of the city centre premises.
At the main building, fresh water consumption decreased by 5.2% and non-technical water consumption decreased by 8.2% in 2025 compared with 2024. Technical water consumption increased by 11.4%.
At the city centre buildings, fresh water consumption decreased by 10%, and technical water consumption decreased by 51.7%.
Total fresh water consumption in 2025: 71,811 m3
The increase in technical fresh water consumption can be explained by changes in the performance of the data centre which impacts the need for water for cooling.
At the city centre premises, fresh water consumption decreased compared with 2024. After a strong increase in technical fresh water consumption at the city centre premises stemming from the regular flushing of water pipes, consumption decreased once again in 2025 following the installation of automatic flushing stations.
Further information on the CO2e emissions related to water and waste water can be found in the subsection on purchased goods and services in Chapter 3.2 – Indirect emissions.
Chart 12
Water consumption – main building
(m³)
Source: ECB.
Notes: Results are depicted for 2019, as this is the baseline year for the ECB’s long-term emissions reduction objectives, and for the last three years for which data are available. For earlier results, see previous environmental statements.
Chart 13
Water consumption – city centre buildings
(m³)
Source: ECB.
Notes: For more information on greenhouse gas emissions associated with water and waste water, see the section on purchased goods and services in Chapter 3.2 – Indirect emissions. Results are depicted for 2019, as this is the baseline year for the ECB’s long-term emissions reduction objectives, and for the last three years for which data are available. For earlier results, see previous environmental statements.

4.5 Waste and recycling
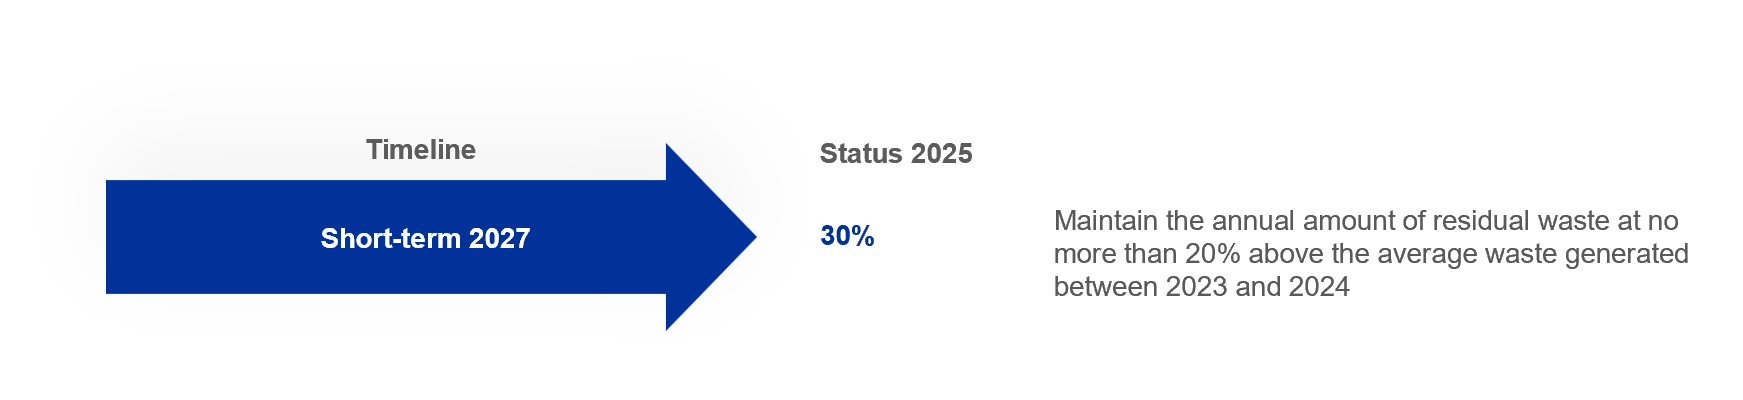
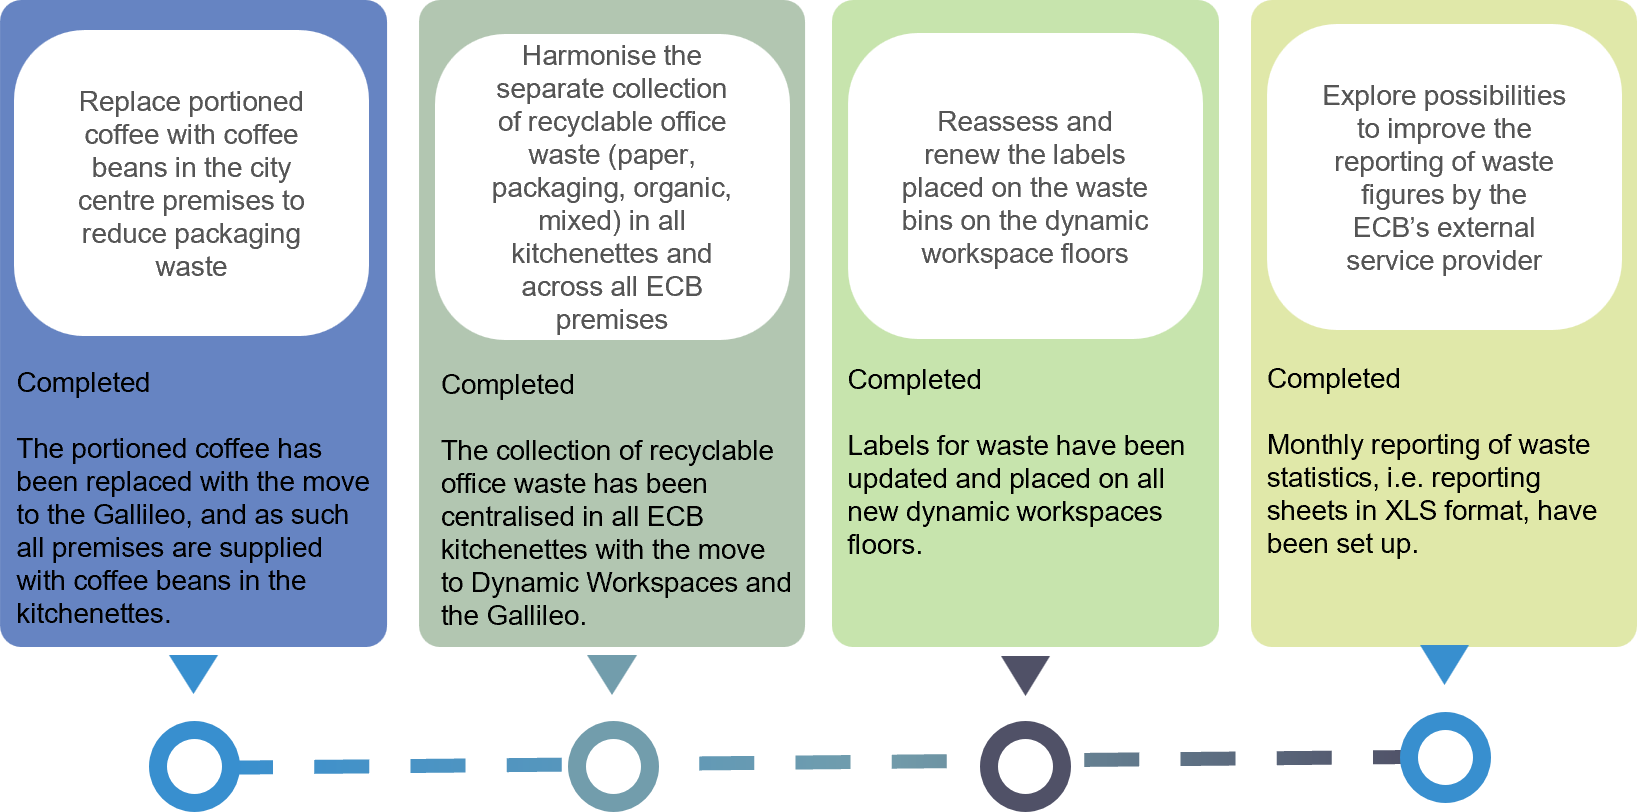
Figure 12
Waste management measures – highlights
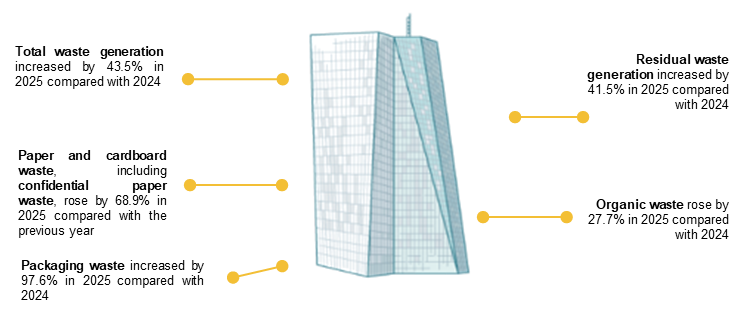
The total waste generation at the ECB premises amounted to 817 tonnes in 2025, representing an increase of 44% compared with 2024.
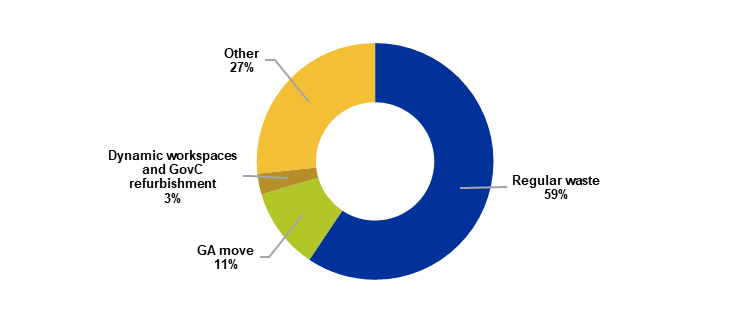
Out of the total waste generation, 485 tonnes are classified as regular waste. An additional 91 tonnes of waste were generated because of the move to the new building.
The implementation of the dynamic workspaces concept and the GovC refurbishment resulted in 23 tonnes of waste generated.
The ECB’s total waste generation increased by 44% in 2025 compared with 2024, amounting to 817 tonnes. This can be explained by the preparations for the move to the Gallileo building, the implementation of the dynamic workspaces concept and the refurbishment of the Governing Council (GovC) room. Of the 817 tonnes of waste recorded in 2025, non-hazardous waste amounted to 761 tonnes while hazardous waste made up 56 tonnes. The move to the Gallileo building will also affect waste figures in 2026. The ECB is aware of these developments and has formulated a specific waste-related objective as part of the EMP 2025-27. For updates on all waste measures see Chapter 7.4 – Waste measures.
While the ECB made it a priority to continue to use as many items as possible from the Eurotower, vacating the building led to an increase in waste generation. The amount of waste attributable to the move represents 11.1% of the total waste generated. Waste resulting from the implementation of the Dynamic Workspaces project and the GovC refurbishment made up 3% of total waste generation. Other waste sources include organic and grease waste from catering activities, confidential (paper) waste and donations of IT equipment.
In 2025 the ECB once again donated IT equipment, enabling old devices to be reused and helping to reduce IT waste. The ECB considers waste reduction and separation an important issue, of which it continues to raise awareness among staff and service providers. All newcomers, suppliers and employees are provided with specific up-to-date information on waste separation at the ECB.
Chart 14
2025 waste distribution by source
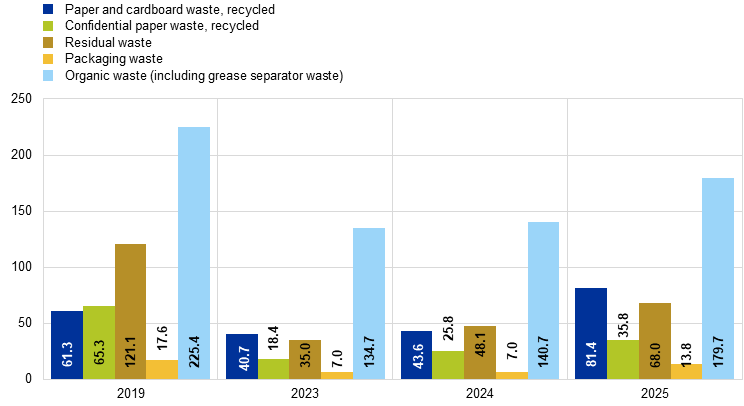
Main building developments
City centre developments

Chart 15
Waste and recycling – main building
(tonnes)
Source: ECB.
Notes: Residual waste refers to commercial waste that is similar to household waste. Results are depicted for 2019, as this is the baseline year for the ECB’s long-term emissions reduction objectives, and for the last three years for which data are available. For earlier results, see previous environmental statements.
Chart 16
Waste and recycling – city centre buildings
(tonnes)
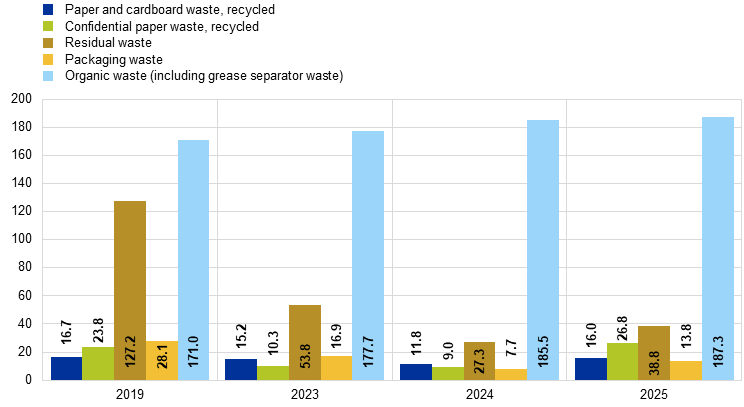
Source: ECB.
Notes: Residual waste refers to commercial waste that is similar to household waste.For more information on greenhouse gas emissions associated with waste, see Chapter 3.2 – Indirect emissions. Results are depicted for 2019, as this is the baseline year for the ECB’s long-term emissions reduction objectives, and for the last three years for which data are available. For earlier results, see previous environmental statements.
Table 1
Breakdown of waste types in accordance with the German Commercial Waste Ordinance
Commercial waste | Waste amounts in 2025 (tonnes) | |
|---|---|---|
ECB total | Organic waste | 189 |
Residual waste | 103.7 | |
Paper waste | 149.3 | |
Packaging waste | 27.1 | |
Glass waste | 9.5 | |
Bulky waste | 36.1 | |
Packaging waste (wood) | 12.6 | |
Total waste as per the Commercial Waste Ordinance | Total commercial waste | 527.5 |
Separate collection rate | 80.3% | |
Notes: The amounts of waste displayed in Table 1 partly differ from the amounts displayed in Charts 15 and 16 owing to the different categorisation of waste under the Commercial Waste Ordinance: organic waste does not include grease separator waste; packaging waste does not include packaging waste disposed of via the German dual system “Der Grüne Punkt”; paper waste includes both paper and cardboard waste as well as confidential paper waste.
Total waste as defined by the German Commercial Waste Ordinance amounted to 527.5 tonnes in 2025, representing a 53.3% increase compared with 2024. The increase can mainly be attributed to the implementation of the dynamic workspaces concept and preparations for the move to the new building. Additional waste was generated for both projects, for example, by removing large quantities of paper. Separately collected commercial waste (total waste excluding residual waste) under the Commercial Waste Ordinance amounted to 423.8 tonnes, marking a separate collection rate of 80.3% for 2025. Residual waste is pre-sorted and disposed of at a certified treatment plant.

4.6 Biodiversity
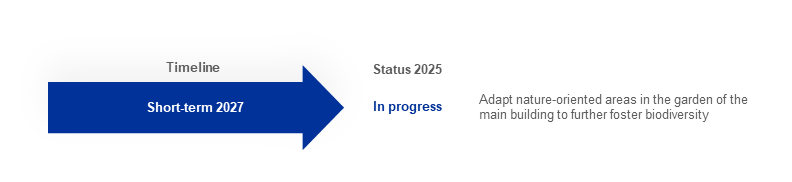
Figure 14
Biodiversity measures – highlights
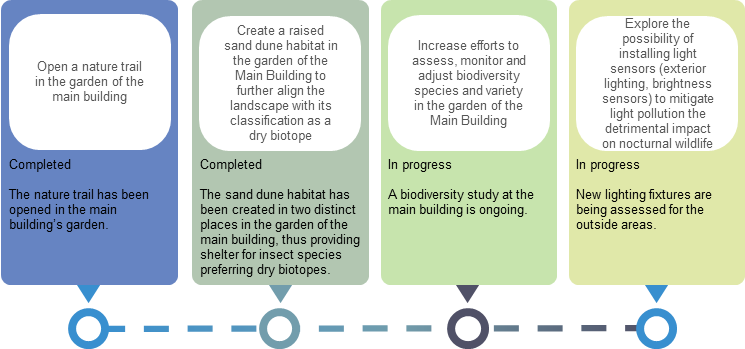
In 2025 the ECB further strengthened its biodiversity agenda, advancing the strategies and practices developed in recent years. Its approach remains centred on the protection and enhancement of biodiversity, species conservation and the sustainable care of green spaces. Over the year, meaningful progress was made in cultivating an environment that supports a wide range of flora and fauna, while also deepening awareness among staff.
A key milestone in 2025 was the official opening of the ECB’s nature trail, launched during the activities held for Biodiversity Week. The trail stemmed from the implementation of the biodiverse green care concept in the garden of the main building and is intended to familiarise both ECB staff and visitors with the overall concept as well as the specific measures taken to promote biodiversity in the area. It comprises nine themed stations and one introductory station, all of which are also accessible digitally via the ECB intranet. The stations showcase core features of the garden, including regional wildflower plantings, the creation of sand dunes, as well as the ecological treatment of deadwood and leaf litter. For updates on all biodiversity measures see Chapter 7.5 – Biodiversity measures.
Throughout the year, piles of deadwood were put together using branches and twigs left over from routine tree pruning. These structures offer shelter for a range of organisms and support nutrient cycling in the garden’s ecosystem. Such improvements not only enhance the visual character of the ECB grounds but also create critical habitats and feeding opportunities for local wildlife. The focus on indigenous plant species strengthens ecosystem resilience, which is particularly important given that the ECB grounds have been classified as a dry biotope by the City of Frankfurt’s environmental office.
The ECB also continued its systematic monitoring and documentation of the flora and fauna present on its premises. This work is intended to benchmark the biodiversity on ECB grounds against other locations in Frankfurt and the broader Hesse region. The findings help to assess the impact of existing measures and highlight where further action may be needed. External monitoring experts support this process and provide guidance on additional ways to strengthen biodiversity.
Reaffirming its long-term commitment to nature conservation, the ECB once again organised a dedicated programme of events around the International Day for Biological Diversity. The 2025 Biodiversity Week featured a diverse programme of activities designed to inform, engage and inspire staff on the topic of nature conservation. Throughout the week, staff could visit information stands on local bird species in cooperation with experts from the Senckenberg Institute, take guided tours of the ECB gardens with the Green Care team and external specialists, and join interactive “Biodiversity Fresk” workshops exploring the role of biodiversity and the pressures it faces.
The ECB’s biodiversity activities in 2025 demonstrate a strong and ongoing commitment to environmental responsibility. By expanding nature-focused practices, maintaining robust monitoring and promoting awareness within its community, the ECB continues to develop a healthy, dynamic ecosystem that benefits both the natural environment and those who use and enjoy its grounds. The EMP 2025-27 underpins these efforts and supports further progress in biodiversity conservation. The reduction in the use of chemicals for cleaning and inclusion of environmental criteria in priority 1 tenders (see Chapter 4.8 – Green public procurement), also helps foster biodiversity beyond the ECB’s own garden.
4.7 Banknotes

As part of the Eurosystem’s cash strategy, the ECB endeavours to improve the sustainability of euro banknotes throughout the cash cycle.
The ECB and the Eurosystem NCBs have the exclusive right to issue banknotes within the euro area. At the end of 2025 there were 31.3 billion euro banknotes in circulation.
The ECB coordinates, monitors and regulates the design, production and circulation of euro banknotes. The ECB promotes good environmental management and seeks to avoid any risk to the health and safety of the general public, as well as to the workers involved in the production and circulation of euro banknotes. All manufacturers producing euro banknotes and their main raw materials must provide the ECB with copies of their ISO 9001, ISO 14001, ISO 45001 certificates and specific declarations showing that they conform to the applicable standards for quality, environmental, health and safety management, and ethical conduct of business. The ECB also monitors and assesses the environmental impact of euro banknote production annually.
In 2022 the ECB assessed the environmental impact of the full cash cycle using a broad scope methodology, the Product Environmental Footprint (PEF) developed by the European Commission, while the ECB’s operational footprint was calculated using the Greenhouse Gas Protocol framework. The environmental footprint of euro banknotes as a payment instrument is very low, i.e. equivalent to 0.01% of the total environmental impact of a citizen. A repeat PEF assessment of the full cash cycle is planned for 2027. Emissions related to banknotes are not included in the ECB’s operational carbon footprint, as banknotes are a joint responsibility of the Eurosystem as a whole.
The ECB and Eurosystem NCBs are implementing policies to further reduce the environmental impact of euro banknotes. For example, in 2025 the cotton fibres used to produce euro banknote paper came exclusively from sustainable sources and the electrical energy for banknote manufacturing came increasingly from decarbonised sources. When banknotes reach the end of their life, they are disposed of using recovery and recycling methods. Disposal methods for euro banknotes, such as landfill and combustion (burning with no energy recovery), have been banned since 2022. From 2030 onwards banknote transport via plane among Eurosystem NCBs will be conducted using 100% sustainable aviation fuel, and as of 2027 the use of this fuel will already surpass the requirements set out in the ReFuelEU Aviation Regulation.
The ECB is engaging with all stakeholders to identify further ways to improve the environmental sustainability of euro banknotes throughout the cash cycle, including the eco-design of future banknotes. In this vein, a series of research and development projects are now under way. These projects aim to improve the environmental sustainability of current and future euro banknotes by (i) increasing their circulation lifetime, (ii) using raw materials with less environmental impact, and (iii) developing more sustainable solutions for their end-of-life treatment.
Detailed information on the environmental impact of euro banknotes is available on the ECB’s website in the section on The euro.
4.8 Green public procurement

Figure 16
Procurement measures – highlights
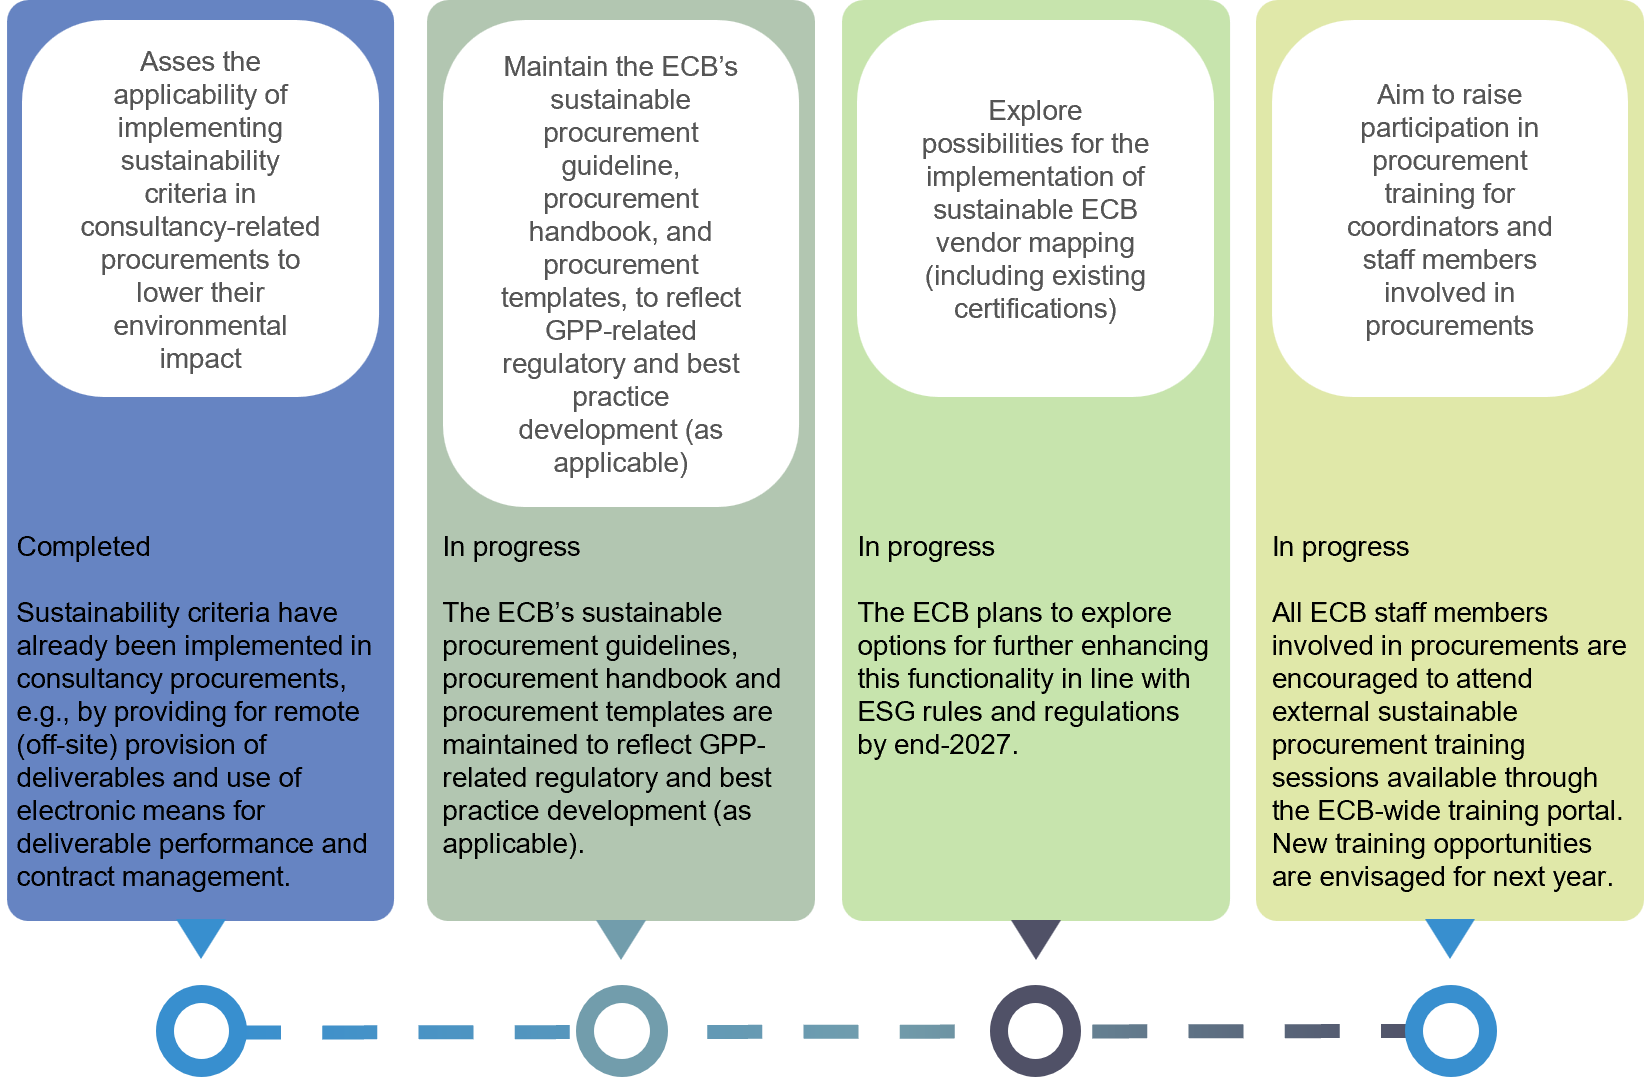
In 2025 the ECB further strengthened the role of public procurement as a core instrument for delivering on its environmental policy, using it to steer suppliers and internal stakeholders towards more sustainable practices. The Central Procurement Office (CPO) continued to act as a key support agent of the ECB’s EMS, advising business areas on procurement-related topics, reviewing tender documentation as part of its function as a second level of control in procurement, while also promoting the consideration of environmental aspects throughout the procurement cycle.
Under the EMP 2025-27, the ECB set a new objective for its most environmentally relevant (priority 1) procurement categories: at least 75% of the total estimated value of procedures in these categories should include appropriate environmental considerations over the three-year period. Priority 1 procurement categories include procurements in areas where there is a potential for relevant environmental impact, such as IT hardware, vehicles, travel or building maintenance and construction works, among others. In 2025, 96.4% of completed priority 1 procurements by estimated value were classified as green. When extending the analysis to all procurement categories, almost 84.5% of the overall value of procurements completed in 2025 was classified as green. The share of priority 1 procurements with environmental considerations is expected to remain at consistently high levels and meet the EMP target over the 2025-27 cycle. This confirms that appropriate green criteria are now included by default, wherever possible, in high-impact areas such as IT hardware, technical equipment and other priority 1 categories. Sustainable procurement (SPP) has also been explicitly embedded as a key objective in the ECB’s Multi‑Annual Procurement Plan 2026-28, consolidating its strategic importance. Furthermore, fair trade requirements have also been applied across all ECB catering contracts. For updates on all CO2e emissions measures see Chapter 7.6 – Green public procurement measures.
At the same time, the ECB is assessing software solutions to enrich the existing supplier environmental risk assessment functionality of its Contract and Vendor Management system with broader environmental, social and governance (ESG) and supply-chain information, in line with applicable ESG rules and regulations.
Knowledge-sharing and harmonisation have been significantly enhanced at the Eurosystem level. The Schuman Programme Project on Green Public Procurement, which was successfully executed by the ECB in 2025, has evolved into a standing network of SPP experts across the ECB and almost all Eurosystem NCBs, and is currently hosted and supported by the Eurosystem Procurement Coordination Office (EPCO). This network maintains a shared database of SPP practices, containing concrete examples and case studies in six key categories (consultancy services, payment systems, IT software, infrastructure, cloud and PCs/servers/peripherals). The database documents which central bank uses each best practice, whether the criteria are environmental or social and how they are applied, as well as an assessment of their effectiveness. CPO staff have access to this database and share relevant examples with procuring business areas. Some case studies will also be integrated into the Sustainable Procurement Guideline, which the CPO plans to review in 2026.
Beyond promoting and supporting the greening of its procurement processes, capacity building and awareness raising remained central to the ECB’s approach in 2025. All ECB staff members involved in procurements are offered the opportunity to attend external SPP training sessions delivered through the ECB-wide training portal, EUREKA. Additionally, the CPO is preparing a new procurement training programme for ECB staff based on short e-learning modules, including a dedicated SPP module that is planned to be rolled out by the end of 2027. In parallel, the ECB continues to organise awareness raising activities in the area of sustainable procurement to highlight good practices and foster dialogue within the institution.
Through these measures, the CPO continues to fulfil its mandate to help procuring business areas integrate environmental and social criteria into their procurement procedures in a consistent and compliant manner, while promoting alignment with Eurosystem partners and contributing to the effective implementation of procurement-relevant environmental and climate-related objectives and requirements within the ECB.

4.9 Travel

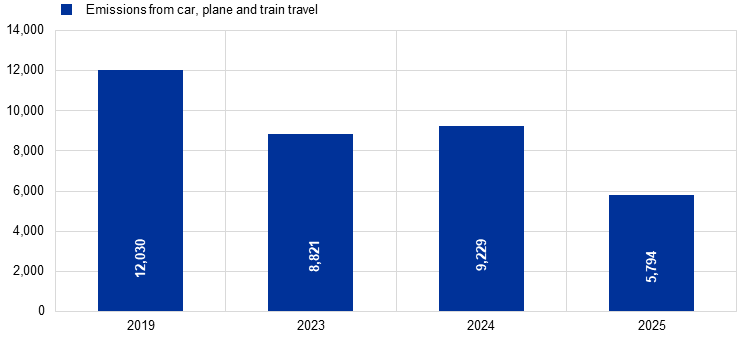
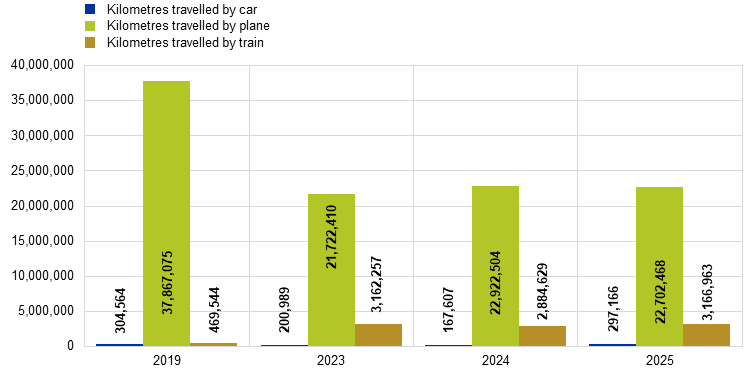
Notable changes were observed in the ECB’s travel-related environmental impact in 2025. The total distance travelled by staff rose slightly, by 0.7% compared with the previous year, reaching 26,166,597 kilometres, yet this remained 32% below the level recorded in 2019.[7] Emissions related to business travel stood at 5,794 tonnes of CO2e, which corresponds to a 37% decrease compared with the previous year and a 52% reduction compared with 2019. A main factor behind this substantial year-on-year decline was the update of flight-related emission factors issued by the Department of Energy Security and Net Zero. As these revised factors mirror post-pandemic aircraft occupancy rates, the sharp reductions in flight activity (kilometres flown) achieved in previous years have now materialised more clearly in the form of lower emissions. Nevertheless, emissions from air travel continued to dominate the travel-related footprint, representing 97% of all business travel emissions in 2025.
Chart 17
Emissions from business travel by car, plane and train and absolute number of kilometres travelled
a) Emissions
(tonnes of CO2 equivalent)
b) Absolute kilometres travelled by means of transport
(kilometres)
Source: ECB.
Notes: Results are depicted for 2019, as this is the baseline year for the ECB’s long-term emissions reduction objectives, and for the last three years for which data are available. For earlier results, see previous environmental statements.
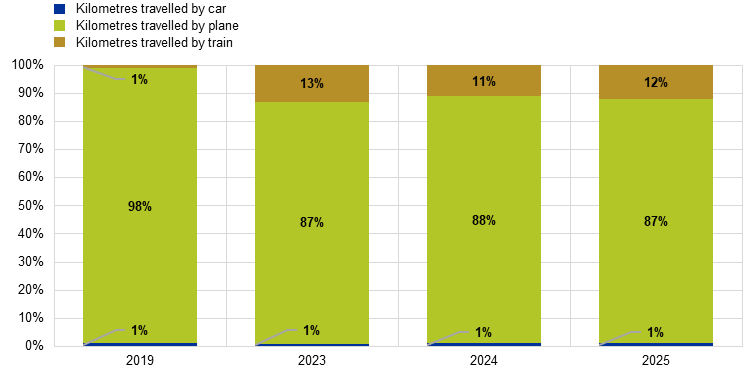
Building on the strong impact of the measures introduced under the previous EMP, the target of limiting business travel-related emissions to 60% of their 2019 level was carried forward into the new EMP, with 2027 being set as the target year. The intention is to consolidate the more environmentally sustainable working practices that emerged during the pandemic and to further limit environmental impacts from travel. Consistent with the continuous improvement principle that underpins the ECB’s EMS, internal travel rules are regularly reassessed to identify potential enhancements. The ECB’s efforts to render its travel more environmentally sustainable, and the success of these efforts, have been reflected in the marked increase in rail use. In 2025 the total number of kilometres travelled by train was almost seven times higher than in 2019 and has remained relatively stable since 2023. For updates on all CO2e emissions measures see Chapter 7.2 – Emissions reduction measures.
Chart 18
Percentage of total volume travelled (kilometres) for business travel by means of transport
Percentage of total volume travelled by means of transport
(percentages)
Source: ECB.
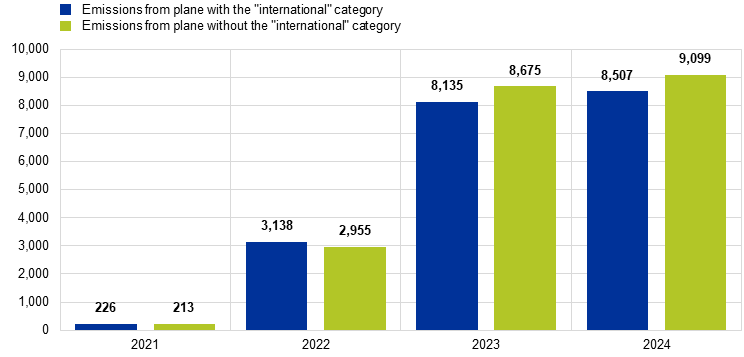
In addition, as part of the long-standing Environmental Network of Central Banks (ENCB), a dedicated working group was set up in 2024 to develop a structured approach to making interinstitutional business travel and events more sustainable. Over the course of 2025 this group completed its primary deliverable – a non-binding guideline – as planned. Further details on interinstitutional cooperation are provided in Chapter 6.10 – Communication, engagement and awareness raising. The guideline includes a proposed methodology for carbon accounting, designed both to support the calculation of related emissions and to ensure a harmonised approach among ENCB members. In order to better align its own internal carbon accounting practices with the recommendations developed by the ENCB task force, in 2025 the ECB decided to discontinue the “international” flight category and to base its calculations solely on the “domestic”, “short haul” and “long haul” categories. This change required the reclassification and recalculation of all flights since the international flight category was introduced in 2021. The impact of this re-categorisation on emissions is shown in Chart 19.
Chart 19
Emissions from business travel by plane with and without the “international” category
Emissions
(tonnes of CO2 equivalent)
Source: ECB.
Conference-related activities at the ECB declined by 31.2% compared with 2024, leading to total emissions of 2,855 tonnes of CO2e related to participants’ travel to the ECB.[8] This corresponds to a 73.5% reduction relative to 2019. The main reason for the substantial decrease in emissions was the significantly lower number of participants travelling to the ECB for meetings, events or conferences. Compared with 2024, the number of people coming on-site for such purposes in 2025 fell by 38%. The effect of the updated flight emission factors mentioned above further amplified this reduction. Although the organisation of meetings in 2025 was no longer formally governed by the objective set in the previous EMP cycle, meeting organisers continued to follow the guidance applied in the preceding two years[9]. Consequently, only 34% of all meetings involving external participants were held in person in 2025, substantially below the recommended cap of 50%.
Staff Commuting and Teleworking
Emissions from staff commuting and teleworking are estimated using a survey carried out every two years, with the latest survey conducted in 2025. This was the second survey round in the post-pandemic setting under the unchanged teleworking policy. Owing to the limitations inherent in survey-based methods, the resulting estimates are subject to a higher degree of uncertainty and should therefore be interpreted with caution.
In 2025 emissions from staff commuting to ECB premises totalled 1,175 tonnes of CO2e, a reduction of 25% compared with 2024 and 58% below the 2019 baseline. By contrast, emissions associated with teleworking increased compared with the previous year, reaching 424 tonnes of CO2e, which represents a 36% rise relative to 2024. As in earlier years, teleworking-related emissions were largely related to heating, which accounted for 80% of this source. Greenhouse gas emissions linked to staff commuting and teleworking are presented in Chapter 5.2 – Indirect emissions

4.10 Communication, engagement and awareness raising
Figure 17
Communication, engagement and awareness raising objectives
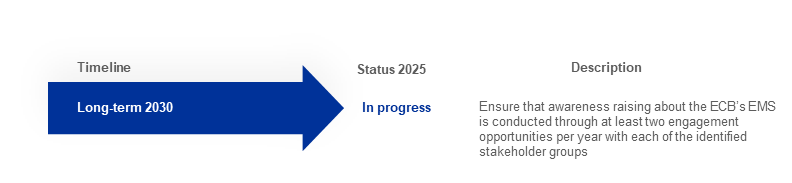
Figure 18
Communication, engagement and awareness raising measures – highlights
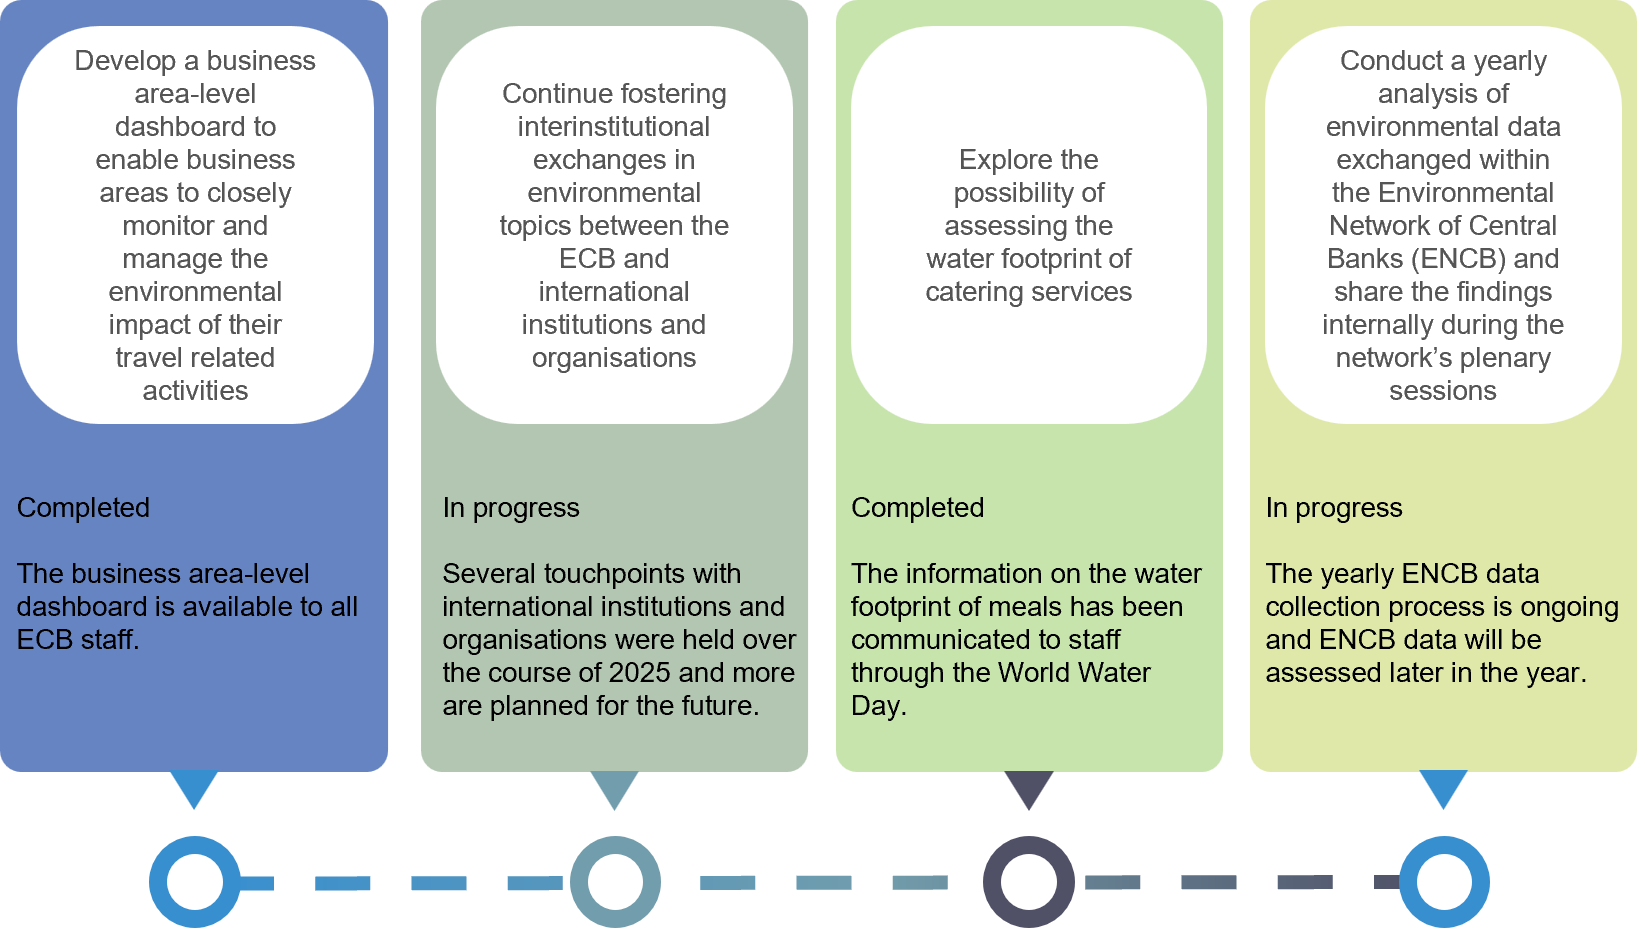
2025 was a fruitful year for the ECB’s environmental communication and awareness raising efforts. A variety of events and initiatives were successfully carried out both virtually and in person. The ECB focused on strengthening its engagement with staff and stakeholders, promoting environmental responsibility through collaborative efforts. This chapter highlights the main events and activities that shaped the ECB’s environmental agenda over the course of the year.
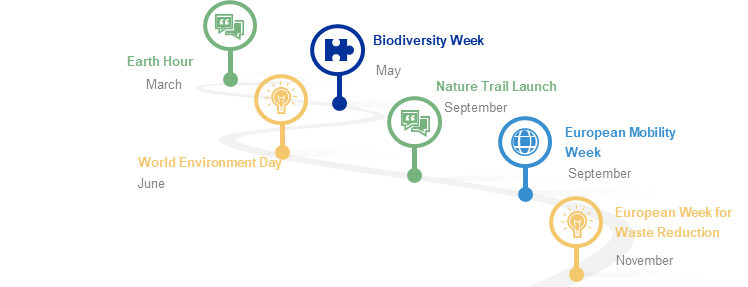
On 22 March the ECB marked Earth Hour for the 14th consecutive year, joining the World Wildlife Fund’s global initiative by switching off non-essential lights for 60 minutes to raise awareness of climate challenges and promote a sustainable future for our planet. Under the theme “Give an hour for Earth doing something you love”, the ECB offered a special Earth Hour menu that staff could later recreate at home.
As in previous years, the Biodiversity Week was a key event in 2025, held in combination with World Bee Day on 20 May. In collaboration with the Climate Change Centre, a wide range of activities were arranged aimed at raising awareness on biodiversity and nature loss. A particularly well-received highlight was the organisation of a bird stand on local species in collaboration with the Senckenberg Institute for Nature Research. Biodiversity Fresk interactive workshops were offered on-site, and staff were once again invited to join guided tours of the ECB’s garden at the main building, providing an opportunity to learn about the biodiversity measures implemented on-site. In collaboration with the ECB Theatre Section, a staged reading of Henrik Ibsen’s “An Enemy of the People” was presented. Additionally, a dedicated research session on “The Economics of Climate Change and Biodiversity” was hosted by the Directorate General Research with the Climate Change Centre. The “No Mow May” initiative was once again promoted to emphasise the importance of natural habitats in supporting biodiversity.
On 5 June the ECB celebrated World Environment Day with the launch event for the updated EMP 2025-27. The event aimed to engage staff to achieve shared environmental objectives and inform them about the new measures outlined in the programme. For updates on all communication and awareness raising measures see Chapter 7.7 – Communication and awareness raising measures.
The ECB hosted several events in the fourth quarter of 2025. In September the Green Care team launched the ECB Nature Trail, following the implementation of the biodiverse green care concept in the main building garden. The trail consists of ten different information boards explaining the general concept as well as the individual measures taken to foster biodiversity to both ECB staff and visitors.
From 16 to 22 September the ECB participated in European Mobility Week under the official theme “Mobility for Everyone”. As part of the initiative, bike inspections were provided by the ECB’s safety team at both the main building and city centre premises. To further promote sustainable travel, internal communications highlighted the ECB’s business travel support and green travel options and featured a quiz to test staff knowledge on sustainable mobility.
Additionally, from 22 to 30 November the ECB celebrated the European Week for Waste Reduction. Under the theme “Turn on the value, switch off the waste”, internal communications focused on raising awareness about Europe’s increasing volume of e-waste, featuring an interactive quiz and providing staff with an e-waste recycling map.
In December practical tips for sustainable Christmas trees and eco-friendly choices during the festive season were featured internally to staff. Throughout the year, “Cinema of Change” movie nights were offered to staff, presenting carefully selected films about environmentally relevant challenges in our time.
The Environmental Management team continues to present an introduction to their work to newcomers on the first day. The e-learning course on Climate Change and Environmental Management once again proved popular with ECB staff, with 3,085 members having participated since its launch in early 2022. Since January 2024 the e-learning course has been integrated into the ECB newcomers’ onboarding programme, providing exposure to the ECB’s EMS from the moment they join the bank.
Interinstitutional collaboration remains a cornerstone of the ECB’s EMS, fostering exchanges with other European institutions and Eurosystem NCBs. The collaboration is primarily facilitated through key networks that aim to share best practices and expertise on environmental management topics. The ENCB serves as a platform for environmental management teams across European NCBs to coordinate efforts, both through ad hoc engagements and dedicated task forces. Notably, the Task Force on Carbon Footprints made progress on its work through deep dives into areas such as teleworking and commuting, purchased goods and services, as well as banknotes. Additionally, the Task Force on Business Travel finalised its primary deliverable – the guideline on sustainable travel. This non-binding guideline presents a structured approach to making business travel and events more environmentally sustainable, setting out key policies, guidelines and methodologies on carbon accounting. To further foster cooperation, the Interinstitutional Group for Environmental Management (GIME) facilitates collaboration among EMAS-registered European institutions. The ECB also remains active in the Network for Greening the Financial System, where central banks and supervisors from around the globe meet to exchange experiences, share best practices and contribute to the development of guidance.
5 Technical information
The previous chapters presented the ECB’s most relevant environmental aspects and the developments in these aspects, as well as their related objectives and measures. In this chapter, additional insights and information are provided in line with the requirements of the EMAS Regulation.
Number of workplaces | 2023 | 2024 | 2025 |
|---|---|---|---|
Main building | 3,064 | 3,051 | 3,200 |
City centre buildings | 2,443 | 2,404 | 2,495 |
Total | 5,507 | 5,455 | 5,695 |
Source: ECB.
Notes: Workplace indicators are reported as a requirement under EMAS. It should be noted that a slight bias exists compared with pre-pandemic years owing to the updated teleworking policies. Not all workplaces are occupied on a day-to-day basis. Thus, workplace indicators do not fully represent actual developments.
5.1 Updates to conversion factors
The following table shows an overview of percentual changes of CO2e emission conversion factors which have been used for the calculation of the 2025 emissions. Additional information can be found in Chapter 3 – The ECB’s carbon footprint. Although most emission factors are updated annually, only those factors that have changed by more than 5% compared with 2024 are listed in the table. The aim of the table is to transparently report on underlying changes in emission factors to improve the measurement of the carbon footprint. Since 2025, the German Federal Environment Agency (Umweltbundesamt – UBA), has published a standardised, quality-assured and regularly updated list of emission factors for all common fuels as well as major climate-damaging activities and processes carried out by organisations. To ensure a consistent methodological approach for calculating the ECB’s carbon footprint, emission factors have been taken from the UBA publication wherever possible (only available in German).
Conversion factor updated | Source | Change 2024-25 |
|---|---|---|
Energy – Emissions scope 1 | ||
Bencin / Super | Benzin [kWh], Emissionsfaktorenliste Umweltbundesamt 2025 V 2.0: TREMOD 6.71 Transport Emission Model; ID 02_10_01_001_01 | 7.8% |
Diesel fuel | Diesel [kWh], Emissionsfaktorenliste Umweltbundesamt 2025 V 2.0: TREMOD 6.71 Transport Emission Model; ID 02_10_01_005_01 | 7.4% |
Energy – Emissions scope 2 | ||
Biogas/Biomethane | ||
Electricity mix – Germany | Emissionsfaktorenliste Umweltbundesamt 2025 V 2.0: Emissionsbilanz erneuerbarer Energieträger (Lauf et al. 2025); ID 05_32_01_001_01 | 7.8% |
District heating – Germany | Emissionsfaktorenliste Umweltbundesamt 2025 V 2.0: Emissionsbilanz erneuerbarer Energieträger (Lauf et al. 2025); ID 06_31_01_008_01 Emissionsfaktorenliste Umweltbundesamt 2025 V 2.0: Emissionsbilanz erneuerbarer Energieträger (Lauf et al. 2025); ID 06_20_01_008_01 | 75% |
Energy – Emissions scope 3 | ||
Bencin / Super | Benzin [kWh], Emissionsfaktorenliste Umweltbundesamt 2025 V 2.0: TREMOD 6.71B Transport Emission Model; ID 08_31_01_001_01 | 36.4% |
Diesel fuel | Diesel [kWh], Emissionsfaktorenliste Umweltbundesamt 2025 V 2.0: TREMOD 6.71B Transport Emission Model; ID 08_31_01_005_01 | 60% |
Electricity, renewable – hydropower | Emissionsfaktorenliste Umweltbundesamt 2025 V 2.0: Emissionsbilanz erneuerbarer Energieträger (Lauf et al. 2025); ID 05_31_02_001_01 | 50.3% |
Electricity, renewable – wind | Emissionsfaktorenliste Umweltbundesamt 2025 V 2.0: Emissionsbilanz erneuerbarer Energieträger (Lauf et al. 2025); ID 05_31_02_002_01 | 70.9% |
IT equipment – Emissions scope 3 | ||
Desktop | Desktop-PC Grundgerät mit SSD, Emissionsfaktorenliste Umweltbundesamt 2025 V 2.0: Ökologische und ökonomische Aspekte beim Vergleich von Arbeitsplatzcomputern für den Einsatz in Behörden unter Einbeziehung des Nutzerverhaltens (Öko-APC) Texte 66/2016 (Siddharth et al. 2016); ID 10_32_01_007_XX | 101.9% |
Laptop | Notebook Grundgerät mit SSD, Emissionsfaktorenliste Umweltbundesamt 2025 V 2.0: Ökologische und ökonomische Aspekte beim Vergleich von Arbeitsplatzcomputern für den Einsatz in Behörden unter Einbeziehung des Nutzerverhaltens (Öko-APC) Texte 66/2016 (Siddharth et al. 2016); ID 10_32_01_005_XX | 83.9% |
Monitor | Monitor 22", Emissionsfaktorenliste Umweltbundesamt 2025 V 2.0: Ökologische und ökonomische Aspekte beim Vergleich von Arbeitsplatzcomputern für den Einsatz in Behörden unter Einbeziehung des Nutzerverhaltens (Öko-APC) Texte 66/2016 (Siddharth et al. 2016); ID 10_32_01_001_XX | 60.3% |
Servers | Server, Emissionsfaktorenliste Umweltbundesamt 2025 V 2.0: KPI4DCE (Schödwell et al. 2018); ID 10_32_02_001_XX | 28.5% |
Videoconference | Emissionsfaktorenliste Umweltbundesamt 2025 V 2.0: UBA-eigene Berechnung basierend auf Green Cloud Computing (Gröger et al. 2021) und Emissionsbilanz erneuerbarer Energieträger (Lauf et al. 2025); ID 10_32_03_002_XX | -84.6% |
Business travel – Emissions scope 3 | ||
Medium car (battery electric vehicle) | PKW Elektro [km], Emissionsfaktorenliste Umweltbundesamt 2025 V 2.0: TREMOD 6.71B Transport Emission Model; ID 08_32_03_017_06 | 108.6% |
Medium car (hybrid) | PKW Plug-In-Hydrid [km], Emissionsfaktorenliste Umweltbundesamt 2025 V 2.0: TREMOD 6.71B Transport Emission Model; ID 02_10_02_018_06 | -25.7% |
Medium motorbike | Motorrad [km] Emissionsfaktorenliste Umweltbundesamt 2025 V 2.0: TREMOD 6.71B Transport Emission Model; ID 08_32_03_025_06 | 62.8% |
Public transport (ÖPNV) | Straßen, S- & U-Bahn: Emissionsfaktorenliste Umweltbundesamt 2025 V 2.0: TREMOD 6.71B Transport Emission Model; ID 08_32_03_039_09 | -33.8% |
Rail travel, long distance | Bahn Nahverkehr: Emissionsfaktorenliste Umweltbundesamt 2025 V 2.0: TREMOD 6.71B Transport Emission Model; ID 08_32_03_040_09 | -17.2% |
Rail travel, short distance | Bahn Fernverkehr: Emissionsfaktorenliste Umweltbundesamt 2025 V 2.0: TREMOD 6.71B Transport Emission Model; ID 08_32_03_038_09 | -24.9% |
Air travel, domestic – economy class | 2025 Guidelines – DEFRA Greenhouse Gas Conversion Factors for Company Reporting | -15.8% |
Air travel, short haul – economy class | -31.1% | |
Air travel, short haul – business class | ||
Air travel, long haul – economy class | -41.4% | |
Air travel, long haul – premium economy class | ||
Air travel long haul – business class | ||
Air travel, long haul – first class | ||
Business travel – WTT emissions[10] | ||
WTT medium car (hybrid) | PKW Plug-In-Hydrid [km], Berechnung aus der Differenz von Emissionsfaktorenliste Umweltbundesamt 2025 V 2.0: - TREMOD 6.63A Transport Emission Model; ID 08_32_03_018_06- TREMOD 6.63A Transport Emission Model; ID 02_10_02_018_06 | 82.7% |
Waste – Emissions | ||
Aluminium cans and foil | 2025 Guidelines – DEFRA Greenhouse Gas Conversion Factors for Company Reporting | -26.9% |
Batteries | ||
Construction: tyres | ||
Construction: wood | ||
Glass | ||
Paper and board | ||
Plastics (combustion) | ||
Plastics (open-loop) | ||
WEEE mixed | ||
Commercial and industrial waste | 2025 Guidelines – DEFRA Greenhouse Gas Conversion Factors for Company Reporting | 6.6% |
Household residual waste | EBeV 2030 - Emissionsberichterstattungsverordnung 2030 - Verordnung über die Emissionsberichterstattung nach dem Brennstoffemissionshandelsgesetz für die Jahre 2023 bis 2030 > Anlage 2 > Teil 5 > Restabfall: Heizwertbezogener Emissionsfaktor abzüglich Biomasseanteil | 6,168.3% |
Water – Emissions scope 3 | ||
Fresh water | Emissionsfaktorenliste Umweltbundesamt 2025 V 2.0: GEMIS Datensatz Xtra-Trinkwasser\DE-2020; ID 10_32_05_001_05 | 5.9% |
Waste water | Emissionsfaktorenliste Umweltbundesamt 2025 V 2.0: UBA-eigene Berechnung basierend auf National Inventory Report und DESTATIS Abwassermenge für häusliches und betriebliches Schmutzwasser sowie Erhebung der nichtöffentlichen Abwasserentsorgung; ID 11_32_01_001_05 | 56.2% |
Cleaning services – Emissions scope 3 | ||
Cleaning services | Change to UK BEIS/DEFRA Conversion factors per Euro spent, by SIC code 2022, converted from GBP to EUR and corrected for inflation, “Services to buildings and landscape” category; the previous emission factor from ADEME is no longer available | -25.5% |
Air emissions, NOx | ||
Bencin | Emissionsbilanz erneuerbarer Energien 2025 (https://www.umweltbundesamt.de/publikationen/emissionsbilanz-erneuerbarer-energietraeger-2023) | 403.3% |
Diesel fuel | 147.7% | |
Air emissions, SO2 | ||
Bencin | Emissionsbilanz erneuerbarer Energien 2025 (https://www.umweltbundesamt.de/publikationen/emissionsbilanz-erneuerbarer-energietraeger-2023) | 23.5% |
Diesel fuel | -85.2% | |
Air emissions, PM | ||
Bencin | Emissionsbilanz erneuerbarer Energien 2025 (https://www.umweltbundesamt.de/publikationen/emissionsbilanz-erneuerbarer-energietraeger-2023) | -7% |
Diesel fuel | -12.5% | |
Location-based emissions
Conversion factor updated | Source | Change 2024-25 | CO2e emissions 2025 – ECB premises (tonnes) |
|---|---|---|---|
Electricity mix, Germany (including upstream emissions) | Emissionsfaktorenliste Umweltbundesamt 2025 V 2.0: Emissionsbilanz erneuerbarer Energieträger (Lauf et al. 2025); ID 05_32_01_001_01 | n/a | 12,203.80 |
District heating mix, Germany | Emissionsfaktorenliste Umweltbundesamt 2025 V 2.0: Emissionsbilanz erneuerbarer Energieträger (Lauf et al. 2025); ID 06_31_01_008_01 & ID 06_20_01_008_01 | n/a | 4,264.45 |
Note: If the standards for calculating the ECB’s organisational footprint were to allow only location-based emissions, the 2025 footprint would increase by approximately 53%.
Workplace-based environmental performance indicators 2023-25
Energy consumption | Performance indicators per workplace (kWh/workplace/year) | 2023 | 2024 | 2025 |
|---|---|---|---|---|
ECB total | Electrical energy per workplace | 5,272 | 5,526 | 5,055 |
Heating energy per workplace | 3,286 | 3,634 | 3,713 | |
Total energy for premises per workplace | 8,558 | 9,169 | 8,767 | |
Main building | Electrical energy per workplace | 5,750 | 5,963 | 5,400 |
Heating energy per workplace | 2,040 | 2,224 | 2,356 | |
Process energy per workplace | 72.4 | 76.9 | 72.4 | |
City centre buildings | Electrical energy per workplace | 4,673 | 4,972 | 4,611 |
Heating energy per workplace | 4,848 | 5,442 | 5,453 |
Office paper consumption | Performance indicators per workplace (sheets of A4 equivalent/workplace/year) | 2023 | 2024 | 2025 |
|---|---|---|---|---|
ECB total | Office paper per workplace | 1,966 | 568 | 120 |
Note: Consumption of other paper products, such as letterheads, calendars and notepads, is included.
Water consumption | Performance indicators per workplace (m3/workplace/year) | 2023 | 2024 | 2025 |
|---|---|---|---|---|
ECB total | Total fresh water per workplace | 11.1 | 14.3 | 12.5 |
Main building | Non-technical fresh water per workplace (sanitary facilities, kitchenettes, canteen) | 6.7 | 8.4 | 7.3 |
Total fresh water per workplace | 8.2 | 9.9 | 9.0 | |
City centre buildings | Non-technical fresh water per workplace (sanitary facilities, kitchenettes, canteen) | 12.1 | 16.3 | 15.6 |
Total fresh water per workplace | 14.7 | 19.9 | 17.3 |
Waste generation | Performance indicators per workplace [kg/workplace/year] | 2023 | 2024 | 2025 |
|---|---|---|---|---|
ECB total | Non-hazardous waste per workplace | 98.2 | 99.2 | 133.6 |
Hazardous waste per workplace | 3.0 | 4.8 | 9.8 | |
Main building | Paper and cardboard waste per workplace | 13.3 | 14.3 | 25.4 |
Confidential paper waste per workplace | 6.0 | 8.5 | 11.2 | |
Residual waste per workplace | 11.4 | 15.8 | 21.2 | |
Packaging waste per workplace | 2.3 | 2.3 | 4.3 | |
Organic waste (including grease separator waste) per workplace | 44.0 | 46.1 | 56.2 | |
City centre buildings | Paper and cardboard waste per workplace | 6.2 | 4.9 | 6.4 |
Confidential paper waste per workplace | 4.2 | 3.7 | 10.7 | |
Residual waste per workplace | 22.0 | 11.4 | 15.6 | |
Packaging waste per workplace | 6.9 | 3.2 | 5.5 | |
Organic waste (including grease separator waste) per workplace | 72.7 | 77.2 | 75.1 |
Emissions of CO2 equivalents | Performance indicators per workplace [kgCO2 equivalent/workplace/year] | 2023 | 2024 | 2025 |
|---|---|---|---|---|
Direct emissions – scope 1 | Direct emissions – scope 1 | 38.9 | 24.3 | 12.9 |
Fuels | 21.6 | 17.0 | 12.9 | |
Cooling agent losses at ECB premises | 17.2 | 7.3 | - | |
Indirect emissions – scope 2 | Indirect emissions – scope 2 | 473.4* | 536.3* | 550.8 |
Electrical energy consumption at ECB premises | n/a | n/a | n/a | |
Heating and cooling of ECB premises | 420.0 | 480.3 | 491.4 | |
Biogas | 53.388* | 55.996* | 59.424 | |
Indirect emissions – scope 3 | Indirect emissions – scope 3 | 4,414.2* | 4,471.2* | 3.401,7 |
Business travel | 1,683.4* | 1,783.2* | 1,114.8 | |
Staff commuting and teleworking | 308.1 | 345.3 | 280.9 | |
Building construction amortisation | 809.3 | 817.1 | 782.6 | |
Upstream energy | 266.7* | 276.9* | 299.6 | |
Conference participants travel | 802.4 | 760.7 | 501.4 | |
Waste | 1.6 | 1.0 | 8.8 | |
Purchased goods and services | 323.6 | 284.1 | 248.0 | |
Other assets (furniture, IT devices) | 219.1 | 203.1 | 165.6 | |
Total CO2e emissions per workplace | Total CO2e emissions per workplace | 4,926* | 5,032* | 3,965 |
Outside of scope emissions | Biogas | 381.9* | 400.6* | 425.1 |
Compensated paper | 3.5 | 0.2 | 3.5 |
Notes: Direct emissions – scope 2 were revised from 0.717 kg CO2e/workplace/year to 53.388 kg CO2e/workplace/year in 2023 and from 0.455 kg CO2e/workplace/year to 55.996 kg CO2e/workplace/year in 2024 owing to a change in emission factors for biogas which was applied retrospectively from 2023. As a result, total scope 2 emissions were revised from 420.7 kg CO2e/workplace/year to 473.4 kg CO2e/workplace/year in 2023 and from 480.8 kg CO2e/workplace/year to 536.3 kg CO2e/workplace/year in 2024.
Indirect emissions – scope 3 changed from 4,168.6 kg CO2e/workplace/year 4,414.2 kg CO2e/workplace/year in 2023 as a result of the re-categorisation of flights for business travel conducted in 2025 and applied retrospectively from 2021.Indirect emissions – scope 3 changed from 4,661 kg CO2e/workplace/year to 4,471.2 kg CO2e/workplace/year in 2024. The change can also be explained by the re-categorisation of flights. Additionally, a calculation error was corrected and a change was made to the emission factors for biogas which was applied retrospectively from 2023. As a result, the business travel indicators were revised from 1,585.5 kg CO2e/workplace/year to 1,683.4 kg CO2e/workplace/year in 2023 and from 1,674.5 kg CO2e/workplace/year to 1,783.2 kg CO2e/workplace/year in 2024. The upstream energy indicators were revised from 119.1 kg CO2e/workplace/year to 266.7 kg CO2e/workplace/year in 2023 and from 70.5 kg CO2e/workplace/year to 276.9 kg CO2e/workplace/year in 2024. Consequently, the total CO2e emissions per workplace changed from 4,628 kg CO2e/workplace/year to 4,926 kg CO2e/workplace/year in 2023 and from 4,661 kg CO2e/workplace/year to 5,032 kg CO2e/workplace/year in 2024.
Outside of scope emissions for biogas were revised from 375.5 kg CO2e/workplace/year to 381.9 kg CO2e/workplace/year in 2023 and from 393.9 kg CO2e/workplace/year to 400.6 kg CO2e/workplace/year in 2024, also owing to the change in the emission factor for biogas.
Air emissions | Performance indicators per workplace (kg/workplace/year) | 2023 | 2024 | 2025 |
|---|---|---|---|---|
Air emissions | SO2 per workplace | 0.040* | 0.042* | 0.049 |
NOx per workplace | 0.718* | 0.746* | 0.808 | |
PM per workplace | 0.019* | 0.019* | 0.020 |
Notes: SO2 emissions per workplace were revised from 0.003 kg CO2e/workplace/year to 0.040 kg CO2e/workplace/year in 2023 and from 0.003 kg CO2e/workplace/year to 0.042 kg CO2e/workplace/year in 2024. NOx emissions per workplace were revised from 0.123 kg CO2e/workplace/year to 0.718 kg CO2e/workplace/year in 2023 and from 0.121 kg CO2e/workplace/year to 0.746 kg CO2e/workplace/year in 2024. PM emissions per workplace were revised from 0.012 kg CO2e/workplace/year to 0.019 kg CO2e/workplace/year in 2023 and from 0.012 kg CO2e/workplace/year to 0.019 kg CO2e/workplace/year in 2024.
Air emissions | Total air emissions (tonnes) | 2023 | 2024 | 2025 |
|---|---|---|---|---|
Air emissions | SO2 | 0.22* | 0.23* | 0.28 |
NOx | 3.96* | 4.07* | 4.60 | |
PM | 0.10* | 0.10* | 0.11 |
Notes: Total SO2 emissions changed from 0.02 to 0.22 tonnes in 2023 and from 0.02 to 0.23 tonnes in 2024. NOx emissions per workplace were revised from 0.68 to 3.96 tonnes in 2023 and from 0.66 to 4.07 tonnes in 2024. PM emissions per workplace were revised from 0.07 to 0.10 tonnes in 2023 and from 0.07 to 0.10 tonnes in 2024.
Biodiversity | Land use (ha) | 2023 | 2024 | 2025 |
|---|---|---|---|---|
Land use – main building | Total land use | 11.9 | 11.9 | 11.9 |
Sealed area | 4.6 | 4.6 | 4.6 | |
Unsealed area | 7.3 | 7.3 | 7.3 | |
Nature-oriented area | 6.5 | 6.5 | 6.5 | |
Land use – city centre buildings | Total land use | 0.7 | 0.7 | 0.7 |
Sealed area | 0.5 | 0.5 | 0.5 | |
Nature-oriented area | 0.2 | 0.2 | 0.2 |
Uncertainty assessment of the ECB’s carbon footprint, 2025
Category | Scope | Details | Certainty ranking | Comments |
|---|---|---|---|---|
Energy | 1 | Cooling agent losses | Good | data: good (amount of refill); |
1, 3 | Car fleet | Very good | data: very good (internal reports); | |
1, 3 | Emergency unit | Good | data: good (amount of refill); | |
2, 3 | Biogas | Very good | data: very good (meter readings/invoice, certificate); factor: very good (UBA) | |
2, 3 | District heating | Very good | data: very good (meter readings/invoice); factor: very good (Mainova) | |
2, 3 | Electricity from renewable – wind | Very good | data: very good (meter readings/invoice, certificate); factor: very good (UBA) | |
2, 3 | Electricity from renewable – hydropower | Very good | data: very good (meter readings/invoice, certificate); factor: very good (UBA) | |
Business travel | 3 | Airplane with RFI and WTT | Good | data: good (travel agency); factor: very good (DEFRA) |
3 | Train | Good | data: fair (travel agency and estimates, rail service provider); factor: very good (TREMOD) | |
3 | Car – personal | Good | data: good (internal reports); | |
3 | Hotel stays | Good | data: good (travel agency, no data available concerning the hotel category); factor: good (DEFRA; averages based on DEFRA) | |
Staff commuting | 3 | Teleworking | Fair | data: fair (survey and extrapolation); |
3 | Staff commuting | Fair | data: fair (survey and extrapolation); factors: good (general factors from DEFRA, TREMOD) | |
Conference participants | 3 | Conference participants’ travel | Fair | data: fair (internal reports, estimates); |
Building construction amortisation | 3 | Fixed assets – building construction | Fair | data: good (square metres), |
Waste | 3 | Waste | Fair | data: fair (internal reports/invoices, estimates); factor: good (DEFRA, extrapolation based on DEFRA, EBeV) |
Purchased goods and services | 3 | Catering services | Good | data: good (catering agencies – uncertainties cannot be excluded); factor: good (IFEU: Klimatarier) |
3 | Gardening | Good | data: good (amount of diesel used); | |
3 | Fresh and waste water | Good | data: good (meter readings and calculations); factor: very good (UBA) | |
3 | Office supplies and stationery | Fair | data: fair (costs); | |
3 | Cleaning services | Fair | data: fair (costs), | |
3 | Office paper, paper for publication, and other paper products | Fair | data: good (weight or service provider, minor data gaps cannot be excluded); factor: fair (not specific, IFEU) | |
3 | Electricity external printing centre | Fair | data: fair (reports and estimates); | |
3 | ICT Services – videoconferences | Good | data: good (reports from service providers); factor: very good (UBA) | |
3 | Electricity from external data centre | Very good | data: very good (meter reading, certificate); factor: very good (UBA) | |
3 | Emergency unit from external data centre | Very good | data: very good ECB’s share of total data centre consumption (meter reading, certificate); factor: very good (UBA) | |
3 | Fresh and waste water from external data centre | Very good | data: very good (ECB’s share of total data centre consumption meter reading, certificate); factor: very good (UBA) | |
3 | Cooling agent losses from external data centre | data: good (ECB’s share of total data centre consumption); factor: very good (UBA) | ||
Other assets (furniture, IT devices) | 3 | Furniture | Fair | data: good (internal reports, general furniture categories); factor: fair (ADEME, factors not specific to the furniture type) |
3 | IT devices | Fair | data: good (internal reports, general IT device categories); factor: fair (ADEME, UBA, factors not specific to all devices) |
Notes: Changes to the previous certainty ranking are marked in bold.
GEMIS = Global Emission Model for Integrated Systems; DEFRA = Department of Environment, Food and Rural Affairs; TREMOD = Transport Emission Model; UBA = German Federal Environment Agency; ADEME = French Environmental and Energy Management Agency; IFEU = German Institute for Energy and Environmental Research.
The following ranking was applied to estimate the uncertainty of the activity data and the emission factors.
Certainty ranking | Uncertainty of activity data | Uncertainty of emission factor |
|---|---|---|
Poor | Activity data are rough estimates, e.g. based on studies or comparable baseline situations. | Emission factors have been determined in a first step, but are still very general, e.g. the emission factor is extrapolated from another factor for a similar process. |
Fair | Activity data are available but incomplete; for example, activity data are not available for the whole assessment period and are extrapolated.Evidence for the activity data is incomplete and/or not reliable.Only the costs of the data can be provided. | Emission factors are available, but they are not yet specific and robust.Emission factors are value-based, e.g. kgCO2e/euro. |
Good | Activity data are complete and plausible, evidence is available.Minor uncertainties/data gaps cannot be excluded/avoided but do not have a significant negative impact on the result.The share of assumptions, estimates and calculations is reduced to a minimum, they are comprehensible and plausible and have no significant negative impact on the result. | Emission factors are specific and robust. Final, minor uncertainties cannot be excluded/avoided.Use of averages or calculations based on ADEME, DEFRA/ DESNZ, UBA or GEMIS or other non-German databases. |
Very Good | Data are complete and plausible, evidence is available, e.g. meter readings or accurate measurements. Uncertainties/data gaps can be excluded. No assumptions or estimations are made. | All emission factors are specific and reliable, e.g. use of provider-specific emission factors or widely known/recognised databases such as ADEME, DEFRA/ DESNZ, UBA, GEMIS or other German databases. |
Note: ADEME = French Environmental and Energy Management Agency; DEFRA = Department of Environment, Food and Rural Affairs; DESNZ = Department for Energy Security and Net Zero; UBA = German Federal Environment Agency; GEMIS = Global Emission Model for Integrated Systems.
5.2 Compliance obligations

The ECB adheres to a multitude of environmental regulations which are based on German legislation both at the municipal and the national level. Relevant regulations are summarised in a comprehensive register which is regularly reviewed and updated by legal professionals at the ECB. Compliance developments and resulting measures are diligently monitored to ensure full compliance.
Most of the ECB’s legal requirements are centred around the maintenance and operation of all three premises as well as external services such as catering and cleaning. A comprehensive review of compliance with the environmental regulations is conducted through the annual internal verifications. The latest assessments found no instances of non-compliance.
In 2026 a comprehensive environmental inspection was carried out for the new Gallileo building, including a full review of all applicable environmental law obligations to ensure regulatory conformity during commissioning and operation.
Table 2
Relevant areas of environmental legislation and related facilities/activities
Most relevant area of environmental legislation | Relevant facilities/activities |
|---|---|
Water regulations | Storage of diesel, storage of cleaning agents, use of oil traps, cooling, waste water discharge into sewerage system |
Regulations on climate protection and refrigerants | Cooling installations containing coolants characterised by more than five tonnes of global warming potential expressed in tonnes of CO2 equivalent |
Regulations on energy efficiency of buildings | Energy certification, building insulation, energy-efficient technologies |
Energy efficiency regulations | Energy audit requirements fulfilled by EMAS |
Regulations on health and safety and hazardous materials | Risk assessment, fire prevention, requirements for use of hazardous substances (e.g. acids, lye) |
Waste regulations | Separation/recycling/disposal of various types of waste |
Alongside its environmental legal obligations, the ECB adheres to additional self-imposed environmental commitments. These include a commitment to the sustainable procurement guidelines and the environmental objectives formulated in the EMP. Moreover, the ECB organises various awareness raising activities that foster environmental engagement among ECB staff.
Since 2022 the ECB has adopted an internal framework which aims to support the integration of the climate considerations set out in relevant policies, projects and activities. With the publication of the ECB’s climate and nature strategy, the ECB has expressed its ongoing commitment to embed climate and nature considerations in its day-to-day processes, wherever relevant.
More information about the climate-related activities within the ECB’s mandate is available on the ECB’s website.
For enquiries concerning information in this publication, please refer to the ECB’s contact page.
6 Environmental verifier’s declaration
The environmental verifiers listed below confirm that they have verified that the sites, as described in this environmental statement of the organisation European Central Bank with the registration number DE-125-00045 meets all the requirements of Regulation (EC) No. 1221/2009 of the European Parliament and of the Council of 25 November 2009, as amended on 28 August 2017 and 19 December 2018, on the voluntary participation by organisations in a Community eco-management and audit scheme (EMAS).
Name of the environmental verifier | Registration number | Approved for the sectors (NACE) |
|---|---|---|
Prof. Dr.-Ing. Jan Uwe Lieback | DE-V-0026 | 64.11 Central Banking |
By signing this declaration, it is confirmed that
- the assessment and validation have been carried out in full compliance with the requirements of Regulation (EC) No. 1221/2009 as amended by Commission Regulation (EU) 2017/1505 and (EU) 2018/2026,
- the result of the assessment and validation confirms that there is no evidence of non-compliance with applicable environmental legislation and that
- the data and information in the environmental statement give a reliable, credible and true picture of all the organisation's activities.
This declaration cannot be equated with EMAS registration. EMAS registration can only be carried out by a competent body in accordance with Regulation (EC) No. 1221/2009. This statement may not be used as a stand-alone basis for informing the public.
Frankfurt am Main, 2026-06-11
 | 
für Managementsysteme mbH Umweltgutachter DE-V-0213 Eichenstraße 3 b D-12435 Berlin Tel: +49 30 233 2021 - 0 Fax: +49 30 233 2021 - 39 E-Mail: info@gut-cert.de | |
Environmental verifier DE-V-0026 |
| Disclaimer This Environmental Statement provides information to the general public and other interested parties about the environmental performance and activities of the European Central Bank (ECB) in 2025. It can be found on the ECB’s website (see the page entitled “Environmental protection at the ECB”). The ECB was first validated under the EU Eco-Management and Audit Scheme (EMAS) in 2010. This Environmental Statement, which is the 17th to be produced within the EMAS validation cycle, is the sixth consolidated Environmental Statement (after previous statements in 2010, 2013, 2016, 2019, 2022 and 2025). This Environmental Statement was drafted in line with EMAS standards in accordance with Regulation (EC) No 1221/2009 and the updated annexes of the EMAS Regulation in accordance with Regulation (EC) No 2017/1505. |
7 Environmental Management Programme (2025-27) measures update
7.1 CO2e-emissions reduction measures
Measure | Status |
|---|---|
Introduce a non-binding, common business travel guidelines for Eurosystem members to reduce physical travel | Completed The guideline has been distributed and the document’s methodology is reflected in the ECB’s 2026 carbon footprint. |
Tailor produce sourcing to favour seasonality and regionality | Completed Seasonality and regionality aspects have been incorporated into the meal plan of the external service provider. |
Explore possibilities to increase the organic food quota at the ECB | Completed One fully organic dish is provided each day, and a bio-audit is conducted once a year. |
Assess the feasibility of improving the bundling of food deliveries to reduce emissions stemming from transportation | Completed The external catering providers use a supplier system which places a strong focus on optimising delivery routes. The bundling of food deliveries is a strategic point. |
Maintain usage of Querfeld products (bio fruits and vegetables) for catering services at the ECB | Completed The collaboration with Querfeld has been continued. |
Continue the initiative to promote hotels with environmental management practices in place | Completed |
Explore technical possibilities to enhance the travel booking platform by considering tools and functionalities for more detailed emissions monitoring and steering | In progress An assessment of how to incorporate a carbon emissions methodology calculation into the new travel booking tool is being carried out. |
Support the design and implementation of the upcoming online travel booking tool to facilitate relevant environmental features | In progress The new online travel booking tool has been implemented. The incorporation of environmental considerations is currently being discussed. |
Monitor and, wherever possible, facilitate the uptake of plant-based meals in the staff canteen | In progress The staff canteen continues to offer a “meat-free Thursday”. |
Keep disposable plastic items in catering outlets and kitchen operations to a minimum, in line with German food safety regulations | In progress A refund system is in place at the canteens and coffee bars. Some products are still wrapped in single-use plastic by default. New product lines are being investigated for alternative packaging materials and changes are being made wherever possible. |
Include environmental and social impact assessments in the project assessment related to facility management and construction | In progress Environmental and social impact assessments have been included in all planned project charters as aspects to be taken into account. Updating the assessments matrix is being considered. |
Develop a set of environmental key performance indicators (KPIs), in collaboration with the ECB’s service providers, formulating environmental targets related to their services | In progress Initial discussions have taken place on the development of meaningful KPIs. |
Explore and assess further decarbonisation objectives after 2030, including a net-zero target | In progress |
Check the feasibility of using synthetic diesel fuel (HVO) for diesel-operated equipment (generators, multipurpose tractor, cherry pickers) | In progress Discussions with diesel manufacturers about alternatives for diesel fuels are ongoing. |
Develop further analytical tools to support decision-making processes and facilitate the inclusion of environmental considerations in facility management projects | In progress The energy dashboard is currently under development. Environmental considerations will be incorporated into the dashboard after the initial development phase has been finalised. |
Assess different opportunities to enhance electrical charging opportunities for ECB staff and service providers | In progress A stocktake of EU institutions’ electrical charging infrastructure kicked off in 2025. |
Maintain collaboration with energy suppliers to pursue additional avenues for decarbonising the ECB's energy supply | In progress Through collaboration with the energy supplier, Mainova, the main building will be provided with green district heating with the aim of decarbonising the ECB’s scope 2 and 3 emissions. |
Assess the environmental benefits of corporate airline programmes with a focus on sustainability, including sustainable aviation fuel purchase programmes | In progress An initial evaluation of sustainable aviation fuel based on scientific papers has been started. |
Systematically review business travel rules to identify opportunities for improvement to reduce the environmental impact of business travel | In progress Business travel rules have been updated, with a further update expected by the end of EMP cycle (2027). |
Explore possibilities to further mitigate the environmental impact of physical conferences, events and meetings hosted at the ECB | In progress |
Continue collaboration with the German rail supplier Deutsche Bahn (DB) on corporate rates for train travel destinations, alongside the frequent traveller benefits programme (DB Bahn Card) | In progress The collaboration is ongoing. |
Develop a monitoring tool that allows business areas to closely monitor emissions stemming from the travel of external participants to the ECB for meetings, events or conferences | In progress A tool is currently being developed. |
Explore opportunities to further support the use of green mobility (e.g. further optimising usage of the job ticket) | In progress Progress on the measure is ongoing, with the aim of optimising and aligning the job ticket with an evolving commuting landscape. |
Assess the environmental impact of cloud-based services and AI at the ECB | In progress The ECB is exploring avenues to include the emissions stemming from cloud-based services and Artificial intelligence in its carbon footprint. |
Continue promoting the safety of sustainable commuting methods and continue collaboration between the Safety team and Green ECB | In progress Collaboration between the Green ECB team and the Safety team is ongoing, with the aim of promoting the safety of sustainable commuting methods. |
Further streamline the data collection and monitoring process with the facility management service providers in all ECB premises | In progress Optimisation of the data collection process is under way. |
Include environmental assessment in the Project Steering Committee projects | Pending |
Explore possibilities for the continued greening of the ECB’s car fleet | In progress Continuation of the policy of purchasing only electric/hybrid vehicles for Executive Board members and postponing the replacement of vehicles in the case of non-intense usage. |
Establish guidelines to limit fixed logistics standard transport to one day per week while allowing for exceptional transport on demand and integrating smaller courier items in the standard transport activity of the daily mail shuttle | Pending |
Explore opportunities to formally introduce carbon-free delivery of mail and packages through the ECB mail distribution service | Pending |
Ensure collaboration between Security Services and Green ECB on environmental improvements and opportunities related to security equipment and services | Pending |
Note: “Completed” = measure completed; “In progress” = measure in progress; “Pending” = measure still to be implemented; “New” = measure stemming from the new EMP.
7.2 Energy efficiency measures
Measure | Status |
|---|---|
Carry out an assessment of the ten floors with the highest consumption to identify potential improvement opportunities | Completed Analyses of energy consumption have been conducted and the results will be incorporated into the internal energy dashboard. |
Assess ways to further optimise heating and cooling throughout the premises, considering the buildings’ technical features and staff needs | Completed Through an assessment of the heating conditions at the ECB’s data centre, it has been decided to raise the temperature by two degrees, thus ensuring that energy efficiency is maintained. |
Explore the feasibility of further differentiating between various energy streams | Completed The energy streams at the ECB’s main building have been divided into three distinct categories (Highrise, Grossmarkthalle and Data Centre) and an analysis has been undertaken. |
Carry out specific tests on the main building’s baseload power consumption and identify key drivers of consumption | Completed Specific tests on the main building’s baseload power consumption were carried out and evaluated. The insights gained will be incorporated into the Energy Dashboard, which is currently under development. |
Explore opportunities to incorporate an energy analytics dashboard into the quarterly footprint report | In progress An energy consumption dashboard is in development to ensure a holistic view of the energy management at the ECB. |
Explore opportunities to develop a systematic energy management approach, including identifying and monitoring consumption sources, to uncover efficiency opportunities | In progress Development and enhancement of the energy dashboard is ongoing. |
Conduct an analysis of the potential impact on energy efficiency of shutting down lighting and heating in the office areas outside working hours, and assess the savings opportunities | In progress Assessment is ongoing. |
Calculate the environmental benefits of replacing the existing lighting with LEDs using ValERI methodology in the main building | In progress ValERI calculations are currently being conducted. |
Replace light fixtures in the conference areas, the Grossmarkthalle barrel-vaulted ceiling and underground parking area with LEDs | In progress A project that aims to replace current lighting with LED fixtures at the main building is currently in its development phase. |
Conduct a feasibility assessment on the installation of photovoltaic cells | In progress A feasibility study and stakeholder meetings are currently under way to assess the possible installation of photovoltaic cells in the ECB’s main building and the Grossmarkthalle. |
Explore opportunities to extend energy saving measures from the current building stock to future rented buildings | In progress The new building is currently in its integration phase. Once this phase is complete, it will be operated according to the principle of equal treatment for all buildings. |
Explore possibilities to optimise the energy-efficient usage of refrigerated areas | In progress Refrigerated areas are operated in compliance with the specified guidelines, ensuring correct temperature control as well as recording and documentation. Further improvement opportunities will be discussed whenever possible. |
Continuously assess cloud service usage to identify improvement opportunities and reduce the corresponding environmental impact | In progress The environmental impact of cloud service usage is currently being assessed. |
Maintain the current daytime cleaning concept at the ECB | In progress The daytime cleaning concept has been upheld in all premises and communication measures to inform staff and raise awareness about the environmental impact are planned. |
Evaluate adherence to the European Code of Conduct on Data Centre Energy Efficiency (ECA) recommendation | In progress Colleagues in the ECB’s Directorate General Information Systems are currently evaluating adherence to the European Code of Conduct on Data Centre Energy Efficiency. Work will continue until the end of the EMP cycle. |
Investigate average ECB on-site workplace energy consumption (e.g. laptops, monitors) and factor this information into teleworking-related emissions calculations | Pending |
Systematically increase the energy efficiency of data centres whenever feasible, adjusting operational parameters and/or optimising the usage of existing infrastructure | Pending |
7.3 Material efficiency measures
Measures | Status |
|---|---|
Include environmental considerations and assess the optimisation of workplaces | Completed The Green ECB team is actively participating in the Gallileo and Dynamic Workspaces project streams, including environmental considerations wherever possible. The Green ECB team is also involved in discussions about the future optimisation of workplaces in all three of the ECB’s buildings. |
Whenever technicians deem it appropriate, prioritise the repair and reuse of equipment in facility management projects, maintenance and refurbishment, subject to cost consolidations and urgency | Completed The technicians default to repair and reuse unless safety, cost or time constraints clearly favor replacement |
Pilot a loan system for office materials and supplies that are not used regularly, to reduce unnecessary stock | Completed A loan system for office materials and supplies has been implemented. |
Reduce the number of shipments and unnecessary packaging of office supplies and stationery by bundling orders | Completed Through the switch to centralised purchasing, items are stored and distributed to colleagues internally. Orders are thus contained in one shipment, as opposed to the previous system where one customer order corresponded to one order made with the supplier. |
Establish a centralised storage and pick-up point for office supplies and stationery to reduce the amount of office supplies offered in small quantities | Completed A centralised storage point is available in the ECB’s main building and will soon be made available in the new Gallileo building. |
Explore possibilities to reduce the environmental impact of individually wrapped items | In progress There are only limited amounts of plastics in the canteen and coffee bar, e.g. for products still in single-use plastic wrappers in the vending machines. New product lines is being investigated for certain items which also favour alternative packaging materials and changes are planned wherever possible. |
Raise awareness (through campaigns) to foster the return of unused office supplies | In progress A new campaign encouraging the return of unused office supplies is being prepared, to be launched by the end of 2026. |
Explore opportunities to establish a formal procedure for donating unused or end-of-life equipment (e.g. to charity) | In progress A procedure is being drawn up. |
Assess the feasibility of reducing the amount and types of hardware and software available to ECB staff according to business-specific needs | In progress Through the Dynamic Workspaces project, some obsolete hardware has already been phased out, e.g. physical fax machines. The phasing out of further equipment by the end of the EMP cycle is being assessed. |
Establish a standard sustainable catalogue for all office supplies, toners, paper and stationery items | In progress Once legacy office supplies and items still in stock are depleted, the ECB will transition to having a sustainable office supplies catalogue, with changes expected until end-2026. Currently, the items in the catalogue are marked as sustainable or not sustainable. |
Explore possibilities to increase the in-house production of paper office supplies | In progress A new tender for Print Centre Services is currently expected to take place by the end of EMP cycle. |
Pilot the use of automatic paper dispensers in bathrooms | In progress Research on new types of paper dispenser is ongoing, with an improved dispenser being installed in the Gallileo building. |
Optimise the introduction of new water dispensers ensuring the replacement of old equipment once it reaches end of life | In progress New water dispensers have been installed in the kitchenette areas of the Gallileo building. Replacement of the water dispensers used in the main building is currently being explored. |
Further standardise branded giveaways for meetings, events and conferences and ensure procured items include environmental considerations | Pending |
Support reducing furniture needs arising from the reduction of workplaces and foster its sustainable reuse and return | In progress A detailed furniture inventory is maintained in Planon and made available to space management planners, with CAFM and SAP tracking furniture movement, reuse, and disposal. The approach prioritizes using and repurposing stock furniture, supplier return programs and buy-back schemes, and donation, resale, or sharing options with other organizations. Lessons from the downsizing effort are used to improve future furniture forecasting and planning. |
Explore opportunities to simplify IT infrastructure by phasing out equipment and services (or parts of services) that are no longer required/in use | Pending |
Investigate environmental improvement opportunities for the maintenance and cleaning supplies of the car fleet | In progress Biodegradable products are being promoted and used for cleaning cars wherever possible. |
Ensure continuous communication and awareness for floor controllers regarding the ecological use of first aid kits | In progress The Safety Awareness Tour continues to be carried out and staff are being made aware that specific items used in the first aid kit can be requested instead of replacing the whole kit. In the main building, kits have been sealed with a ribbon and stickers to raise awareness among users. |
Explore possibilities to reuse packaging of ECB IT equipment that is shipped and collected around Europe | Pending |
7.4 Waste measures
Measure | Status |
|---|---|
Harmonise the separate collection of recyclable office waste (paper, packaging, organic, mixed) in all kitchenettes and across all ECB premises | Completed The collection of recyclable office waste has been centralised in all ECB kitchenettes with the move to Dynamic Workspaces and the Gallileo. |
Replace portioned coffee with coffee beans in the city centre premises and thus avoid unnecessary packaging waste | Completed The portioned coffee has been replaced with the move to the Gallileo, and as such all premises are supplied with coffee beans in the kitchenettes. |
Reassess and renew the labels placed on the waste bins on the dynamic workspaces floors | Completed Labels for waste have been updated and placed on all new dynamic workspaces floors. |
Explore possibilities to improve the reporting of waste figures by the ECB’s external service provider | Completed Monthly reporting of waste statistics, i.e. reporting sheets in XLS format, have been set up. |
Explore opportunities to maximise proper waste sorting during relocation activities | In progress A separate purchase order number has been assigned to distinguish waste related to relocation activities from usual waste. The logistics and waste teams are working in close collaboration. |
Extend the existing waste manual to cover activities conducted by external service providers | In progress The drafting process for the extended waste manual has started. |
Trial a waste tracking system to help alleviate food waste in the production of canteen meals | In progress An optical recognition system is currently being deployed as part of a trial phase and information is being analysed. |
Explore and assess circularity concepts and procedures with the aim of further reducing waste | In progress Circularity measures are currently being assessed in the context of the move to dynamic workspaces. |
Explore the possibilities of depleting/discarding the old stock of office supplies in an environmentally friendly manner | In progress Twice a year, legacy stationery items are checked and supplies that have not been re-ordered are discarded. |
Explore possibilities to centralise waste collection points on all dynamic workspace office floors to increase sorting rates and reduce the use of plastic liners | In progress |
Reuse existing furniture as much as possible in current relocation and renovation projects | Pending |
Reuse IT and electronic equipment used by Security Services whenever feasible and assess whether said equipment can be repurposed after the end of its life cycle | In progress Components from dismantled systems, whether still supported by manufacturers or otherwise, are repurposed as spare parts as part of a “Break & Fix” approach or reused at the new ECB site. Additionally, the landlord of the Eurotower has retained certain system functionalities for ongoing building operations after the ECB’s relocation. |
Look into the possibilities of badge disposal or recycling and ensure that re-entries receive their old badge whenever possible | In progress Badges are reused to the extent possible and, when necessary, they are disposed of through the proper waste management channels. |
Minimise the amount of pandemic-related consumables as far as possible and ensure their proper disposal when necessary | In progress No new purchases have been made, and the disposal of material is planned and executed through the appropriate waste management stream. |
Ensure that Security Services’ equipment is properly disposed of according to internal ECB procedures | In progress All equipment designated for disposal is managed either by the contracted supplier under ECB purchase order procedures or through the ECB’s internal disposal channels. |
7.5 Biodiversity measures
Measure | Status |
|---|---|
Open a nature trail in the garden of the main building | Completed The nature trail has been opened in the main building’s garden. |
Create a raised sand dune habitat in the garden of the main building to further align the landscape with its classification as a dry biotope | Completed The sand dune habitat has been created in two distinct places in the garden of the main building, thus providing shelter for insect species preferring dry biotopes. |
Increase efforts to assess, monitor and adjust biodiversity species and variety in the garden of the main building | In progress A biodiversity study at the main building is ongoing. |
Explore the possibility of installing light sensors (exterior lighting, brightness sensors) to mitigate light pollution the detrimental impact on nocturnal wildlife | In progress New lighting fixtures are being assessed for the outside areas. |
Explore the possibility of planting fruit trees and native tree species and increase pollinator-friendly plants in the garden of the main building | In progress To date, ten fruit trees have been planted. The pollinator-friendly plants in the garden generally grow well on their own. |
Explore the possibility of placing bird feeders in the garden during the winter period | In progress This is an ongoing commitment that will be undertaken until the end of the EMP cycle. |
Continue exploring measures to reduce the risk of bird collisions around the main building | In progress The monitoring of bird collisions at the ECB has been finalised. This is an ongoing commitment that will be undertaken until the end of the EMP cycle. |
7.6 Green public procurement measures
Measure | Status |
|---|---|
Develop a new KPI methodology for the ECB’s green public procurement procedures | Completed A new KPI methodology has been drawn up and the new public procurement EMP objective is currently based on this methodology. |
Assess the applicability of implementing sustainability criteria in consultancy-related procurements to lower their environmental impact | Completed Sustainability criteria have already been implemented in consultancy procurements, e.g., by providing for remote (off-site) provision of deliverables and use of electronic means for deliverable performance and contract management. |
Include sustainable stationery and office supplies as the standard for future procurements of these items | Completed The new contract for sustainable office supplies is in place. Items marked as sustainable are now the default as long as they have the appropriate technical characteristics. Standard non-sustainable items are ordered only when there is no other option. |
Define a set of procurement categories for which the inclusion of environmental and social criteria will be assessed | Completed Procurement categories have been established and are reflected in the ECB’s revamped Green Public Procurement objective. |
Explore opportunities to further increase interinstitutional collaboration with the GPP Helpdesk, EPCO and peer institutions | Completed The ECB participates in the EPCO Eurosystem-wide working group and supports the update and maintenance of the SPP Database, which was developed by the ECB and is currently hosted and managed by EPCO. |
Explore the possibilities of introducing contract clauses to reduce the use of environmentally harmful substances | In progress The preparations for the new tender will start in 2026. |
Maintain the ECB’s sustainable procurement guidelines, procurement handbook and procurement templates to reflect GPP-related regulatory and best practice development (as applicable) | In progress The ECB’s sustainable procurement guidelines, procurement handbook and procurement templates are maintained to reflect GPP-related regulatory and best practice development (as applicable). |
Explore the possibilities of including environmental considerations in upcoming procurements related to facility management | In progress The measure is ongoing, with the Green ECB team providing input for relevant procurements related to technical facility management. |
Explore possibilities for the implementation of sustainable ECB vendor mapping | In progress The ECB plans to explore options for further enhancing this functionality in line with ESG rules and regulations by end-2027. |
Evaluate the feasibility of implementing virtual collaboration as the default method for steering contracts | In progress Assessment to be carried out by the end of EMP cycle. |
Aim to raise participation in procurement training for coordinators and staff members involved in procurements | In progress All ECB staff members involved in procurements are encouraged to attend external sustainable procurement training sessions available through the ECB-wide training portal. New training opportunities are envisaged for next year. |
Establish guidelines on the use of ISO 41001 to improve logistics and facility management procurements and processes from an environmental point of view | In progress We set SMART goals and regularly review management system objectives, logistics, facility management, and procurement practices to identify environmental impacts, inefficiencies, gaps, and opportunities for improvement. To enhance efficiency and sustainability, we prioritize eco-friendly products, services, and suppliers, improve resource utilization, and plan to train teams on ISO 41001 principles and environmental sustainability practices. |
Assess the applicability of implementing sustainability criteria in IT-related procurements to lower their environmental impact | Pending |
Catalogue and provide suggestions for sustainability criteria to potentially be considered in future furniture procurements, based on the lessons learned during the upcoming relocation projects | In progress Lessons learned from the ET to GA relocation project were documented to guide future furniture procurement and support the development of a structured catalogue of sustainability criteria covering materials, durability, quality, end-of-life management, production processes, transportation, social responsibility, aesthetics, and functionality. Future recommendations include defining must-have criteria such as FSC-certified materials and modular design, promoting practices like supplier take-back programs, and identifying quick wins such as sourcing local suppliers to reduce transportation emissions. |
Encourage suppliers to use environmentally friendly packaging, delivery and collection methods | Pending |
7.7 Communication and awareness raising measures
Measure | Status |
|---|---|
Explore the possibility of assessing the water footprint of catering services | Completed Eaternity delivers information on the water footprint of meals. This information was incorporated into World Water Day communications with all staff. |
Introduce a waste separation game in newcomer sessions and for colleagues moving to the Gallileo building | Completed A waste separation game has been included in all communications for newcomers as well as for colleagues moving to the Gallileo building as part of the “Environmental Management at the ECB” training session offered by the Green ECB team. |
Extend access to the business travel dashboard to a larger internal audience at the ECB | Completed The business travel dashboard has been made available to all ECB staff. |
Develop a business area-level dashboard to enable business areas to closely monitor and manage the environmental impact of their travel-related activities | Completed The business travel dashboard has been made available to all ECB staff. |
Develop a communications campaign focusing on green travel and promoting the Sustainable Travel Guideline | Completed European Mobility Week 2025 was jointly hosted by the Green ECB team and the Travel team. The Sustainable Travel Guideline has been promoted in the latest Business Rulebook update. |
Explore the technical feasibility of allowing travellers to sort booking options by estimated CO2 emissions in the online booking tool | In progress The new business travel booking tool has been implemented as of 2026, with further functionalities scheduled to be explored until end the end of the EMP cycle. |
Include practical tips in future communication activities, to further foster behavioural change among ECB staff | In progress Practical tips have been included in the Green ECB team’s communication campaigns with future communication activities expected to include more tips for staff. |
Explore possibilities to develop a newsletter providing information on environmentally relevant topics for staff to subscribe to | In progress The creation of an internal environmental newsletter is currently being assessed. |
Explore the introduction of KPIs that could be used to track the environmental performance of catering services | In progress The collaboration with Eaternity enables the environmental performance of food to be tracked by calculating the carbon footprint. Eaternity delivers reports that are regularly shared on the intranet. |
Maintain awareness of environmental matters among staff of the catering service provider | In progress ECB staff have access to an app with detailed information on environmental matters related to catering. Information is also provided on-site in the canteens, raising awareness about the sustainability of different meal options. |
Conduct a yearly analysis of environmental data exchanged within the ENCB and share the findings internally during the network’s plenary sessions | In progress The yearly ENCB data collection process is ongoing and ENCB data will be assessed later in the year. |
Increase staff awareness about Green ECB activities within the ECB through participation in business area meetings | In progress The Green ECB team routinely participates in business area-level meetings, promoting environmental awareness and stewardship at the ECB. |
Continue fostering interinstitutional exchanges on environmental topics between the ECB and international institutions and organisations | In progress Several touchpoints with international institutions and organisations were held over the course of 2025 and more are planned for the future. |
Ensure that the number of ECB staff participating in climate and environmental management training sessions is monitored and increased | In progress Newcomers are automatically enrolled on the “Environmental Management at the ECB” course in EUREKA and receive reminders to ensure that the training is completed. The Green ECB team will review future training to ensure consistency with all the environmentally relevant training they provide to ECB staff. |
Explore possibilities to enhance the features of the travel booking tool to include gamification elements to facilitate environmentally friendly choices | In progress The new business travel booking tool has been implemented as of 2026, with further functionalities scheduled to be explored until the end of the EMP cycle. |
Create a Digital Workplace Emission Footprint Dashboard that helps ECB staff track the environmental impact of their hardware and software usage | Pending |
Conduct interviews with frequent travellers to get a clearer understanding of their demands and ways to better incorporate environmental criteria when travelling | Pending |
Explore possibilities to create an e-learning course for ECB staff focusing on green travel | Pending |
Explore possibilities to increase involvement and collaboration between Directorate Generate Information Systems and Green ECB, focusing on awareness raising in IT-related topics and their environmental impact, in line with the digital sobriety initiative and supporting the environmental footprint objective | Pending |
© European Central Bank, 2026
Postal address 60640 Frankfurt am Main, Germany
Telephone +49 69 1344 0
Website www.ecb.europa.eu
All rights reserved. Reproduction for educational and non-commercial purposes is permitted provided that the source is acknowledged.
For specific terminology, please refer to the ECB glossary (available in English only).
PDF ISBN 978-92-899-7400-4, ISSN 2811-695X, doi:10.2866/5682296, QB-01-25-174-EN-N
HTML ISBN 978-92-899-7399-1, ISSN 2811-695X, doi:10.2866/7484793, QB-01-25-174-EN-Q
The percentage changes in the chart refer to the percentage changes in the original consumption unit expressed in 2025.
According to the Deutsche Bahn certificate, direct emissions are covered by the use of renewable energy certificates and therefore counted as zero, while upstream (Well-to-Tank) emissions are compensated at 100%. Owing to a lack of data on upstream energy consumption per kilometre and the related emission factors, these emissions are currently not included under scope 3. Compensated paper is included under scope 3 and additionally reported outside these scopes.
Well-to-Tank (WTT) emissions are generated during the extraction, production, processing and transportation of fuels or energy carriers up to the point of their delivery for use, excluding emissions from their actual consumption.
The Radiative Forcing Index (RFI) is a metric quantifying the impact of aviation on the climate by comparing total radiative forcing, including non-CO₂ effects such as contrails and nitrogen oxides, with the radiative forcing caused by CO₂ emissions alone.
For the 2025 carbon footprint a switch in emission factors for household residual waste was made. In previous years an emission factor from DEFRA was used, while for 2025 an emission factor from EBeV was used. For further information, see Chapter 5 – Technical information.
Article 130 of the Treaty on the Functioning of the European Union (TFEU) outlines this principle: “When exercising the powers and carrying out the tasks and duties conferred upon them by the Treaties and the Statute of the ESCB and of the ECB, neither the European Central Bank, nor a national central bank, nor any member of their decision-making bodies shall seek or take instructions from Union institutions, bodies, offices or agencies, from any government of a Member State or from any other body. The Union institutions, bodies, offices or agencies and the governments of the Member States undertake to respect this principle and not to seek to influence the members of the decision-making bodies of the European Central Bank or of the national central banks in the performance of their tasks.”
In the ECB’s Environmental Statement 2025 the distance travelled by all staff in kilometres in 2024 was reported as 26,025,997; the correct value is 25,974,740.
Travel-related emissions from conference participants only include those generated by individuals invited by the ECB to attend on-site meetings, events or conferences. Conversely, external visitors who voluntarily visit the ECB's visitor centre are not accounted for in this calculation.
A limit of 50% was set for ECB meetings with external conference and meeting participants to take place in person over a two-year cycle (2023-24).
Well-to-Tank (WTT) emissions are generated during the extraction, production, processing and transportation of fuels or energy carriers up to the point of their delivery for use, excluding emissions from their actual consumption.