
Overview
Following weak growth in the second and third quarters of 2019, real GDP growth is expected to remain subdued in the near term. Economic sentiment indicators have declined, mainly reflecting the ongoing weakness in global trade in an environment of continued global uncertainties (related to increased protectionism, a potential sharper slowdown in China and a no-deal Brexit). Nevertheless, the most recent indicators on manufacturing show some stabilisation, while sentiment in the construction sector and consumer confidence have exhibited more resilience, and the labour market situation remains favourable. Beyond the near term, the very favourable financing conditions (fostered by the ECB’s highly accommodative monetary policy stance), the assumption of an orderly Brexit and some dissipation of other global uncertainties, the associated gradual recovery in foreign demand and notable fiscal easing should all support a sustained recovery in growth over the medium term. Overall, real GDP growth is projected to decline slightly to 1.1% in 2020, before increasing to 1.4% in 2021 and 2022. Compared with the September 2019 projections, growth has been revised down by 0.1 percentage points in 2020, as the impact of sizeable downward revisions to foreign demand is only partially offset by the impact of more supportive fiscal and monetary policies and an effective depreciation of the euro.
After weakening in 2019, HICP inflation is expected to slow further in 2020, before gradually rising to 1.6% by 2022. The profile for headline inflation in the coming quarters will be heavily affected by base effects in energy inflation. Following a rise at the end of 2019, HICP inflation excluding energy and food is expected to strengthen gradually over the projection horizon. It should be supported by strengthening economic growth, by relatively robust wage growth amid tight labour markets and by recovering profit margins as activity regains pace, aided by, among other things, the recent monetary policy package. Rising non-energy commodity prices should also support underlying inflation. Compared with the September 2019 projection exercise, HICP inflation has been revised upwards for 2020 owing to higher oil prices and revised slightly downwards for 2021 owing to lower external price pressures and weaker developments in wages and profit margins.[1]
1 Real economy
Real GDP growth in the euro area was 0.2% in the third quarter of 2019, slightly stronger than expected in the September 2019 projections. Domestic demand contributed positively to growth in the third quarter of 2019, whereas net trade and changes in inventories had a slight dampening impact. The moderate growth in exports reflects global headwinds and, in particular, sluggish global activity and foreign demand in the context of elevated global uncertainty. Private consumption growth was resilient in the third quarter and remained the main driver of growth.
Chart 1
Euro area real GDP
(quarter-on-quarter percentage changes, seasonally and working day-adjusted quarterly data)
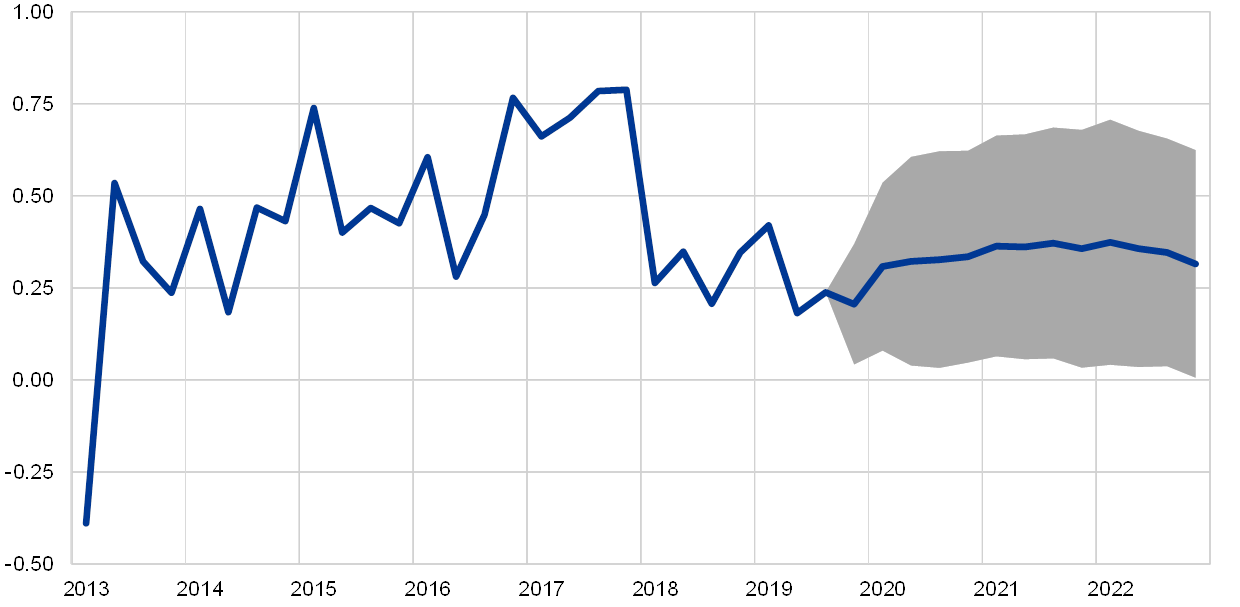
Note: The ranges shown around the central projections are based on the differences between actual outcomes and previous projections carried out over a number of years. The width of the ranges is twice the average absolute value of these differences. The method used for calculating the ranges, involving a correction for exceptional events, is documented in “New procedure for constructing Eurosystem and ECB staff projection ranges”, ECB, December 2009, available on the ECB’s website.
Short-term indicators point to subdued growth in the near term. The Economic Sentiment Indicator compiled by the European Commission improved in November, following two months of decline, but remains below the average for the third quarter. Ongoing weakness in global trade and continued high uncertainty (related to global trade disputes, the possibility of a disorderly Brexit and risks of a steeper slowdown in China) weigh on business expectations. This is particularly the case in the manufacturing sector, where sentiment remains well below its longer-term average. By contrast, sentiment in the construction sector, as well as consumer confidence, have continued to exhibit resilience. The Purchasing Managers’ Indices continue to signal divergence across sectors, with manufacturing data remaining far below the growth threshold of 50, albeit stabilising somewhat recently, while the indices related to the services and construction sectors stand above 50. Spillovers from the manufacturing to the services sector have so far been contained and are broadly as expected given the limited exposure of the services sector to the global shocks which have adversely affected manufacturing (see Box 3). Overall, the latest indicators suggest that the weak growth seen in the second and third quarters will continue into the final months of 2019 and early 2020.
Over the medium term the projections assume some dissipation of global headwinds, allowing the fundamental factors supporting the euro area expansion to regain traction (see Chart 1 and Table 1). In particular, the baseline assumes an orderly exit of the United Kingdom from the EU and no further protectionist measures (beyond those already announced), which also reduces the chances of a steep slowdown in China. Thus, the current level of uncertainty will gradually decline, allowing the fundamentals supporting growth to regain traction. Financing conditions are expected to remain very accommodative and the ECB’s monetary policy measures, including the September 2019 monetary policy package, will continue to be transmitted to the economy. More specifically, the technical assumptions imply that nominal interest rates would increase only modestly from their current low levels over the projection horizon. After remaining broadly unchanged in the near term, lending to the non-financial private sector should also strengthen modestly, spurred by an improving macroeconomic environment, very low interest rates and favourable bank lending conditions for both households and non-financial corporations. Lower deleveraging needs and improved debt servicing capacity across sectors and rising profits will also contribute to the dynamism of private expenditure. Growth in private consumption and residential investment should also benefit from relatively robust growth in wages and net worth, as well as from declining unemployment. Euro area exports are expected to benefit from the projected recovery in foreign demand and the recent depreciation of the euro in effective terms. Finally, the fiscal stance is expected to loosen over 2020-2021 and to be broadly neutral in 2022 (see Section 3).
Nevertheless, the fading-out of some tailwinds would lead to a marginally slower growth profile in the course of 2022. Employment growth is expected to slow over the medium term, mostly reflecting increasingly binding labour supply constraints in some countries.
Table 1
Macroeconomic projections for the euro area
(annual percentage changes)
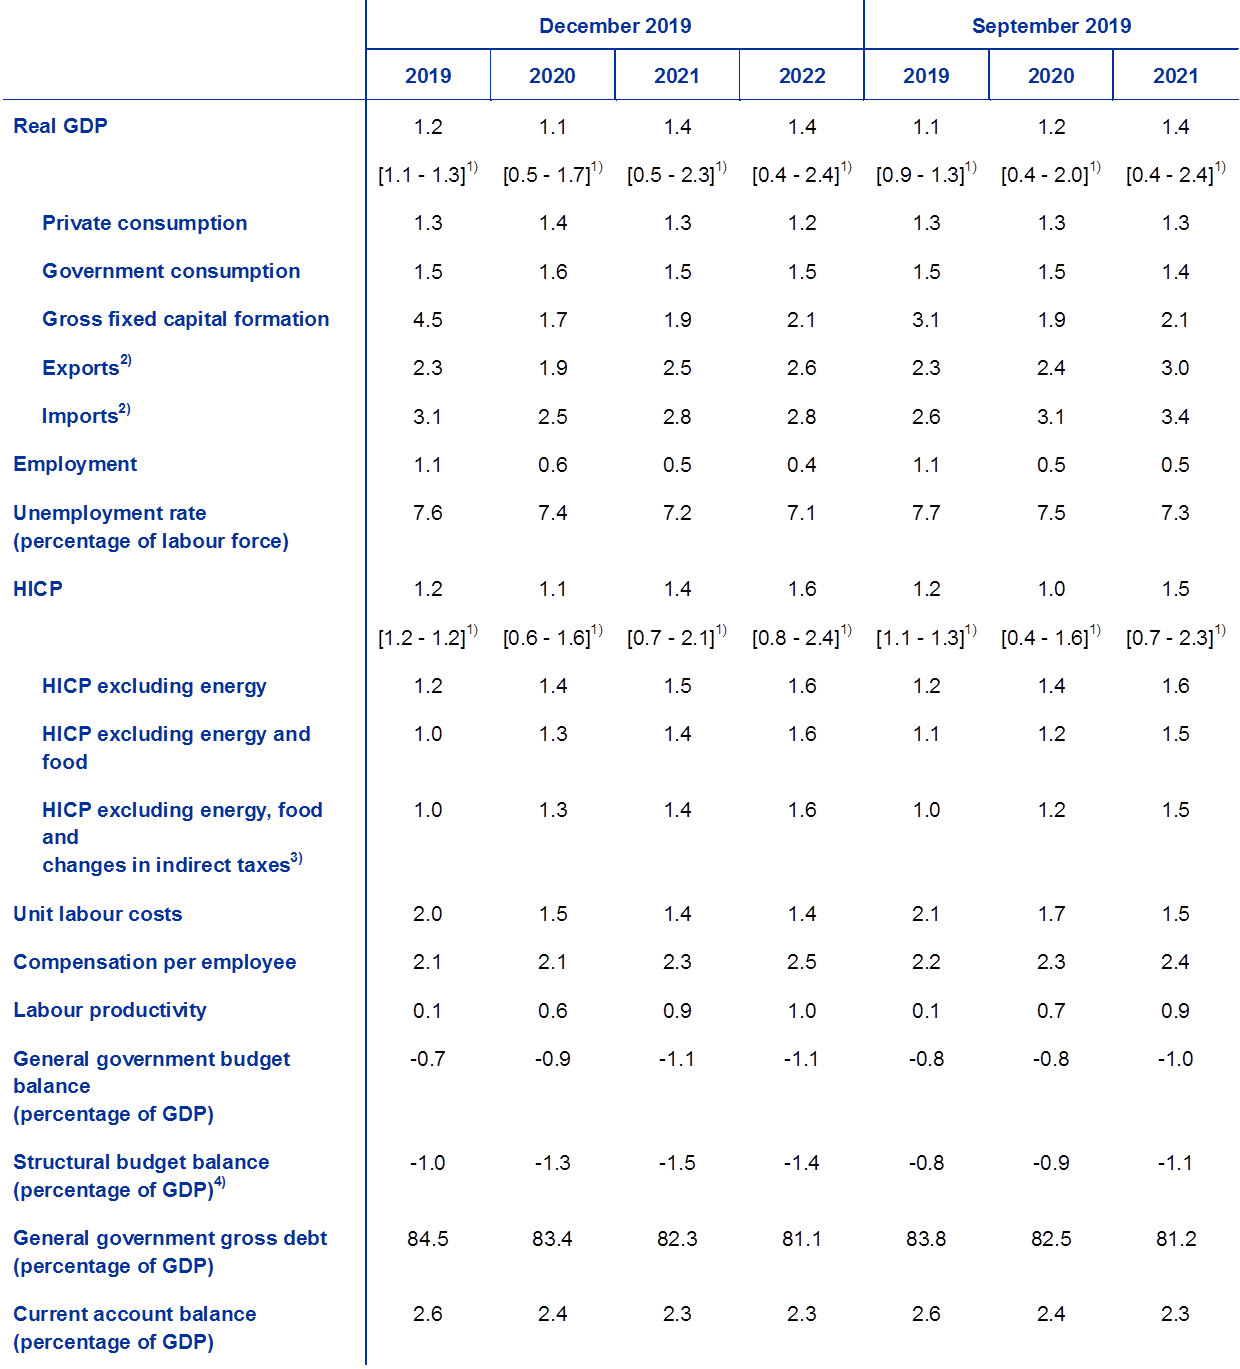
Note: Real GDP and components, unit labour costs, compensation per employee and labour productivity refer to seasonally and working day-adjusted data.
1) The ranges shown around the projections are based on the differences between actual outcomes and previous projections carried out over a number of years. The width of the ranges is twice the average absolute value of these differences. The method used for calculating the ranges, involving a correction for exceptional events, is documented in New procedure for constructing Eurosystem and ECB staff projection ranges, ECB, December 2009, available on the ECB’s website.
2) Including intra-euro area trade.
3) The sub-index is based on estimates of actual impacts of indirect taxes. This may differ from Eurostat data, which assume a full and immediate pass-through of tax impacts to the HICP.
4) Calculated as the government balance net of transitory effects of the economic cycle and temporary measures taken by governments.
Private consumption growth firmed in the third quarter of 2019 and should moderate slightly over the projection horizon. It increased from 0.2% in the second quarter of 2019 to 0.5% in the third quarter in an environment of resilient consumer confidence and favourable labour market conditions. Looking ahead, the quarterly dynamics of private consumption are expected to be slightly stronger on average in the second half of 2019 than in the first half, partly due to a lagged reaction of consumption to the government measures supporting income in a number of large countries. In 2020 still relatively favourable consumer confidence, expected further declines in unemployment and continued growth of real wages per employee suggest a pick-up in consumption growth, also supported by the positive effects of fiscal loosening in some countries. Consumption growth is expected to moderate slightly in 2021-22, in line with lower real disposable income growth in these two years.
Private consumption growth should be supported by favourable financing conditions and rising net worth. Nominal bank lending rates are projected to decline slightly further in the near term, before stabilising and then increasing modestly in 2021-22. Given that bank lending rates and bank lending volumes to households are projected to increase only moderately in the coming years, gross interest payments are expected to remain at low levels and, therefore, continue to support private consumption. In addition, net worth is projected to increase further in real terms in 2020-2022, spurred by the continued robust valuation gains on real estate holdings. Together with the earlier progress achieved in deleveraging, rising net worth should also provide moderate support to consumption.
Box 1
Technical assumptions about interest rates, exchange rates and commodity prices
Compared with the September 2019 projections, the technical assumptions include higher oil prices, a weaker effective exchange rate and higher interest rates. The technical assumptions about interest rates and commodity prices are based on market expectations, with a cut-off date of 19 November 2019. Short-term rates refer to the three-month EURIBOR, with market expectations derived from futures rates. The methodology gives an average level for these short-term interest rates of -0.4% for 2019, 2020 and 2021 and -0.3% for 2022. The market expectations for euro area ten-year nominal government bond yields imply an average level of 0.4% for 2019, 0.3% for 2020, 0.4% for 2021 and 0.6% for 2022.[2] Compared with the September 2019 projections, market expectations for short-term interest rates have been revised up by about 20 basis points for 2020 and around 25 basis points for 2021, while euro area ten-year nominal government bond yields have been revised up by around 20 basis points for 2020 and 2021.
As regards commodity prices, on the basis of the path implied by futures markets by taking the average of the two-week period ending on the cut-off date of 19 November 2019, the price of a barrel of Brent crude oil is assumed to stand at USD 63.8 in 2019 and to ease to USD 56.8 by 2022. This path implies that, in comparison with the September 2019 projections, oil prices in US dollars are higher over the full horizon. The prices of non-energy commodities in US dollars are estimated to have declined in 2019 but are assumed to rebound over the subsequent years.
Bilateral exchange rates are assumed to remain unchanged over the projection horizon at the average levels prevailing in the two-week period ending on the cut-off date of 19 November 2019. This implies an average exchange rate of USD 1.12 per euro in 2019 and USD 1.10 per euro over the period 2020-22, which is slightly lower than in the September 2019 projections. The effective exchange rate of the euro (against 38 trading partners) has depreciated by 1.6% since the September 2019 projections, reflecting an appreciation of the pound sterling, as fears of an imminent no-deal Brexit have faded, and the relative strength of some emerging market currencies.
Technical assumptions

Growth in housing investment is expected to continue, albeit at a more moderate pace. Over the short term, confidence indicators for the construction sector suggest a continued, but moderate, expansion of housing investment. Ongoing moderate growth is also suggested by an easing in the number of building permits granted, as well as by recent surveys which show a decline in the share of households planning to undertake home improvements over the next year. In the medium term, housing investment growth is expected to stabilise at low levels, reflecting increasingly binding capacity constraints in the construction sector in some countries. Adverse demographic trends in some countries are also expected to dampen housing investment in the medium term.
Business investment is expected to remain subdued in the short term, before gradually gathering pace over the projection horizon. Business investment growth is expected to remain muted in the short term, largely on account of adverse cyclical effects associated with weak external demand, a decline in capacity utilisation towards its historical average and elevated uncertainty. In the medium term, business investment growth is expected to gather pace but to be less dynamic than in previous years, reflecting the relatively modest developments in global trade as well as lower new plant capacity needs. In the longer term, however, as uncertainty is assumed to dissipate, a number of favourable fundamental factors are expected to support business investment. First, with aggregate demand remaining strong for a number of years, firms will strengthen their investment so that their productive capital stock expands. Second, financing conditions are expected to remain very supportive over the projection horizon. Third, profit margins are expected to improve, which should support investment growth. Fourth, support to business investment should come from a decline in the leverage ratio of non-financial corporations over recent years driven by a recovery in stock prices, the continued accumulation of assets and moderate debt financing growth, although consolidated gross indebtedness still stands above pre-crisis levels and is expected to increase moderately over the projection horizon. Finally, the gross interest payments of non-financial corporations have declined to record low levels in the past few years and are expected to increase only gradually in the coming years, supporting business investment.
Box 2
The international environment
The latest available data confirm a sharp decline in global real GDP growth (excluding the euro area) in 2019. Following a sharp deceleration in the second half of 2018, the global economy remained weak in the course of 2019, marking the weakest period of growth momentum since the global financial crisis. Weak manufacturing and investment, amid rising trade policy uncertainty, continue to represent the key headwinds to the global economy, only partially offset by the policy stimulus provided in several countries to counteract the weakening outlook. The economic weakness seen across emerging market economies was stronger than expected owing to idiosyncratic shocks at the turn of the year, as well as structural problems in some of these countries. Across advanced economies, supportive economic policies and some favourable temporary factors helped to cushion the slowdown.
Over the medium term, global growth is projected to pick up only slightly, reflecting a moderate recovery in emerging market economies which offsets a decline in growth in advanced economies and China. After declining to 2.9% in 2019, from 3.8% in 2018, global growth (excluding the euro area) is projected to recover gradually, reaching 3.4% by 2022. Developments in global growth are shaped by three main forces. A slowing cyclical momentum in most advanced economies and the gradual transition of China to a lower growth path will weigh on global growth. Conversely, a favourable base effect owing to a stabilisation of activity in those emerging market economies which experienced a severe recession (e.g. Argentina, Venezuela and Iran) will contribute to the recovery. Compared with the September 2019 projections, the global growth outlook has been revised down over the projection horizon, reflecting a less dynamic recovery than previously expected in some emerging market economies and, to a smaller extent, the impact of the ongoing global trade tensions.
Global trade (excluding the euro area) has declined significantly in the course of 2019, amid recurring escalations of trade tensions and slowing industrial activity. Across advanced economies, trade is projected to return to moderate growth in the third and fourth quarters of 2019, supported by a normalisation of imports in the United Kingdom (after the sharp drop in the second quarter following the exceptional stockbuilding at the start of 2019[3]) and a pick-up in imports in central and eastern European EU countries after a temporary slowdown in the second quarter. Across emerging market economies, trade is expected to dip into negative territory in the third quarter, owing to trade headwinds in China, the economic slowdown in India and political turbulence in Latin America. However, trade in these economies is expected to broadly stabilise in the fourth quarter.
The international environment
(annual percentage changes)

1) Calculated as a weighted average of imports.
2) Calculated as a weighted average of imports of euro area trading partners.
Over the medium term global imports (excluding the euro area) are projected to increase gradually but at a more subdued pace than global activity. The further escalation of global trade tensions (the effects of which will continue to be felt into 2020), a more gradual recovery in emerging market economies than previously projected and the structural rebalancing of the Chinese economy will all contribute to a postponement in the recovery of global trade. As a result, the elasticity of trade to output is projected to return to the unit value only beyond the projection horizon. Growth in global imports (excluding the euro area) is expected to decrease markedly from 4.6% in 2018 to zero this year, before recovering to growth rates of 0.8% in 2020, 2.4% in 2021 and 2.7% in 2022. After expanding by 3.7% in 2018, euro area foreign demand is expected to slow to 0.7% in 2019, before increasing gradually to 1.0% in 2020, 2.3% in 2021 and 2.6% in 2022. Compared with the September 2019 projections, it has been revised down by 0.3 percentage points in 2019, 0.9 percentage points in 2020 and 0.4 percentage points in 2021. In addition to the impact of the tariffs announced after the cut-off date for the September 2019 projections and weaker data outturns, these revisions also reflect a broad-based weakness in the import momentum across both advanced and emerging economies on the back of a subdued growth outlook.
Export growth is projected to be subdued in the near term and to gradually recover over the rest of the projection horizon. Following low rates of growth in the second and the third quarters of 2019, exports are projected to remain weak in the final months of 2019, consistent with the persisting slowdown in global trade. In the medium term, euro area exports are projected to recover and to grow broadly in line with foreign demand (see Box 2). Following a strong outturn in the second quarter of 2019 (related to a spike in investment growth in Ireland) and moderate growth in the third quarter, imports are expected to grow broadly in line with total demand (domestic demand plus exports) over the projection horizon. Overall, the contribution of net trade to real GDP growth is projected to be broadly neutral over the entire projection horizon.
Employment growth is projected to be subdued, partially reflecting temporary factors in the short term, while labour supply constraints are expected to emerge later in the horizon. Headcount employment grew by 0.1% in the third quarter of 2019, indicating a slowing of momentum compared with the quarterly growth rates seen in the past four years. Employment growth is projected to remain rather subdued over the medium term, owing to labour supply constraints. In addition, towards the end of the projection horizon, labour demand is also projected to moderate in line with the slowdown in activity.
Labour force growth is expected to moderate over the projection horizon. The labour force is expected to continue to expand, reflecting the projected net immigration of workers (including the expected integration of refugees) and ongoing increases in the participation rate. Nevertheless, these factors are projected to fade over the projection horizon and the adverse impact of the ageing of the population on labour force growth is expected to increase, as older cohorts leave the workforce in higher numbers than younger cohorts enter it.
The euro area unemployment rate is expected to decline steadily to 7.1% in 2022. The unemployment rate declined to 7.5% in October 2019, which is the lowest level observed since 2008. Unemployment rates are expected to continue to exhibit substantial differences across euro area countries.
Labour productivity growth is projected to recover over the projection horizon. Following its strong momentum in 2017, per worker and per hour labour productivity growth declined in 2018, reflecting the unexpected weakening of activity. Productivity growth will also be muted in 2019, owing to weak output growth but still fairly robust employment growth. Over the remainder of the horizon, productivity growth is expected to pick up, as activity regains momentum, while labour input growth slows down. Over the medium term, year-on-year labour productivity growth should converge towards its pre-crisis average of 1.0%.[4]
Compared with the September 2019 projections, real GDP growth has been revised down in 2020, while it is unrevised for 2021. Growth in 2020 has been revised down as the impact of the sizeable downward revisions to foreign demand is only partially offset by the impact of more supportive fiscal and monetary policies, and an effective depreciation of the euro. In 2021 the impact of a more limited further downward revision to foreign demand is balanced by more supportive policies.
Box 3
Cross-country and cross-sector spillovers in the euro area
Two concomitant developments have shaped economic growth in the euro area since the beginning of 2018: (i) a weakening in global trade, also in the light of rising trade tensions and persistent global policy uncertainty and (ii) a decoupling between the manufacturing and services sectors. Manufacturing activity, as reflected in the Purchasing Managers’ Index (PMI) (see Chart A), has since early 2018 been severely affected by the decline in global trade as well as by some adverse domestic factors, particularly related to the German car industry.[5] Activity in the services sector as a whole has thus far remained relatively resilient, although recent survey-based indicators point to some weakness in services.
Chart A
Euro area PMI indicators
(diffusion index, 50 = no change)

Sources: Markit.
Note: The latest observation is November 2019.
Model results suggest that global factors have been the key reason for the weakness in the manufacturing output PMI across the large euro area countries since January 2018 (see Chart B).[6] Adverse shocks specific to the euro area manufacturing sector have also contributed to the fall in the manufacturing output PMI indicators.
Services have also been somewhat negatively affected by global and domestic factors but have exhibited more resilience (see Chart B). The services output PMI has also declined since January 2018, albeit to a much lesser extent than the manufacturing output PMI. The model results suggest that global factors were also the key contributor to the decline in services output PMI, although their impact was less pronounced than in the manufacturing sector. Euro area manufacturing shocks played a limited role for the decline in the services output PMI.
Chart B
Drivers of euro area countries’ manufacturing and services PMI – domestic versus foreign factors
(difference in the diffusion index)

Sources: Markit and ECB calculations.
Note: Shocks are identified using the absolute magnitude restrictions method (De Santis, R. A. and Zimic, S., “Spillovers among sovereign debt markets: Identification through absolute magnitude restrictions”, Journal of Applied Econometrics, Vol. 33, pp. 727-747, 2018). “MAN” stands for manufacturing and “SER” for services. The latest observation is October 2019.
In sum, the results suggest that there have been some negative spillovers from global factors and from manufacturing to services, although the services sector as a whole has so far remained relatively resilient. This likely reflects the fact that the current adverse shocks are associated with trade in goods and the car sector and are thus manufacturing sector-specific, while at the same time activity in all sectors has been cushioned by favourable financing conditions reflecting the highly accommodative stance of monetary policy.
2 Prices and costs
HICP inflation is expected to decline to 1.1% in 2020 and then rise to 1.4% in 2021 and 1.6% in 2022 (see Chart 2). Headline inflation rates are likely to be moderate but somewhat volatile until the second quarter of 2020, mainly reflecting base effects in HICP energy inflation. Until the beginning of 2021, HICP energy inflation will remain negative and turn positive only in the second quarter of 2021 as the oil price futures curve stabilises and some tax increases also take effect. HICP food inflation is envisaged to hover around 1.8%. After a moderate rise by end-2019, HICP inflation excluding energy and food will move sideways in the course of 2020 and increase to 1.4% in 2021 and 1.6% in 2022. The upward path of HICP inflation excluding energy and food is expected to be supported by strengthening economic activity, by relatively robust wage growth amid tight labour markets, and by recovering profit margins as activity regains pace, aided, among other things, by the ECB’s September 2019 monetary policy measures. Rising non-energy commodity prices are also expected to provide some support to HICP inflation excluding energy and food.
Chart 2
Euro area HICP
(year-on-year percentage changes)

Note: The ranges shown around the central projections are based on the differences between actual outcomes and previous projections carried out over a number of years. The width of the ranges is twice the average absolute value of these differences. The method used for calculating the ranges, involving a correction for exceptional events, is documented in “New procedure for constructing Eurosystem and ECB staff projection ranges”, ECB, December 2009, available on the ECB’s website.
After easing in the second half of 2019, growth in compensation per employee is projected to gradually gain momentum as labour markets remain tight. The main driver of wage growth is the envisaged increase in labour market tightness in some parts of the euro area. Beyond the cyclical momentum, the pick-up in headline inflation over the last two years can be expected to contribute to robust wage growth in euro area countries where the wage formation process includes backward-looking elements. In addition, some countries have introduced increases in minimum wages that might pass through to the wage distribution.
Growth in unit labour costs is projected to decrease until the beginning of 2021 and move sideways thereafter. Following a spike in 2019 in the context of the cyclical slowdown in productivity, unit labour cost growth is expected to moderate in the course of 2020 and stay at 1.4% thereafter. The slowdown in unit labour cost growth in 2020 reflects a pick-up in productivity growth against the background of flat wage growth, while the subsequent flat profile denotes a continued rise in productivity growth combined with a pick-up in wage growth.
After contracting in 2019, profit margins are expected to continue declining in 2020 before recovering slightly over the remainder of the projection horizon. Profit margins have been squeezed since mid-2018 and are expected to remain compressed in the course of 2020 owing to the weakening of economic activity, in particular in the manufacturing sector. In this environment, they are buffering the productivity-related acceleration in unit labour costs. In addition, past increases in oil prices have weighed on the terms of trade, adversely affecting profit margin developments. These factors should become less important as oil prices stabilise and economic activity regains pace, with past increases in wages gradually being passed on to prices.
Following a slowdown in the course of 2019, external price pressures are expected to rise moderately until 2021 and to be stable thereafter. The annual growth rate of the import deflator is estimated to have decreased in 2019 and is expected to rise gradually in 2020 and 2021. This profile is largely determined by movements in oil prices, which have pushed down import prices in 2019 and, as suggested by the oil futures curve, will continue to dampen them somewhat over the projection horizon, but to a notably lesser extent. Rising non-oil commodity prices and underlying global price pressures should provide support for import price inflation.
Compared with the September 2019 exercise, the projection for HICP inflation has been revised up for 2020 and down for 2021. These revisions are partly explained by the energy component, which has been revised upwards in 2020 but downwards in 2021, owing to higher oil prices in the short term and a slightly more downward-sloping oil price futures curve. Food price inflation has also been revised down for 2020 and 2021, partly reflecting lower inflation for international food commodity prices. The projection for HICP inflation excluding food and energy has been revised slightly up in 2020 and slightly down in 2021, reflecting the interplay between, on the one hand, upward pressures from a weaker exchange rate and the indirect effects of higher oil prices, and, on the other, weaker global prices and a lower path for wages and profit margins.
3 Fiscal outlook
The euro area fiscal stance[7] is assessed to be expansionary over 2019-21 and broadly neutral in 2022. The projected loosening of the fiscal stance over 2019-21 mostly stems from cuts in direct taxes and higher government transfers, and to some extent from higher government investment and consumption. In 2022 the fiscal stance is projected to be broadly neutral, with some limited further direct tax cuts and additional expenditure.
The euro area budget balance is projected to decline steadily over 2019-21 and to stabilise in 2022, while the debt ratio remains on a downward path. The decline in the budget balance over 2019-21 stems from the expansionary fiscal stance. This is partly compensated by lower interest expenditure, while the cyclical component remains unchanged over the projection horizon. The declining government debt ratio over the projection horizon is supported by the favourable interest rate-growth differential and by the primary surplus, although the latter is diminishing over time.
The euro area fiscal outlook for 2020-21 has deteriorated somewhat compared with the September 2019 projections. Following a limited upward revision in 2019, the higher budget deficit in 2020 and 2021 reflects the additional fiscal loosening, while the cyclical component and the interest payment projections remain broadly unchanged. The debt ratio is projected to be on a slightly higher path than in the September 2019 projections, on account of upward revisions in the historical data, lower projected primary surpluses and less favourable interest rate-growth differentials over 2020-21.
Box 4
Sensitivity analyses
Projections rely heavily on technical assumptions regarding the evolution of certain key variables. Given that some of these variables can have a large impact on the projections for the euro area, examining the sensitivity of the latter with respect to alternative paths of these underlying assumptions can help in the analysis of risks around the projections. This box discusses the uncertainty around some key underlying assumptions and the sensitivity of the projections with respect to these variables.
1) Alternative oil price paths
This sensitivity analysis aims to assess the implications of alternative oil price paths. The technical assumptions for oil price developments underlying the baseline, based on oil futures markets, predict a slightly declining profile for oil prices, with the price per barrel of Brent crude oil at about USD 57 by the end of 2022. Two alternative paths of the oil price are analysed. The first is based on the 25th percentile of the distribution provided by the option-implied densities for the oil price on 19 November 2019. This path implies a gradual decrease of the oil price to USD 46.7 per barrel in 2022, which is 18.1% below the baseline assumption for that year. Using the average of the results from a number of staff macroeconomic models, this path would have a small upward impact on real GDP growth (around 0.1 percentage points in 2021), while HICP inflation would be 0.4 percentage points lower in 2020, 0.3 percentage points lower in 2021 and 0.2 percentage points lower in 2022. The second path is based on the 75th percentile of the same distribution and implies an increase of the oil price to USD 78.7 per barrel in 2022, which is 38.1% above the baseline assumption for that year. This path would entail HICP inflation being higher by 0.7 percentage points in 2020, 0.6 percentage points in 2021 and 0.3 percentage points in 2022, while real GDP growth would be slightly lower (by 0.1 percentage points in 2020, 2021 and 2022).
2) An alternative exchange rate path
This sensitivity analysis investigates the effects of a strengthening of the exchange rate of the euro. This scenario is consistent with the distribution of the option-implied risk-neutral densities for the USD/EUR exchange rate on 19 November 2019, which is heavily skewed towards an appreciation of the euro. The 75th percentile of that distribution implies an appreciation of the euro vis-à-vis the US dollar to an exchange rate of USD 1.25 per euro in 2022, which is 12.8% above the baseline assumption for that year. The corresponding assumption for the nominal effective exchange rate of the euro reflects historical regularities, whereby changes in the USD/EUR exchange rate correspond to changes in the effective exchange rate with an elasticity of just above one half. In this scenario, the average of the results from a number of staff macroeconomic models points to both real GDP growth and HICP inflation being 0.2 percentage points lower in 2020, 0.4-0.5 percentage points lower in 2021 and 0.2-0.3 percentage points lower in 2022.
Box 5
Forecasts by other institutions
A number of forecasts for the euro area are available from both international organisations and private sector institutions. However, these forecasts are not strictly comparable with one another or with the ECB/Eurosystem staff macroeconomic projections, as they were finalised at different points in time. Additionally, they use different (partly unspecified) methods to derive assumptions for fiscal, financial and external variables, including oil and other commodity prices. Finally, there are differences in working day adjustment methods across different forecasts (see the table).
The staff projections for real GDP growth and HICP inflation are within the range of forecasts from other institutions and private sector forecasters.
Comparison of recent forecasts for euro area real GDP growth and HICP inflation
(annual percentage changes)
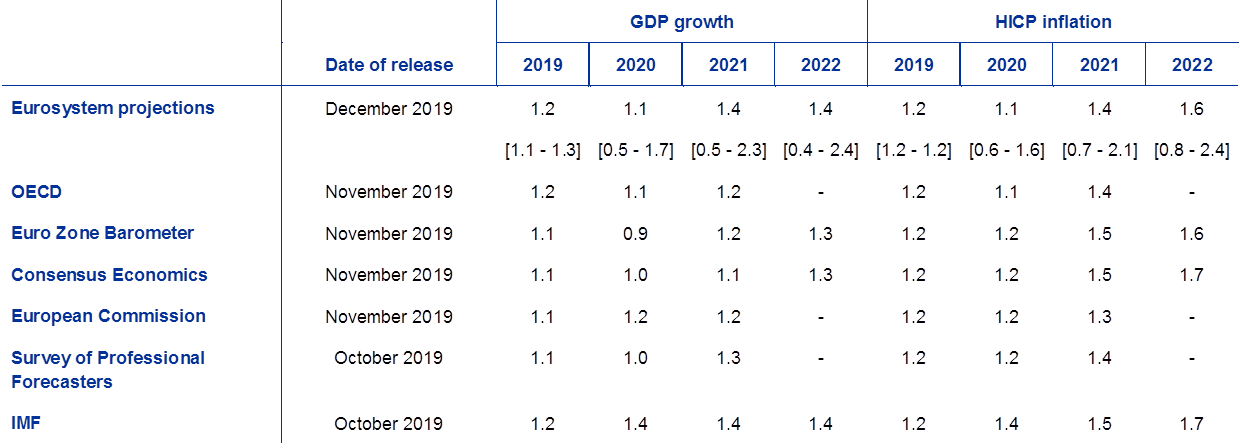
Sources: OECD Economic Outlook, November 2019; MJEconomics for the Euro Zone Barometer, November 2019 survey for 2019 and 2020, October 2019 survey for 2021 and 2022; Consensus Economics Forecasts, November 2019 survey for 2019 and 2020, October 2019 survey for 2021 and 2022; European Commission Economic Forecast, Autumn 2019 Economic Forecast; ECB Survey of Professional Forecasters, 2019 Q4; IMF World Economic Outlook, October 2019.
Notes: The Eurosystem and ECB staff macroeconomic projections and the OECD forecasts both report working day-adjusted annual growth rates, whereas the European Commission and the IMF report annual growth rates that are not adjusted for the number of working days per annum. Other forecasts do not specify whether they report working day-adjusted or non-working day-adjusted data.
© European Central Bank, 2019
Postal address 60640 Frankfurt am Main, Germany
Telephone +49 69 1344 0
Website www.ecb.europa.eu
All rights reserved. Reproduction for educational and non-commercial purposes is permitted provided that the source is acknowledged.
For specific terminology please refer to the ECB glossary (available in English only).
PDF ISSN 2529-4687, QB-CF-19-002-EN-N
HTML ISSN 2529-4687, QB-CF-19-002-EN-Q
- The cut-off date for technical assumptions, such as for oil prices and exchange rates, was 19 November 2019 (see Box 1). The cut-off date for including other information in this exercise was 27 November 2019. The current macroeconomic projection exercise covers the period 2019-22. Projections over such a long horizon are subject to very high uncertainty, and this should be borne in mind when interpreting them. See the article entitled “An assessment of Eurosystem staff macroeconomic projections” in the May 2013 issue of the ECB’s Monthly Bulletin. See http://www.ecb.europa.eu/pub/projections/html/index.en.html for an accessible version of the data underlying selected tables and charts.
- The assumption for euro area ten-year nominal government bond yields is based on the weighted average of countries’ ten-year benchmark bond yields, weighted by annual GDP figures and extended by the forward path derived from the ECB’s euro area all-bonds ten-year par yield, with the initial discrepancy between the two series kept constant over the projection horizon. The spreads between country-specific government bond yields and the corresponding euro area average are assumed to be constant over the projection horizon.
- In the first quarter of 2019, UK imports grew by 10% (quarter on quarter) on account of stockpiling ahead of the first Brexit deadline of 29 March. Subsequently, in the second quarter, an unwinding of stockpiling led to a contraction in imports by 13%.
- The average between 1999 and 2007.
- See “Domestic versus foreign factors behind the fall in euro area industrial production”, Issue 6, Economic Bulletin, ECB, 2019.
- The relative importance of foreign and domestic shocks in explaining the manufacturing and services output PMI indicators is assessed using a structural vector autoregression (SVAR) model. The exercise uses the manufacturing output PMI and the services output PMI for France, Germany, Italy and Spain, as well as the euro area PMI for new export orders. The model is estimated over the period January 2007 to October 2019. The identification of the shocks is based on the absolute magnitude restriction method: a shock in the home country has, at impact, a larger effect in absolute value on home variables than on foreign variables. In addition, it is assumed that the spillover from trade to manufacturing always has a positive sign. The identification method is explained in De Santis, R. A. and Zimic, S., “Spillovers among sovereign debt markets: Identification through absolute magnitude restrictions”, Journal of Applied Econometrics, Vol. 33, pp. 727-747, 2018.
- The fiscal policy stance is measured as the change in the cyclically adjusted primary balance net of government support to the financial sector.
-
12 December 2019
-
27 December 2019