
Liquidity conditions and monetary policy operations from 28 April to 27 July 2021
Published as part of the ECB Economic Bulletin, Issue 6/2021.
This box describes the ECB’s monetary policy operations and liquidity developments during the third and fourth reserve maintenance periods of 2021. Together, these two maintenance periods ran from 28 April to 27 July 2021 (the “review period”).
Excess liquidity in the euro area banking system continued to rise during the review period, reaching a record level of €4,191.5 billion. This was largely due to the asset purchases conducted under the pandemic emergency purchase programme (PEPP) and the asset purchase programme (APP), as well as the settlement of the eighth operation of the third series of targeted long-term refinancing operations (TLTRO III.8). The increase in the outright portfolios accelerated following the 11 March and 10 June Governing Council decisions to conduct purchases under the PEPP at a significantly higher pace over the second and third quarters than during the first months of the year. The Governing Council reaffirmed these decisions at its meeting on 22 July.
Liquidity needs
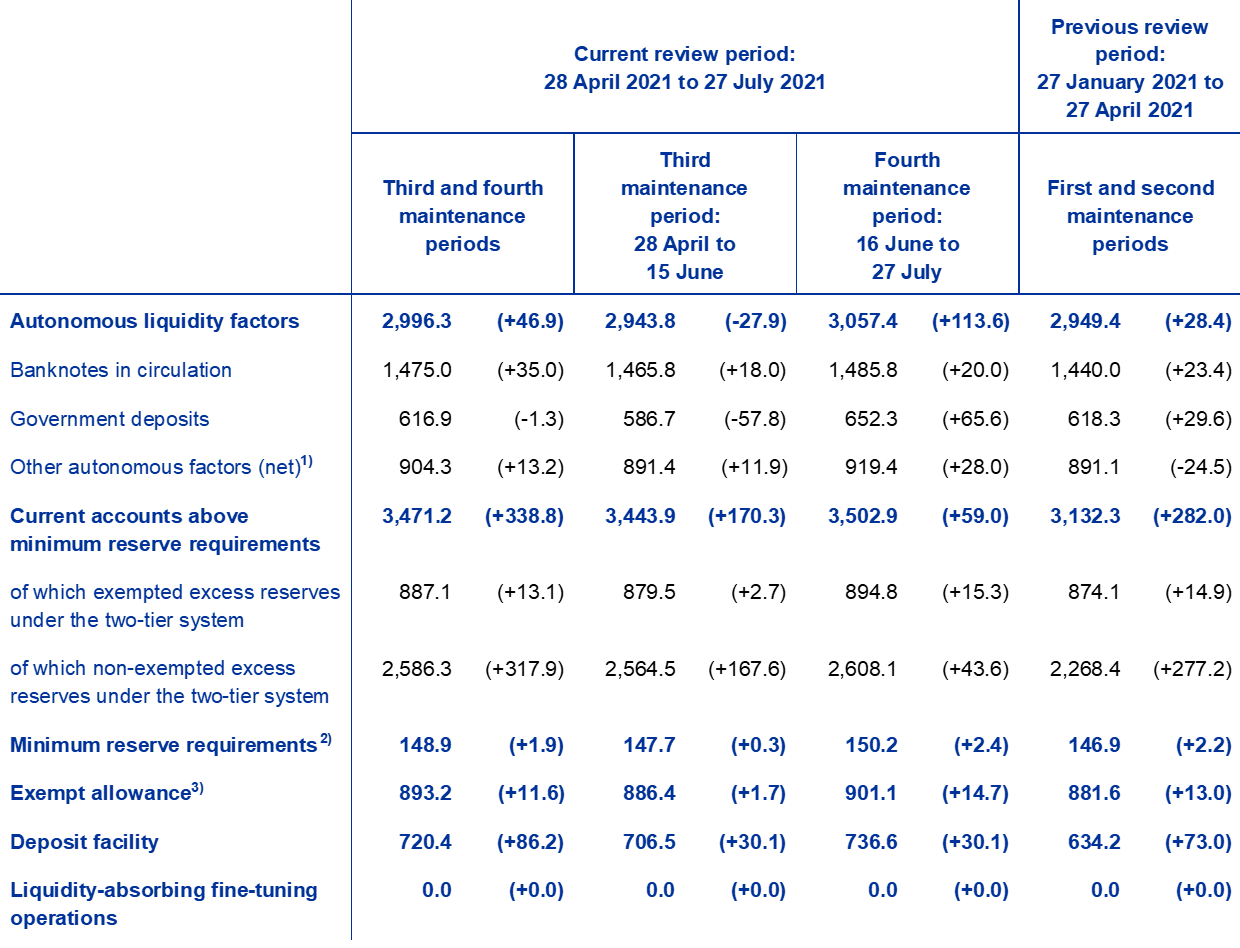
The average daily liquidity needs of the banking system, defined as the sum of net autonomous factors and reserve requirements, increased by €88.8 billion to €2,119.4 billion in the review period. This significant increase compared with the previous two maintenance periods was almost totally imputable to an €86.8 billion increase in net autonomous factors, which reached €1,970.6 billion (see the section of Table A entitled “Other liquidity-based information”). The minimum reserve requirements increased only marginally, by €1.9 billion to €148.9 billion.
Liquidity-absorbing autonomous factors in the review period increased mainly on account of banknotes in circulation, while government deposits declined slightly. Banknotes in circulation increased in the review period by €35 billion to €1,475 billion. Declining only marginally by €1.3 billion, government deposits remained very high at €616.9 billion, although this figure is below the record high of €729.8 billion recorded in the sixth maintenance period of 2020. In total, liquidity-absorbing autonomous factors increased by €46.9 billion to €2,996.3 billion.
Liquidity-providing autonomous factors decreased by €39.9 billion.[1] This consisted of a €28.6 billion drop in net assets denominated in euro and a €11.2 billion drop in net foreign assets. Table A provides an overview of the autonomous factors discussed above and changes to them over the review period.
Table A
Eurosystem liquidity conditions
Liabilities
(averages; EUR billions)
Source: ECB.
Notes: All figures in the table are rounded to the nearest €0.1 billion. Figures in brackets denote the change from the previous review or maintenance period.
1) Computed as the sum of the revaluation accounts, other claims and liabilities of euro area residents, capital and reserves.
2) Memo item that does not appear on the Eurosystem balance sheet and therefore should not be included in the calculation of total liabilities.
3) Exempted and non-exempted excess reserves are explained here.
Assets
(averages; EUR billions)

Source: ECB.
Notes: All figures in the table are rounded to the nearest €0.1 billion. Figures in brackets denote the change from the previous review or maintenance period.
Other liquidity-based information
(averages; EUR billions)

Source: ECB.
Notes: All figures in the table are rounded to the nearest €0.1 billion. Figures in brackets denote the change from the previous review or maintenance period.
1) Computed as the sum of net autonomous factors and minimum reserve requirements.
2) Computed as the difference between autonomous liquidity factors on the liability side and autonomous liquidity factors on the asset side. For the purposes of this table, items in the course of settlement are also added to net autonomous factors.
3) Computed as the sum of current accounts above minimum reserve requirements and the recourse to the deposit facility minus the recourse to the marginal lending facility.
Interest rate developments
(averages; percentages)
Source: ECB.
Notes: Figures in brackets denote the change from the previous review or maintenance period.
1) Computed as the euro short-term rate (€STR) plus 8.5 basis points since 1 October 2019. Differences in the changes shown for the euro overnight index average (EONIA) and the €STR are due to rounding.
Liquidity provided through monetary policy instruments
The average amount of liquidity provided through monetary policy instruments increased by €513.8 billion to €6,311 billion during the review period (see Chart A). Around 54% of the increase was the result of ongoing net purchases under the asset purchase programmes, primarily the PEPP, while the remaining 46% originated from credit operations, in this context almost exclusively TLTRO III operations.
Chart A
Evolution of liquidity provided through open market operations and excess liquidity
(EUR billions)
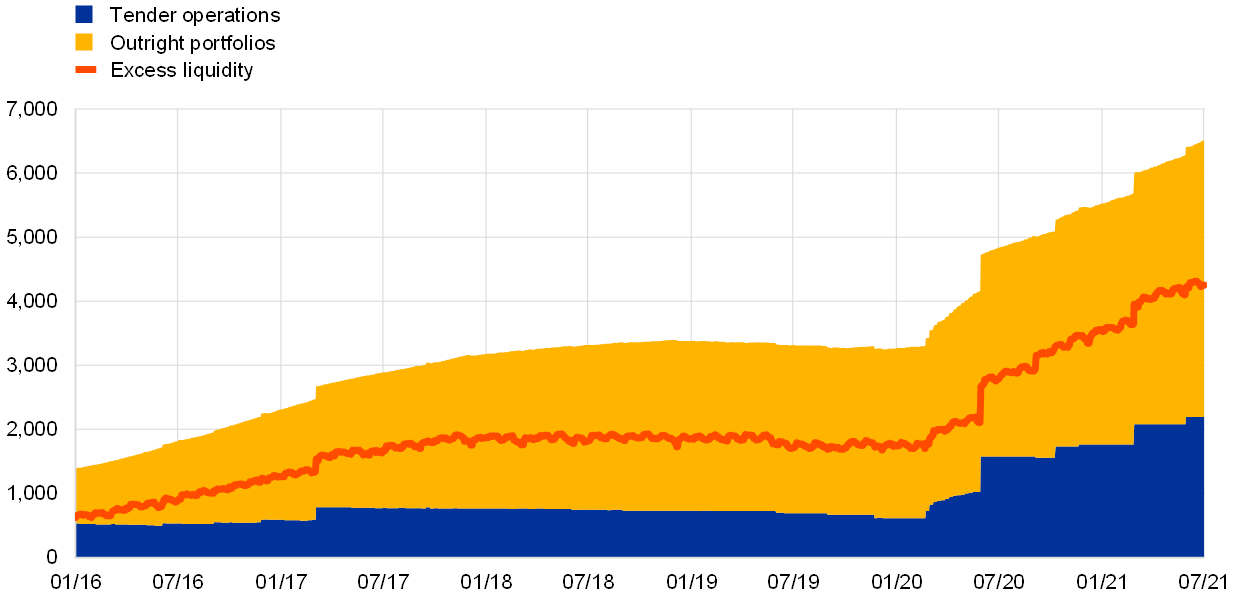
Source: ECB.
Note: The latest observation is for 27 July 2021.
The average amount of liquidity provided through credit operations increased by €234.4 billion during the review period. This increase was mainly driven by the effect of the €330.5 billion allotted in the seventh operation of the TLTRO III series at the end of March and the €109.8 billion injected via the eighth operation settled in June. An additional €0.5 billion in liquidity was added in the second operation of the four additional pandemic emergency long-term refinancing operations (PELTRO) announced in December and settled in June. The main refinancing operations (MROs) and three-month LTROs continued to play a marginal role, with the average recourse to both regular refinancing operations decreasing by €0.2 billion and €0.4 billion respectively compared with the previous review period, to a new record low of €0.1 billion each.
At the same time, outright portfolios increased by €279.4 billion to €4,162.8 billion, owing to net purchases under the PEPP and the APP. Average holdings in the PEPP increased by €232.6 billion to €1,131.4 billion compared with the average holdings in the previous review period. Purchases under the PEPP represented the largest increase by far across all asset purchase programmes, followed by the public sector purchase programme (PSPP) and the corporate sector purchase programme (CSPP), which increased by €37.7 billion to €2,412 billion and by €15.9 billion to €279.3 billion respectively. A reduction of €8.6 billion was related to maturing securities held in non-active programmes.
Excess liquidity
Average excess liquidity increased by €425 billion, reaching a new record high of €4,191.5 billion (see Chart A). Excess liquidity is the sum of banks’ reserves above the reserve requirement and the recourse to the deposit facility net of any recourse to the marginal lending facility. It reflects the difference between the total liquidity provided to the banking system and banks’ liquidity needs. Banks’ current account holdings in excess of minimum reserve requirements grew by €338.8 billion to €3,471.2 billion, whereas the average recourse to the deposit facility increased by €86.2 billion to €720.4 billion.
Excess reserves exempted from the negative deposit facility rate under the two-tier system[2] rose by €13.1 billion to €887.1 billion. Non-exempted reserves increased by €317.9 billion, reaching €2,586.3 billion as excess liquidity continued to grow. The aggregate utilisation rate of the exemption allowance, i.e. the ratio between exempted reserves and the maximum exempted amount[3], has remained above 98% since the third maintenance period of 2020 and rose marginally from 99.1% to 99.3%. The share of exempted excess reserves out of total excess liquidity stood at 21.2% compared with 23.2% in the previous review period.
Interest rate developments
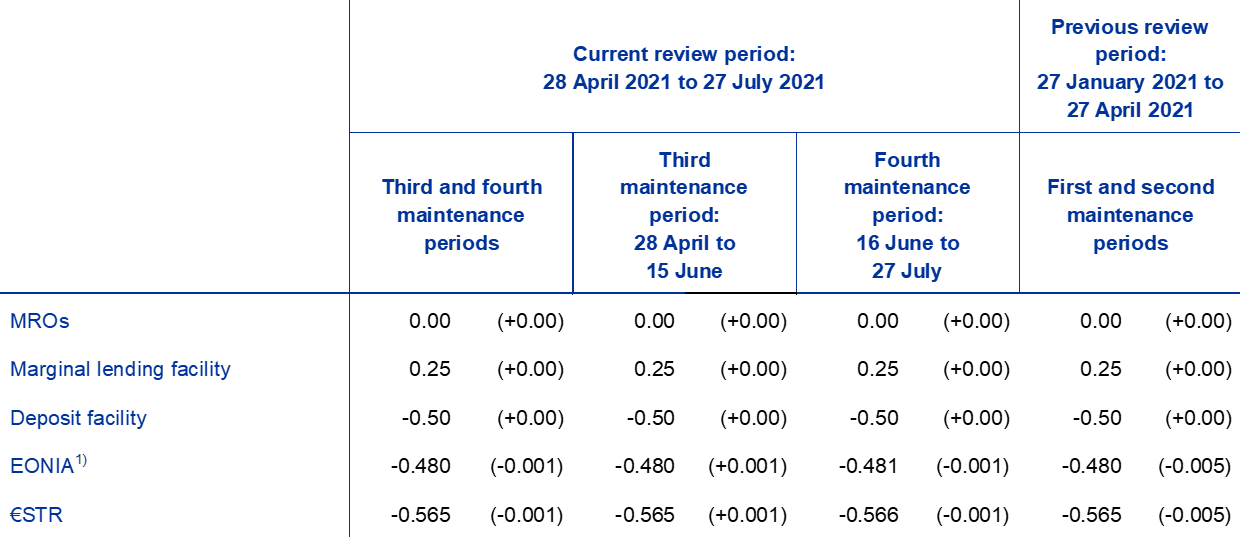
The average €STR remained broadly unchanged at -56.5 basis points during the review period. The increase in excess liquidity did not affect the €STR, which continues to be relatively inelastic even to substantial fluctuations in liquidity. As of October 2019 the EONIA is calculated as the €STR plus a fixed spread of 8.5 basis points. The EONIA therefore moved, and will continue to move, in lockstep with the €STR until it is discontinued on 3 January 2022. ECB policy rates – the rates on the deposit facility, MRO and marginal lending facility – were left unchanged during the review period.
- For further details on autonomous factors, see “The liquidity management of the ECB”, Monthly Bulletin, ECB, May 2002.
- More information about the two-tier system for remunerating excess reserve holdings is available here.
- The maximum exempted amount is measured as the sum of the minimum reserves and the allowance, which is equal to six times the minimum reserves amount.