Statistics on payments and securities trading, clearing and settlement – data for 2006 –
The European Central Bank (ECB) is today publishing statistics for 2006 on payments and securities trading, clearing and settlement. These statistics cover all countries in the European Union (EU).
Several key indicators outlining trends in the EU and the euro area are given below. The full data series can be downloaded from the ECB’s Statistical Data Warehouse (SDW).
Payment instruments
The use of cashless payment instruments has steadily increased over the past few years. From 2000 to 2006 the number of cashless payment transactions (by non-banks) in the EU rose by 7% per year on average, while the value of such transactions rose by 5% per year [1].

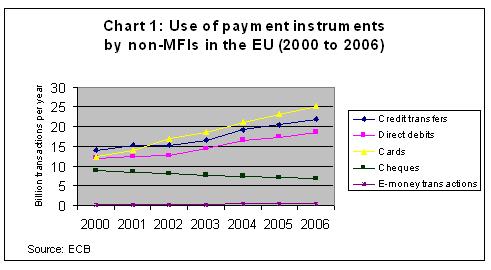
With regard to the use of the various payment instruments, as measured by the number of transactions, several trends are noteworthy (see Chart 1). Between 2000 and 2006 the use of cards increased steadily and more quickly (at a rate of 15% p.a.) than the use of either credit transfers or direct debits (both of which increased at a rate of approximately 8% p.a.). In fact, credit transfers have lost their long-time leading role to credit and debit cards. The use of cheques has steadily declined, at an average rate of around 5% per year. The number of e-money transactions has grown very rapidly (at a rate of more than 20% p.a.), but these still account for only 0.6% of the total number of cashless transactions.
Table 1: Relative importance of payment instruments in the EU(2006 data (2004 for the Czech Republic); percentages of total volume of transactions)
| Credit transfers | Direct debits | Cards | Cheques | |
|---|---|---|---|---|
| Belgium | 42.5 | 11.7 | 40.3 | 0.7 |
| Bulgaria | 68.2 | 1.6 | 30.2 | 0.0 |
| Czech Republic | 52.9 | 34.8 | 10.9 | 0.0 |
| Denmark | 21.6 | 14.2 | 62.6 | 1.6 |
| Germany | 42.2 | 42.8 | 14.2 | 0.6 |
| Estonia | 39.7 | 7.1 | 53.1 | 0.0 |
| Ireland | 27.6 | 18.0 | 33.8 | 20.6 |
| Greece | 20.0 | 11.2 | 49.0 | 19.0 |
| Spain | 14.5 | 44.7 | 35.7 | 3.5 |
| France | 17.5 | 18.3 | 37.6 | 25.6 |
| Italy | 29.6 | 13.3 | 34.3 | 12.6 |
| Cyprus | 14.8 | 15.9 | 32.3 | 37.0 |
| Latvia | 63.7 | 2.2 | 34.1 | 0.0 |
| Lithuania | 52.1 | 3.9 | 43.5 | 0.2 |
| Luxembourg | 48.3 | 10.1 | 38.5 | 0.3 |
| Hungary | 76.7 | 9.3 | 13.8 | 0.0 |
| Malta | 17.2 | 3.1 | 27.0 | 52.8 |
| Netherlands | 32.7 | 27.2 | 36.3 | 0.0 |
| Austria | 47.5 | 35.7 | 15.2 | 0.3 |
| Poland | 71.3 | 1.1 | 27.5 | 0.0 |
| Portugal | 10.1 | 11.3 | 63.6 | 15.0 |
| Romania | 75.7 | 10.6 | 9.5 | 4.0 |
| Slovenia | 54.9 | 12.6 | 32.2 | 0.3 |
| Slovakia | 66.8 | 16.1 | 17.0 | 0.0 |
| Finland | 42.5 | 5.1 | 52.3 | 0.0 |
| Sweden | 29.2 | 10.0 | 60.7 | 0.1 |
| United Kingdom | 21.2 | 19.8 | 46.6 | 12.3 |
Source: ECB
Sizeable cross-country differences persist as regards the choice of payment instruments, as shown in Table 1. For example, credit transfers account for more than 70% of all cashless transactions in Hungary, Poland and Romania, while cards account for more than 60% of such transactions in Denmark, Portugal and Sweden, and cheques account for more than 50% of cashless transactions in Malta. In several countries, the popularity of two instruments is broadly similar. This is the case, for instance, for credit transfers and cards in Belgium, Ireland, Italy and the Netherlands, for credit transfers and direct debits in Germany, and for cards and cheques in Cyprus. In four EU countries (Malta, Cyprus, France and Ireland), cheques still account for over 20% of the total number of transactions effected using cashless payment instruments. Yet, in these countries, too, the use of cheques has steadily declined over the past few years.
Retail payment systems
There are 38 retail payment systems operating in the EU, of which 15 are located in the euro area. In 2006 retail payment systems processed 35 billion transactions, with a total value of €26.4 trillion.

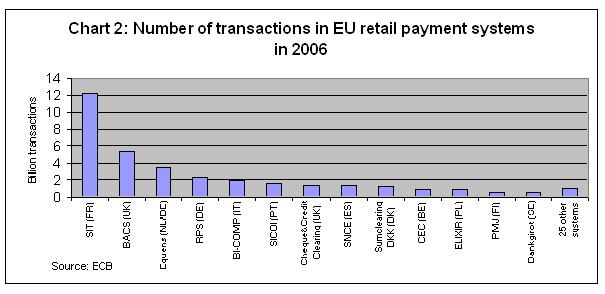
There is a notable degree of concentration in retail payment systems. The French system SIT is by far the largest retail payment system in the EU, mainly owing to the high degree of dematerialisation in payment instruments in France and the migration to SIT of transactions previously exchanged in other systems. The three largest systems (SIT in France, BACS in the United Kingdom and Equens in the Netherlands and Germany) processed 60% of the volume of all transactions in EU retail payment systems in 2006.

The number of transactions processed in retail payment systems in the EU has been growing steadily over the past few years, at an average rate of over 4% p.a., as illustrated in Chart 3. At the same time, the value of those transactions has grown at a rate of slightly more than 3% p.a., which is somewhat weaker than average nominal EU GDP growth over this period (which stands at close to 4% p.a.).
Securities settlement systems (SSSs)
There are 42 central securities depositories operating in the EU, of which 18 are located in the euro area. In 2006 these processed 312 million delivery instructions, with a total value of €745 trillion. By comparison with 2005, this represents an increase of 14.2% in terms of the number of delivery instructions processed and an increase of 12.7% in terms of their value.

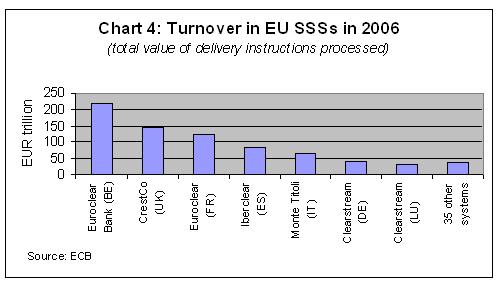
There is also a notable degree of concentration in this sector, with the three largest SSSs (Euroclear Bank in Belgium, CrestCo in the United Kingdom and Euroclear in France) accounting for around two‑thirds of the value and 41% of the volume of delivery instructions processed in the market. The turnover in SSSs in the various countries is also related to market practices in the provision of collateral.
Additional information
The full time series for these data can be downloaded from the ECB’s website through the Statistical Data Warehouse at http://sdw.ecb.europa.eu. In the past, these statistics were published in an addendum to the ECB publication “Payment and securities settlement systems in the European Union”, also known as the “Blue Book”. The hard copy publication of the Blue Book Addendum has been discontinued, as the SDW now provides convenient access to the relevant data. The SDW also contains pre-formatted tables on payment statistics for the last five years, which present the data in the same way as the old Blue Book Addendum.
Payments statistics cover the period 2000-06. Securities statistics have been expanded following an enhancement of their methodology. As the new methodology could not be applied to earlier years, statistics on securities settlement systems cover 2006, 2005 and, in part, 2004, while statistics on central counterparties (i.e. securities clearing) and stock exchanges (i.e. securities trading) cover 2006 and, in part, 2005. For further methodological information, see the “Statistics” section of the ECB’s website ( http://www.ecb.europa.eu/stats/payments/). The SDW also contains explanatory notes for each country.
-
[1] Excludes French data on credit transfers, since these include interbank transactions for the period 2000-04.
Bank Ċentrali Ewropew
Direttorat Ġenerali Komunikazzjoni
- Sonnemannstrasse 20
- 60314 Frankfurt am Main, il-Ġermanja
- +49 69 1344 7455
- media@ecb.europa.eu
Ir-riproduzzjoni hija permessa sakemm jissemma s-sors.
Kuntatti għall-midja

