


- PRESS RELEASE
ECB wage tracker at 2.7% in Q1 2027, indicating stable negotiated wage pressures
29 July 2026
- ECB wage tracker updated with wage agreements signed up to first week of July 2026; forward-looking horizon extended to end of March 2027
- Forward-looking information continues to indicate stable negotiated wage pressures in 2026 and first quarter of 2027
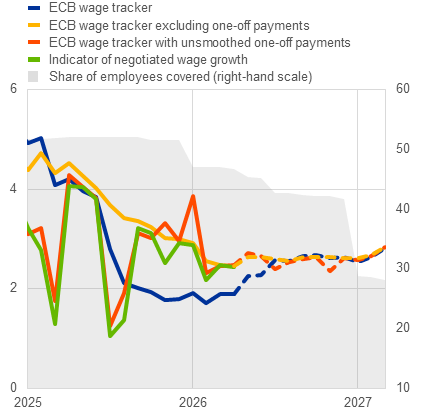
The European Central Bank (ECB) wage tracker, which covers active collective bargaining agreements, indicates negotiated wage pressures with smoothed one-off payments of 2.3% in 2026 (based on a coverage of 44.3% of employees in participating countries) and of 2.7% in the first quarter of 2027 (based on a coverage of 28.4%).
The forward-looking horizon of the wage tracker has been extended up to March 2027. As new agreements are being signed and coverage of contracts reaching 2027 is gradually increasing, the forward-looking horizon of the wage tracker will be further extended to the second quarter of 2027 in the September 2026 data release.
Compared with the June 2026 data release, the ECB wage tracker with smoothed one-off payments remains broadly unchanged for 2026, with new agreements not leading to a material change in the assessment of negotiated wage pressures for this year.
The headline ECB wage tracker is better suited to describe quarterly or monthly dynamics in negotiated wages as it smooths one-off payments over time. By contrast, the ECB wage tracker with unsmoothed one-off payments is better suited to describing yearly dynamics in negotiated wages.
The ECB wage tracker with unsmoothed one-off payments indicates stable negotiated wage growth of 2.6% in 2026 and 2.7% in the first quarter of 2027. The wage tracker excluding one-off payments also stands at 2.6% in 2026 and 2.7% in the first quarter of 2027.
For 2026, the headline ECB wage tracker averages 1.8% in the first quarter, 2.1% in the second quarter and 2.6% in the third and fourth quarters. This increase over the course of the year reflects the fading mechanical downward effect of large one-off payments that were made in 2024 but not in 2025. This mechanical effect virtually disappears in the second half of 2026 in the headline indicator. The headline wage tracker stands at 2.7% in the first quarter of 2027, indicating broadly stable negotiated wage pressures at the turn of the year and a currently limited role for one-off payments.
The ECB wage tracker with unsmoothed one-off payments averages 2.9% in the first quarter, 2.6% in the second quarter and 2.5% in the third and fourth quarters. The wage tracker excluding one-off payments remains stable at around 2.6% throughout 2026. For the first quarter of 2027, the wage tracker both with unsmoothed one-off payments and excluding one-off payments reaches 2.7%.
Employee coverage for 2026 stands at 47.0% in the first quarter of the year, 45.7% in the second quarter, 42.5% in the third quarter and 42.0% in the fourth quarter. The employee coverage decreases to 28.4% in the first quarter of 2027. See Chart 1 and Table 1 for further details.
Overall, the ECB wage tracker may be subject to revision, and the forward-looking component should not be interpreted as a forecast, as it only captures information that is currently available for active collective bargaining agreements. Moreover, the ECB wage tracker does not track the indicator of negotiated wage growth precisely, and deviations are to be expected over time. For a more comprehensive assessment of wage developments in the euro area, please refer to the June 2026 Eurosystem staff macroeconomic projections for the euro area, which indicate a yearly growth rate of compensation per employee in the euro area of 3.2% in 2026.
The ECB publishes four wage tracker indicators for the aggregate of the nine participating euro area countries on the ECB Data Portal.
Chart 1
ECB wage tracker: forward-looking signals for negotiated wages and revisions to the previous data release
Indicators between January 2025 and March 2027 | Revisions to previous data release |
|---|---|
(left-hand scale: yearly growth rates, percentages; right-hand scale: percentage share of employees) | (percentage points) |
 |  |
Sources: ECB calculations based on data provided by the Nationale Bank van België/Banque nationale de Belgique, the Belgian Federal Public Service Employment, Labour and Social Dialogue, the Belgian National Social Security Office, the Deutsche Bundesbank, the Bank of Greece, the Banco de España, the Banque de France, the Banca d’Italia, the Dutch employers’ association AWVN, the Oesterreichische Nationalbank, Suomen Pankki – Finlands Bank, the Confederation of Finnish Industries, Statistics Finland and Eurostat. The indicator of negotiated wage growth is calculated using data from the Belgian Federal Public Service Employment, Labour and Social Dialogue, the Deutsche Bundesbank, the Spanish Ministry of Labour and Social Economy, the Banque de France, the Italian National Institute of Statistics (ISTAT), Statistics Netherlands, Statistics Austria, Statistics Finland, Haver Analytics and Eurostat.
Notes: Dashed lines denote forward-looking information (which is not yet available for the indicator of negotiated wage growth). The latest observations are for March 2027 for the ECB wage tracker indicators (left panel), April 2026 for the indicator of negotiated wage growth (left panel) and December 2026 for revisions to the previous data release (right panel).
What do the four different indicators show?
- The headline ECB wage tracker is a tracker of negotiated wage growth that includes collectively agreed one-off payments, such as those related to inflation compensation, bonuses or back-dated pay, which are smoothed over 12 months.
- The ECB wage tracker excluding one-off payments reflects the extent of structural (or permanent) negotiated wage increases.
- The ECB wage tracker with unsmoothed one-off payments is constructed using a methodology that, in terms of both data sources and statistical methodology, is conceptually similar to, but not necessarily the same as, that used for the ECB indicator of negotiated wage growth.
- The share of employees covered is the percentage of employees across the participating countries that are directly covered by ECB wage tracker data. This indicator provides information on the representativeness of the underlying (negotiated) wage growth signals obtained from the set of wage tracker indicators for the aggregate of the participating countries. Employee coverage differs across countries and within each country over time (more details can be found in Table 2).
Table 1
ECB wage tracker summary
(percentages)
ECB wage tracker | Coverage | |||
|---|---|---|---|---|
| Headline indicator | With unsmoothed one-off payments | Excluding one-off payments | Share of employees (%) | |
2013-24 | 2.2 | 2.3 | 2.1 | 50.9 |
2025 | 3.2 | 3.0 | 3.8 | 51.8 |
2026 | 2.3 | 2.6 | 2.6 | 44.3 |
Q1 2026 | 1.8 | 2.9 | 2.6 | 47.0 |
April 2026 | 1.9 | 2.5 | 2.5 | 46.7 |
May 2026 | 2.3 | 2.7 | 2.6 | 45.3 |
June 2026 | 2.3 | 2.7 | 2.6 | 45.2 |
July 2026 | 2.6 | 2.4 | 2.6 | 42.7 |
August 2026 | 2.6 | 2.5 | 2.6 | 42.6 |
September 2026 | 2.7 | 2.6 | 2.6 | 42.4 |
Q4 2026 | 2.6 | 2.5 | 2.6 | 42.0 |
Q1 2027 | 2.7 | 2.7 | 2.7 | 28.4 |
Sources: ECB calculations based on data provided by the Nationale Bank van België/Banque nationale de Belgique, the Belgian Federal Public Service Employment, Labour and Social Dialogue, the Belgian National Social Security Office, the Deutsche Bundesbank, the Bank of Greece, the Banco de España, the Banque de France, the Banca d’Italia, the Dutch employers’ association AWVN, the Oesterreichische Nationalbank, Suomen Pankki – Finlands Bank, the Confederation of Finnish Industries, Statistics Finland and Eurostat.
Notes: ECB wage tracker indicators reflect yearly growth in negotiated wages as a percentage. Coverage is defined as the share of employees in participating countries as a percentage. Rows with values in italics and bold refer to the forward-looking aspect of the respective indicators. Data are subject to revision.
Table 2
Employee coverage by country
(share of employees in each country, percentages)
Belgium | Germany | Greece | Spain | France | Italy | Netherlands | Austria | Finland | Euro area | |
|---|---|---|---|---|---|---|---|---|---|---|
2013-25 | 38.7 | 42.7 | 18.5 | 62.7 | 52.5 | 51.5 | 63.9 | 75.5 | 65.9 | 51.0 |
2026 | 44.9 | 40.3 | 22.5 | 39.0 | 44.2 | 48.3 | 59.3 | 69.8 | 61.7 | 44.3 |
Q1 2026 | 44.8 | 45.7 | 22.9 | 41.0 | 46.2 | 48.4 | 60.2 | 75.5 | 62.6 | 47.0 |
Q2 2026 | 44.9 | 43.4 | 22.5 | 40.2 | 45.0 | 48.5 | 59.9 | 70.2 | 62.3 | 45.7 |
Q3 2026 | 44.9 | 36.3 | 22.3 | 37.5 | 43.1 | 48.5 | 58.8 | 67.7 | 61.7 | 42.5 |
Q4 2026 | 44.9 | 35.9 | 22.3 | 37.3 | 42.6 | 47.6 | 58.4 | 65.8 | 60.5 | 42.0 |
Q1 2027 | 44.8 | 32.4 | 14.4 | 9.3 | 18.5 | 38.7 | 44.5 | 37.9 | 59.9 | 28.4 |
Sources: ECB calculations based on data provided by the Nationale Bank van België/Banque nationale de Belgique, the Belgian Federal Public Service Employment, Labour and Social Dialogue, the Belgian National Social Security Office, the Deutsche Bundesbank, the Bank of Greece, the Banco de España, the Banque de France, the Banca d’Italia, the Dutch employers’ association AWVN, the Oesterreichische Nationalbank, Suomen Pankki – Finlands Bank, the Confederation of Finnish Industries, Statistics Finland and Eurostat.
Notes: The euro area aggregate comprises the nine participating wage tracker countries. The coverage shows the relative strength of wage signals for each country and the euro area. The historical average is calculated from January 2015 for Finland and January 2016 for Greece. For the other countries, it is calculated from January 2013 to December 2025. Rows with values in italics and bold refer to the forward-looking aspect of the indicator. Data are subject to revision.
For media queries, please contact Benoit Deeg, tel.: +491721683704
Notes:
- The ECB wage tracker is the result of a Eurosystem partnership currently comprising the ECB and nine euro area national central banks: the Nationale Bank van België/Banque nationale de Belgique, the Deutsche Bundesbank, the Bank of Greece, the Banco de España, the Banque de France, the Banca d’Italia, De Nederlandsche Bank, the Oesterreichische Nationalbank and Suomen Pankki – Finlands Bank. It is based on a highly granular database of active collective bargaining agreements for Belgium, Germany, Greece, Spain, France, Italy, the Netherlands, Austria and Finland. The wage tracker can be used to help assess wage pressures in the euro area.
- The wage tracker methodology uses a double aggregation approach. First, it aggregates the highly granular information on collective bargaining agreements and constructs the wage tracker indicators at the country level using information on the employee coverage within each country. Second, it uses this information to construct the aggregate for the euro area using time-varying weights based on the total compensation of employees among the participating countries.
- Given that the forward-looking nature of the tracker is dependent on the underlying collective bargaining agreements database, the wage signals should always be considered conditional on the information available at any given point in time and thus subject to revision. This is particularly relevant at the turn of the year, as many agreements are signed or renewed in the first quarter in some countries.
Bank Ċentrali Ewropew
Direttorat Ġenerali Komunikazzjoni
- Sonnemannstrasse 20
- 60314 Frankfurt am Main, il-Ġermanja
- +49 69 1344 7455
- media@ecb.europa.eu
Ir-riproduzzjoni hija permessa sakemm jissemma s-sors.
Kuntatti għall-midja