
Addressing global imbalances: the role of macroeconomic policy
Speech by Otmar Issing, Member of the Executive Board of the ECBContribution to the Banque de France symposium on'Productivity, Competitiveness and Globalisation'Paris, 4 November 2005
The term “global imbalances” has been much used of late, covering a broad spectrum of global economic phenomena, and has been on almost every single international policy agenda over the past few years. Most policy-makers agree that global imbalances are one of the key global policy challenges today and an important threat to economic and financial stability in the world. But few agree on what precisely constitutes such imbalances. Part of the phenomenon is the large trade imbalances, with one country – the United States – running sizeable current account deficits which continue to rise, while others, mainly Asian and oil-exporting countries, are recording correspondingly large surpluses. Another aspect of this imbalance stems from the financial side, as there have been and continue to be large international capital flows towards the United States in order to allow it to finance its current account deficit. The magnitude of this imbalance has grown to worrying proportions in recent years, with the US current account deficit and corresponding capital flows reaching around USD 700-800 billion in 2005, more than 6% of US GDP. These factors clearly constitute a risk to global macroeconomic and financial stability that merits the close attention of policy-makers.
But how should policy-makers respond to this challenge? It is fair to say that, although most policy-makers share serious concerns regarding the present situation, there is a substantial degree of disagreement about the underlying causes and the question of what policy measures should be taken. From a broader perspective, there are two fundamental issues on which policy-makers disagree. The first relates to the question of whether today’s global imbalances are the result of misguided macroeconomic policies or merely a market-driven consequence of voluntary and conscious decisions by market participants in reaction to existing economic fundamentals.
This issue is an important one because it determines, or at least influences, what the adjustment mechanism of the imbalances will be. If the current structure of trade and capital flows is primarily driven by economic fundamentals, then one may argue that the adjustment mechanism is also likely to take place mainly through changes in prices and quantities following the actions and preferences of market participants. It even seems a contradiction in terms to call today’s trade and capital flows an “imbalance” if they are mainly a market outcome. In that case, they would, rather, reflect a market-induced equilibrium and an outcome that was fully in “balance”, with the result that policy had no role to play in inducing a change in existing patterns of global trade and capital flows.
In fact, there is a broad set of economic factors that determines countries’ current account positions. Productivity developments, demographics and the age structure of a country, in addition to time preferences, are all factors that exert a significant influence on countries’ current account positions and may induce large swings in countries’ external balances over time. These factors thus determine what the natural or “balanced” current account position of a country should be. However, a market-driven process may lead to “overshooting”, i.e. a situation in which existing prices and quantities, demand and supply, cannot persist at existing levels without increasing the risk of abrupt changes in flows of trade and finance. An important point that most observers agree upon is the fact that the large US current account deficit, and the corresponding surpluses elsewhere in the world, will have to be reduced significantly at some point in time, although we cannot be sure about the precise timing of the necessary adjustment. The main concern, therefore, is what the adjustment process will look like. The fear is that a purely market-determined adjustment may be abrupt, with serious adverse effects for global economic growth and for financial stability. Thus, policy may have an important role to play in preventing the market from overshooting, or should at least smooth the adjustment process and ensure that it does not take an abrupt course with damaging effects for the global economy. Policy would thus not be the cause of such an imbalance, but could still have an important role to play as an instrument used to address it.
If, on the other hand, global imbalances are the result of misguided macroeconomic policies, it seems obvious that private agents may have reacted appropriately from an individual preference function perspective, with imbalances in markets merely mirroring the incentives provided by policy.
In either case – whether today’s imbalances are the result of market phenomena or primarily reflect underlying policy decisions – the key question is what policy-makers should do and what measures should be taken to address these global imbalances. The threat of global imbalances clearly concerns every single actor in the global economy, and all parties involved therefore need to play their part in resolving the issue. In fact, all recent G7 communiqués have underlined the shared responsibility for addressing global imbalances. The communiqués have focused in particular on three factors: policies to raise private and public savings in the United States, improved exchange rate flexibility in Asia and more structural reforms in Europe to foster stronger growth.
Some of these policies are certainly more important than others and the differences of opinion among policy-makers, academics and a number of other observers focus on what the right calibration of policy is and what can be expected from the contributions of the various policy approaches for an orderly resolution of existing global imbalances. While there is certainly no single factor that explains or resolves existing imbalances and a set of policies – or policy “package” – needs to be applied, it is nevertheless important to understand which policy channels are more central than others.
The objective of this article is therefore to assess the relative importance of these policies, looking in particular at the evidence provided by analytical studies. The article reviews the evidence on the driving forces as well as the adjustment mechanisms. It deliberately draws from a wider range of considerations and takes a longer-term perspective, not only focusing on the developments of the past three years but also looking back at the broader trends in global imbalances over the past decade.
1. Some stylised facts on current account imbalances
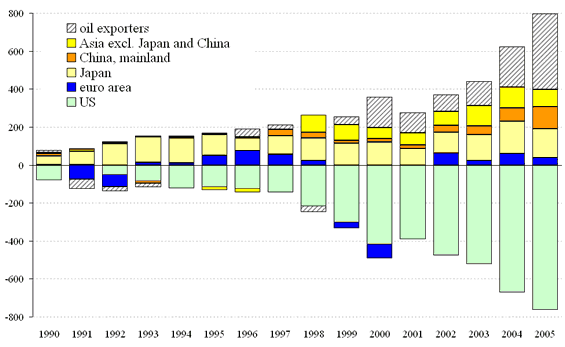
The US current account is the main contributor to global imbalances in trade and capital flows, recording a deficit of around 5.7% of US GDP in 2004, which is projected to rise to USD 700-800 billion, or 6.0% or more of US GDP, in 2005. Chart 1 provides a geographical breakdown of the counterparts of the US current account deficit since 1990. The first interesting feature is the strong increase in the US current account deficit, which was roughly in balance in 1991 but has since risen almost continuously to stand at a new record level in 2005.
A second important fact is that the counterparts of the US current account deficit were, initially, primarily Asian countries. Japan, China and other emerging Asian countries have recorded substantial current account surpluses since the Asian crisis of 1997-98, with those surpluses reaching almost USD 400 billion in 2005. More recently, in an environment of rising oil prices, oil-producing nations have also become net exporters of late and are projected to record current account surpluses of around USD 350 billion in 2005. Finally, the euro area has recorded a small current account surplus for most of the past 15 years, which is fully consistent with the position of the euro area as one of the richest and most productive economies in the world with a demographic structure that requires net savings over the medium term. It therefore seems fair to say that the euro area has not made any real contribution to the build-up of current imbalances over the past two decades (see Chart 1).
| Chart 1: Current account positions of selected economies, 1990-2005 (USD billions) |
|---|
 |
| Sources: IMF World Economic Outlook, September 2005 and ECB staff calculations. |
| Chart 2: Financing of the US current account (breakdown by instrument) 1990-2004 (USD billions) |
|---|
 |
| Source: BIS. |
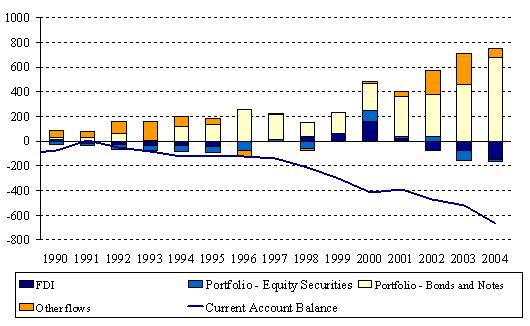
The counterparts of global current account imbalances are the capital flows on the financial account side of the balance of payments. It is not only the extent of current account imbalances which is important, but also how these are financed. Chart 2 shows, for the period 1990-2004, the composition of the net flows to the United States that have allowed it to finance its current account deficit. The striking feature of these financing flows is that they have, in recent years, been heavily dominated by fixed income flows, i.e. by portfolio bonds and notes. These considerable net inflows in portfolio debt largely reflect the accumulation of reserves by foreign central banks, a point to which this article will return later on. Moreover, it is interesting to note that the United States has been a net exporter of FDI and even portfolio equity in recent years.
The next section focuses on the role of macroeconomic policies in the United States, as well as touching on the relevance of global “excess” savings, the “savings glut”, with the subsequent sections then discussing the importance of exchange rate policies in Asia and structural policies in Europe.
2. The role of macroeconomic policies
A number of macroeconomic policies have played a central role in the build-up of global current account and financial imbalances over the past few decades.
2.1 Private and public savings-investment imbalances and productivity
A country’s current account surplus or deficit is, by definition, the difference between what the public and private sectors and firms save and what they invest. Thus, an important element of any analysis of global imbalances is to gauge whether one can detect a marked movement in the underlying savings-investment components and to ask what the factors behind such changes have been.
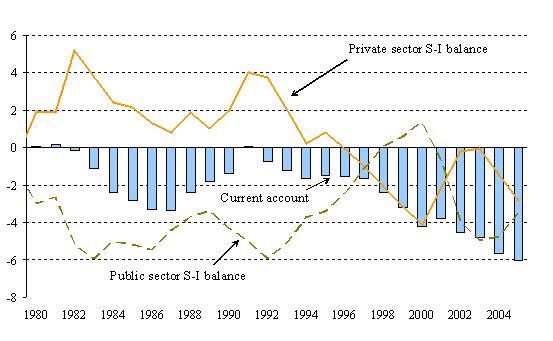
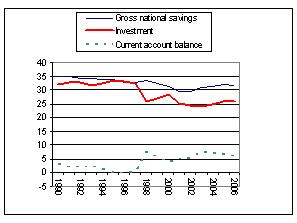
Chart 3 shows that a striking feature of US macroeconomic developments over the past 25 years has been the more or less steady decline in the private savings-investment balance. More precisely, while US private investment has remained steady at 15-20% of GDP, fluctuating with the economic cycle, the private net savings rate in the United States has declined markedly, from around 8% in the early 1980s to below 2% in 2005.[1] Although the private savings-investment balance usually tends to improve in periods of recession, it remained negative in the 2001-03 slowdown. The private savings-investment imbalance in the United States has therefore led to the current account deficit increasing almost continuously over the past 15 years and reaching more than 6% of US GDP in 2005. From a stock perspective, the United States has become by far the largest net debtor in the world, with its net outstanding liabilities vis-à-vis the rest of the world accumulating to stand at between 20% and 25% of US GDP.
Why have US private savings fallen so strongly to such a low level over the past decade? In principle, there are two sets of explanations. The first revolves around the argument that this decline is an equilibrium phenomenon that is explained by a sustained positive outlook for the US economy, with the result that private sector decisions entailing a sizeable current account deficit may be entirely rational. The second set of arguments implies that this decline is primarily induced by policy decisions and, therefore, that the current phenomenon of low net savings is only temporary and will need to be reversed in the medium to long term through changes in policy.
| Chart 3: United States – Current account and the savings-investment balance: 1980-2004 (as a percentage of GDP) |
|---|
 |
| Sources: US Bureau of Economic Analysis, IMF World Economic Outlook and ECB staff calculations. Note: 2005 data are projections. |
In support of the first argument, there are several indications that structural changes in the US economy in the 1990s may, in part, have led to the higher current account deficits run by the United States being consistent with underlying fundamentals. An ECB study (Bussière, Fratzscher and Müller, 2004) found that the structural current account deficit that the United States can afford from a solvency perspective (i.e. that is sustainable in the medium term and can be serviced as a result of higher permanent income) is larger than that of most other developed economies. In particular, from an intertemporal perspective, a temporary increase in the current account deficit may be justified if a country grows faster than its main trading partners. A positive, country-specific productivity shock raises the permanent income of households and firms and thus induces an immediate rise in private consumption and a decline in savings. The higher productivity implies larger returns on investment, which in turn attracts foreign capital and allows these countries to finance their current account deficits.
Several academic studies have shown the importance of productivity in explaining the evolution of current account positions. It is difficult to quantify how much of the US current account deficit can be explained by higher levels of productivity and growth in the United States. However, the empirical findings of the seminal work by Glick and Rogoff (1995) indicate that a 1% increase in country-specific productivity decreases the current account balance by 0.15% of GDP. Overall, given that productivity growth is significantly stronger in the United States than in many of its trading partners, this elasticity suggests that the higher levels of productivity growth in the United States can explain around one-third of the US current account deficit.
| Chart 4: United States – Real interest rate and savings as a percentage of GDP: 1980-2004 (quarterly) |
|---|
 |
| Sources: US Bureau of Economic Analysis, BIS and ECB staff calculations. Note: Last observation refers to the third quarter of 2004. |
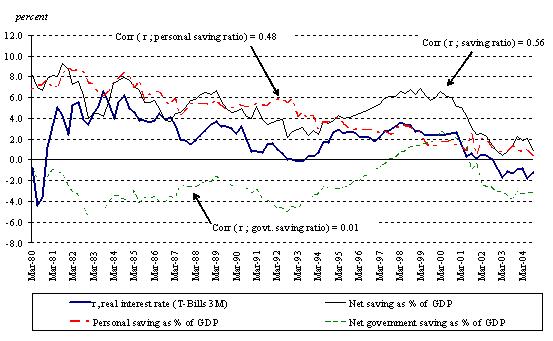
The second, alternative explanation is that policy decisions may have contributed to the drop in US savings and the rise, in particular, in private consumption, which may ultimately have contributed to the build-up of the current global imbalances. Chart 4 compares the evolution of the US net savings rate with that of real short-term interest rates in the United States. The chart shows that the two series mirror one another very closely – with a correlation coefficient of 0.56 – suggesting that the decline in savings rates over the past decade may be related to the decline in real interest rates, which have, moreover, become negative in the past few years. Chart 4 also shows the personal (household) savings rate and the net government savings rate. The correlation coefficient of 0.48 between personal savings and real interest rates during the period 1980-2004 is substantial, although it has been weaker in the past decade. This evidence therefore suggests that lower US real interest rates may, at least in part, have contributed to the decline in private savings and thus the increase in the US current account deficit, although it should be stressed that many other factors influence private savings behaviour and it is in practice difficult to identify the precise pattern of causality between interest rates and private savings. Moreover, the limited pass-through of import prices to US inflation has not restricted the rise in the US current account deficit in recent years, despite the depreciation of the US dollar vis-à-vis several other currencies.
A closely related potential explanation for the large US current account deficit concerns asset price bubbles. The late 1990s and early 2000s were characterised by an unparalleled global equity market boom, led in particular by the United States. The significant growth in equity markets led to substantial wealth effects, with the increased household wealth from equity holdings contributing in particular to higher private consumption and lower savings. It has been argued by some observers (e.g. Kraay and Ventura, 2005), that this, in turn, is likely to have played an important role in raising the US current account deficit in the late 1990s and early 2000s, i.e. during a period when the sharp increase in the US trade deficit was entirely driven by the dramatic increase in the private savings-investment deficit. In the past few years, since the bursting of the equity market bubble in 2000, the US housing market has experienced significant price increases. Thus, wealth effects similar to those of the early equity market boom may have contributed to the low private savings rate in recent years.
Chart 5 illustrates the close correlation between household net worth and the personal savings rate in the United States. Particularly striking is the sharp rise in household net worth after 1995 (note the inverted scale of household net worth in the chart) and the simultaneous sharp drop in household savings. Even after the collapse of the equity boom in 2000, the personal savings rate scarcely recovered, and it then declined further from 2002 with the housing market boom.
| Chart 5: US personal savings and household net worth: 1950-2004 (as a percentage of households’ disposable income) |
|---|
 |
| Source: Global Insight. Note: Last observation refers to the third quarter of 2004. |
2.2 The role of fiscal policy
An additional and potentially key factor in understanding the low savings rate in the United States is fiscal policy. In fact, the role of US fiscal policy in inducing and explaining the rising US current account deficit, and global imbalances more generally, has received considerable attention in recent years. The US fiscal deficit stood at around 4.0% of GDP in 2004, while the private savings-investment balance recorded a deficit of around 1% of GDP. Thus, from a pure accounting perspective, the US fiscal deficit seems to be a key contributor to the persistent US current account deficit. Taking a longer-term perspective, however, there are reasons why the fiscal deficit may be less important than it may appear from this pure accounting perspective.
Chart 3 shows that there has not generally been a positive relationship between the current account and the fiscal balance in the United States over the past 25 years. In fact, during many periods there has been a negative relationship, such as throughout the late 1980s and most of the 1990s. The US fiscal deficit stood at 5-6% of GDP in the early 1980s and the early 1990s – larger than it is today – while the US current account was more or less balanced or even slightly in surplus. Particularly striking are the 1990s, when the US current account worsened continuously while the fiscal balance improved markedly.
Table 1: A synthetic summary of the academic literature: Effect on the current account of a 1 percentage point increase in the budget balance
| Empirical contributions | ||
|---|---|---|
| Study | Sample and methodology | Result (percentage points) |
| Summers, 1986 | United States, 1950-85, single equations | 0.25 |
| Bernheim, 1988 | United States, United Kingdom, Canada and Germany, single equations | 0.33 for the United States |
| Roubini, 1988 | 18 OECD countries, 1961-85, single equations | 0.14 (Canada) to 0.60 (United States) |
| Dewald and Ulan, 1990 | Same as Roubini (1988) for the United States | 0 |
| Miller and Russek, 1989 | United States, Q data, 1971-87, OLS and cointegration | 1 or 0 (depending on methodology) |
| Enders and Lee, 1990 | United States, Q data 1947-87, VAR | 0 |
| Evans, 1990 | G7, Q and annual data, 1973-88 and other time samples | 0 |
| Normandin, 1994 | United States and Canada, Q data 1970-93 | 0-1 for Canada, 0 for the United States |
| Chinn and Prasad, 2000 | 18 industrialised countries, 1971-95, panel regressions | 0.13 to 0.34 (depending on specification) |
| Piersanti, 2000 | 17 OECD countries, 1970-97, GMM | 0.16 on average for G7 countries, 0.25 for United States |
| Kim and Roubini, 2003 | United States, Q data, 1973-2002, VAR | <0 |
| Bussière, Fratzscher and Müller, 2005 | G7 and OECD countries, 1960-2003 | 0.10 for G7, 0.07 for OECD |
| Kennedy and Slok, 2005 | 13 OECD countries, 1982-2003, panel regressions | 0.08 to 0.33 (depending on specification) |
| Theoretical contributions with simulations | ||
| Baxter, 1995 | RBC | 0.5 |
| Kollman, 1998 | RBC | 0 |
| Erceg, Guerrieri and Gust, 2005 | DSGE | 0.2 |
Source: Bussière, Fratzscher and Müller (2005), Table A.1.
Indeed, the overwhelming consensus among empirical studies and in the academic literature is that there is a relatively weak relationship between fiscal balances and current account positions, both for the United States and for a broader cross-section of countries. Table 1 shows the empirical findings for a broad set of analytical studies on the issue. The table reveals that most empirical studies find elasticities between fiscal balances and current account positions of around 0-0.3. Applied to the United States, this suggests that the sharp reversal of more than 4 percentage points in the US fiscal deficit between 2001 and 2004 contributed between 0 and 1.2 percentage points to the US current account deficit over that period. In fact, the US current account deficit has worsened by around 2.2 percentage points, from around 3.8% in 2000 to around 6.0% in 2005. The rise in the US fiscal deficit may, therefore, have played a role in explaining the worsening of the US current account deficit in recent years. However, the key message from the available evidence is that fiscal policy is likely to explain only a fraction of the level of today’s US current account deficit.
Why has the link between fiscal policy and current account positions historically been so weak? A key concept frequently raised in this context is that of Ricardian equivalence. It implies that, in principle, a change in the fiscal position should have no effect on the current account, as it gives rise to an equal adjustment in private sector net savings. For instance, a rise in the fiscal deficit should be matched by an equal, simultaneous increase in net private savings, as agents, taking an intertemporal perspective, anticipate that larger fiscal deficits today will require higher taxes in the future. Empirically, many studies find partial support for Ricardian behaviour in the private sector, although the possibility of shifting the tax burden to future generations and frictions related inter alia to habit persistence and liquidity constraints allow for deviations from Ricardian equivalence. Chart 3 illustrates such a negative relationship between the private savings-investment balance and the fiscal deficit in the United States, with the two moving in opposite directions since 1980.
Overall, if the elasticity of 0.3 between fiscal policy and the current account were to hold for the United States, it would mean that 20% or less of today’s US current account deficit of 6.0% of GDP could be explained by the US fiscal deficit. Of course, it must be stressed that this is a rough proxy based on the assumption of a constant elasticity of 0.3 and a lower elasticity would imply that an even smaller fraction of the US current account deficit could be explained by fiscal policy. However, there appears to have been some positive correlation between the US fiscal position and the US current account in the period 2001-04, as both balances declined during that period. Moreover, private net savings appear to have responded in a somewhat weaker manner to the large rise in the US fiscal deficit during that period. Nevertheless, while it is possible to speculate on the reasons for such a change,[2] the evidence is inconclusive on the question of whether a fundamental disconnect has occurred in recent years.
In conclusion, the evidence suggests that there is only a limited relationship between fiscal positions and the current account and, confirming partial Ricardian behaviour by the private sector, that there is a substantial negative relationship between fiscal balances and private savings-investment positions. Therefore, fiscal consolidation is certainly desirable from various perspectives and may have an impact in the short run in preventing a further worsening of existing global current account imbalances, and, moreover, sends an important signal to financial markets. However, fiscal consolidation alone is likely to be insufficient to reduce today’s global current account imbalances to more sustainable levels in the medium to long term.
2.3 Global savings glut? Interventions in foreign exchange markets
By definition, current account imbalances have two components: on the one hand, the real side, i.e. the consumption and investment decisions; and on the other hand, the financial side, i.e. the flow of investments “financing” current account deficits. In fact, there has recently been something of a shift in the debate on global imbalances, with more focus on the “global savings glut” hypothesis, which states that current account imbalances may not necessarily be primarily the result of excess consumption and investment by deficit countries, but rather a consequence of excess savings in surplus countries (Bernanke, 2005). Thus, a policy prescription of proponents of this hypothesis is that surplus countries should conduct policies that increase absorption and imports in order to reduce their surpluses.
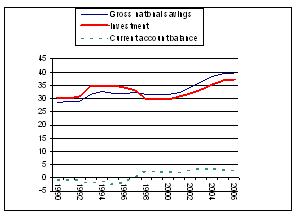
This argument has been made in particular with regard to the sizeable current account surpluses in emerging Asia. And indeed, a look at the data confirms that emerging markets in Asia continue to record high savings rates, much higher than those observed in European and North American countries. Chart 6 shows that the gross national savings rate of Asia’s newly industrialised countries has been around 30-35% of GDP since 1990. Moreover, a look at the poorer developing countries of Asia (Chart 7) shows that their gross national savings rates have actually risen following the 1997-98 Asian crisis, from around 32% in 1996 to around 40% in 2005. Investment in these countries has also recovered following the Asian crisis, but to a much lesser extent than savings, thus resulting in sizeable current account surpluses in emerging Asia. The question of whether investment is “too low” or national savings are “excessive” is of course controversial, but the key point is that the growing gap between savings and investment in Asia has led to a significant current account surplus in the region in recent years.
| Chart 6: Savings and investment in Asia’s newly industrialised countries (as a percentage of GDP) | Chart 7: Savings and investment in developing Asia (as a percentage of GDP) |
|---|---|
 |
 |
| Source: IMF. | Source: IMF. |
However, there is one fundamental weakness in the savings glut hypothesis. This flaw is that it is hard to blame countries for having a strong preference for savings and even harder to make them directly responsible for the excessive consumption and investment behaviour of debtor countries. By definition, a current account “imbalance” always involves two parties: one that has excess net savings and thus records a surplus, and one that has excess consumption and investment, i.e. a current account deficit. And while some countries may choose to accumulate surpluses, there is nothing that then automatically forces other countries to consume or invest more than they save domestically. Nevertheless, there are also various indirect channels through which surplus countries may influence financial markets and asset prices and thus contribute to current account imbalances.
An important channel relates to interventions in foreign exchange markets. In fact, Asian central banks in particular, in their attempts to stabilise exchange rates, have intervened heavily in foreign exchange markets and have accumulated enormous amounts of reserve assets in recent years, with much of these reserves being invested in US dollar-denominated assets. Through these interventions, Asian countries have enabled the United States to finance a large and increasing current account deficit at relatively low interest rates. Nevertheless, the existing evidence suggests that the influence of these investments on US interest rates has been limited.[3]
On the other hand, the (ex ante) relationship between savings and high levels of global liquidity, which we are observing today, remains an open issue. The savings glut hypothesis ignores the fact that a significant part of what is measured (ex post) as “savings” starts (ex ante) as excess liquidity.
3. Exchange rate policies
Several of the most recent international policy communiqués and other policy statements have emphasised the need for greater exchange rate flexibility in Asia as a way of reducing the US current account deficit and Asian surpluses. In principle, the appreciation of the currencies of countries with current account surpluses vis-à-vis those with large trade deficits could help to reduce these imbalances.
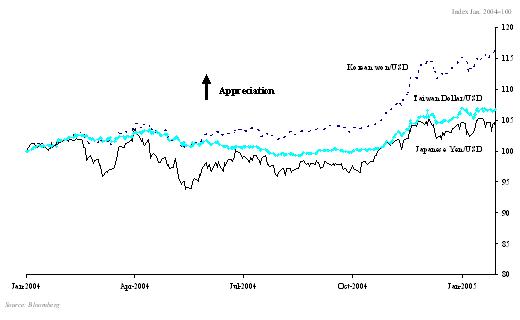
| Chart 8: Selected Asian exchange rate developments in 2004 |
|---|
 |
| Sources: Bloomberg and ECB staff calculations. |
The key argument in support of the appreciation of Asian currencies is the fact that many of these currencies, in particular the Chinese renminbi, are substantially undervalued. Thus, a significant appreciation of these currencies would send an important signal that governments in all regions are committed to reducing current global imbalances by adopting policies that are in line with lower current account surpluses in Asia and a decline in deficits in the United States. Such a move would also reduce the risk of an abrupt adjustment, which could be triggered if markets lacked confidence in policy-makers’ commitment to addressing the issue of global imbalances.
A key question is how the process of exchange rate adjustments, in particular for Asian currencies, would take place over the coming years. A first point to note is that some significant exchange rate adjustments have already taken place over the past few years. Not only has the euro appreciated against the US dollar in recent years, but several Asian currencies have also strengthened. Chart 8 shows that the South Korean won, for example, has appreciated by more than 15% against the US dollar since January 2004. The new Taiwan dollar also appreciated by 7% in 2004, while the Japanese yen, however, has remained relatively stable over the past few years.
Nonetheless, other currencies, such as the Chinese renminbi and the Malaysian ringgit, have much more rigid regimes as regards links to the US dollar and have, as a result, depreciated substantially in nominal effective terms over the past few years. China has recently started to engage in some exchange rate reform, revaluing the renminbi by 2% on 21 July 2005 and altering the set-up of its regime. Although the reform certainly represents welcome first steps in the right direction, it remains to be seen whether this reform will, over the medium term, allow for any significant revaluation of the renminbi, which remains substantially undervalued.
Table 2: United States – Direction of trade and contribution to the trade deficit: 1987-2003 (percentages)
| 1987 | 2003 | ||||
|---|---|---|---|---|---|
| Share of total US trade | Share of US trade deficit | Share of total US trade | Share of US trade deficit | ||
| Euro area | 16.8 | 12.0 | 15.0 | 13.8 | |
| Other industrialised countries * | 9.2 | 5.1 | 7.4 | 3.7 | |
| Central and Eastern Europe | 1.3 | -0.4 | 1.8 | 2.3 | |
| NAFTA | 24.6 | 10.2 | 31.3 | 17.3 | |
| of which: Canada | 19.4 | 6.8 | 19.6 | 10.0 | |
| Mexico | 5.2 | 3.4 | 11.7 | 7.3 | |
| Asia | 35.0 | 63.2 | 32.6 | 49.2 | |
| of which: Japan | 17.2 | 34.8 | 8.5 | 11.9 | |
| China | 1.5 | 2.0 | 9.5 | 23.2 | |
| rest of Asia | 16.3 | 26.4 | 14.6 | 14.1 | |
| Western hemisphere ** | 5.8 | 3.5 | 5.7 | 3.0 | |
| Oil-exporting countries *** | 4.5 | 6.2 | 3.8 | 8.3 | |
| Rest of the world | 2.8 | 0.2 | 2.4 | 2.4 | |
| Total | 100.0 | 100.0 | 100.0 | 100.0 | |
* Australia, Denmark, Iceland, New Zealand, Norway, Sweden, Switzerland and United Kingdom.
** Excluding Canada and Mexico (NAFTA) and Venezuela (oil exporter).
*** Algeria, Iran, Iraq, Kuwait, Libya, Nigeria, Oman, Qatar, Saudi Arabia, United Arab Emirates and Venezuela.
Source: IMF Direction of Trade Statistics.
Analysing which countries have the largest current account imbalances with the United States, Table 2 shows that China accounted for 23% of the US trade deficit in 2003, the largest share of any single country, whereas Asia as a whole accounted for roughly half of the total. However, while China’s share of the US deficit has increased over the past 15 years, that of the rest of Asia has decreased by even more, causing Asia’s overall share to fall from 63% in 1987 to 50% in 2004. The reason for this is the fact that Asian countries have increasingly been outsourcing manufacturing exports to China. Thus, over half of China’s total exports currently involve the final assembly of products using intermediate inputs imported from other countries, chiefly other Asian countries. This explains why China’s rising trade surplus with the United States has been partly offset by China’s trade deficits with other Asian countries. The high import content of China’s exports and the country’s competitive advantage in terms of labour costs are both likely to considerably reduce the impact on China’s exports of any appreciation of the renminbi, provided that other Asian countries do not follow China in revaluing their currencies. In fact, during the period 1999-2002 China’s total exports rose by 37%, despite a 7% real effective appreciation in its currency.
Table 2 also shows that there are other countries and regions that account for a large share of the US trade deficit. In particular, the NAFTA countries Canada and Mexico account for 17%, with the euro area accounting for 14% of the US deficit, and this despite the Canadian dollar and the euro having already appreciated markedly against the US dollar over the past few years. An important point to emphasise is that, although the US dollar has depreciated in effective terms over the past few years, its depreciation against most Asian currencies has, in many ways, still been relatively modest. Moreover, the pass-through from this US dollar depreciation to domestic prices in the United States has been remarkably low, providing only limited price pressure for the replacement of foreign goods in US markets and an improvement in the US trade balance.
Overall, the evidence in the academic literature (e.g. Blanchard, Giavazzi and Sa, 2005) suggests that a more significant effective adjustment of the US dollar may be needed, in particular vis-à-vis those countries with which the United States has a sizeable trade deficit, in order to help substantially reduce the US trade deficit. The worrying issue from a policy perspective is that an exchange rate adjustment, if not supported by other policy measures, would have to be enormous: for instance, Blanchard, Giavazzi and Sa (2005) estimate that the US dollar would have to depreciate in effective terms by between 40% and 90%, all else being equal, to reduce the US current account deficit to sustainable long-term levels.
Similarly, Edwards (2005) provides a complementary view on global current account imbalances by analysing the possible adjustment path for the United States. Analysing historical episodes of current account adjustments, he argues that even a moderate reduction in international investors’ preferences for US assets could lead to a sharp adjustment of 3-6% in the US current account deficit within a few years by inducing a real effective depreciation of 27-30% in the value of the US dollar. He also argues that this could lead to a sharp reduction in US and global economic growth.
Finally, although exchange rate adjustments in emerging markets alone are likely to be insufficient to address existing global imbalances, it should be noted that the sizeable current account surpluses that many Asian economies are recording are an important factor that needs to be addressed. Given their rapid economic growth and potential for catching-up with mature economies, these economies are “natural” current account deficit countries, as tended to be the case until the onset of the Asian crisis in 1997-98. Overall, therefore, the evidence suggests that a modest appreciation of Asian currencies would lead to a limited depreciation of the effective US dollar exchange rate and would have a limited impact on current account imbalances. However, exchange rate adjustment in Asia is relevant, particularly in China, as it could provide an important signal to financial markets about policy commitments to a gradual and orderly adjustment of global imbalances.
4. Structural policies
Structural reform in Europe is a key priority for policy-makers in Europe, as it is crucial for enhancing growth and improving the resilience of the European economy. It has also been argued that structural reforms, particularly in Europe and Japan, may play a significant role in helping existing global imbalances to unwind. The basis of this argument is that structural reform should lead to higher actual and potential growth and demand, which may worsen the current account of those undertaking reform, such as Europe and Japan, while improving the current account positions of others, such as the United States. A key point to note is that the relationship between structural reforms and current account positions depends on three key factors: the type of reforms, the time horizon and whether the reforms mainly affect the tradable or non-tradable sector.
As regards the first two factors, in a recent study the OECD[4] sees product and financial market reforms implying a worsening of the current account over the medium term, whereas labour market reforms might possibly have the opposite effect. In particular, the OECD study argues that labour market reforms primarily have an impact on the effective labour supply, thereby reducing wages and prices in the medium term while improving the profitability of domestic capital in the long run. Such a structural reform would, in turn, thus tend to improve current accounts in the short and medium term, rather than worsening them because of the improved international competitiveness of the tradable sectors. Conversely, product market reforms should increase the income elasticity of demand for imports, which will tend to worsen the current account, at least in the medium term, before equilibrating mechanisms gradually set in. Finally, financial market reforms tend to stimulate the inflow of foreign capital, thereby also weakening the current account. Equilibrium can be restored if capital inflows improve productivity, and hence competitiveness in the long run.
Moreover, in an influential recent paper, Obstfeld and Rogoff (2004) argued that a productivity increase in the United States’ partner countries would help to adjust the US current account deficit only if it were to occur primarily in the non-tradable sector. However, if structural reforms induce a significant productivity improvement in the tradable sector, then current account positions may improve as exports become more competitive and imports less competitive. The policy implication is that structural reforms in Europe and Japan will contribute to a reduction in the US trade deficit only if, in relative terms, productivity increases in the tradable sector in the United States and in the non-tradable sector in the euro area and Japan.
There is, moreover, an even more fundamental flaw in the argument that structural reforms in Europe could play a significant role in reducing global imbalances. This flaw is that most European countries, and in particular the euro area, have a current account that is in balance or even a small current account surplus, which is fully in line with Europe’s economic fundamentals of having a relatively wealthy and ageing economy. Thus, further progress with structural reform in the euro area is desirable in its own right, as it will have a beneficial effect on economic growth and resilience in Europe. However, arguing that the euro area should run a sizeable current account deficit is inconsistent with economic reality and misses the point on the question of the true factors behind today’s global imbalances. Nevertheless, stronger growth in Europe could, on balance, lead to a slightly negative current account position in Europe and thus contribute, at least in part, to the resolution of global imbalances, although again, the extent of this contribution should not be overestimated.
5. Implications for the likely adjustment process
What is likely to be the adjustment mechanism for global imbalances over the medium term? This article has argued that understanding the explanatory factors behind today’s global imbalances is important in order to gauge what the likely adjustment mechanism is going to be in the coming years. While there is certainly no single factor that explains or resolves all existing imbalances and a set of policies – or policy “package” – needs to be applied, it is nevertheless important to understand which policy channels are more central than others. Although US fiscal policy has exacerbated the US current account deficit since 2001, the overwhelming consensus of empirical studies is that it has in all probability contributed only partially to the build-up of the current account deficit over the past decade. Although fiscal consolidation is of key importance for economic stability and an environment conducive to economic growth, fiscal adjustment alone will in all probability – owing partly to its limited effect and partly to its limited flexibility – make only a partial contribution to any reduction of the current account imbalances in the coming years. Nevertheless, fiscal consolidation in the United States is an important element of any smooth adjustment process.
The empirical evidence suggests that today’s global imbalances are mainly the result of fundamental imbalances in private savings rates around the world. The substantial drop in US private savings has been the key factor behind the sustained increase in the US current account deficit over the past 15 years. Persistently low real interest rates, as well as wealth effects resulting from the equity market bubble of the 1990s and the more recent boom in the housing market, are likely to have played a central role in understanding this decline in private savings in the United States. Moreover, private savings rates in Asia have remained high – even rising in some instances – since the 1997-98 Asian financial crisis. Although such a savings pattern may, at least in part, be the result of a lack of financial intermediation, it is also relevant for understanding today’s global current account imbalances. Thus, economic policies that help, in particular, to raise the private savings rate in deficit countries, and to some extent policies that help to lower private savings and raise investment in surplus countries, will be of central importance in addressing global imbalances.
Turning to structural reforms in Europe and Japan, these reforms may help to promote growth and resilience and are in the countries’ own best domestic interests. However, they are likely to have only a minor effect on current account imbalances in the medium term, in particular as the euro area’s current account is today in line with its long-term fundamentals.
Finally, this article has also argued that exchange rate policy in Asia has contributed to global imbalances, although the importance of this factor should not be overstated. The US dollar has already declined in value in recent years with few evident effects on global imbalances. The overall consensus of the empirical studies is that a US dollar depreciation would have to be very large in order to induce a significant adjustment in global current account imbalances. Such an adjustment could have serious negative repercussions for global growth and the stability of the global financial system, something policy-makers need to avoid in the coming years.
Overall, the issue of global imbalances is the key global challenge for policy-makers today. As this article has tried to illustrate, the issue is a highly complex one with various players and macroeconomic policies contributing to varying degrees. However, policy-makers have come to agree that the existing imbalances are unsustainable and of serious proportions, and thus need to be addressed through decisive policy action. The longer these imbalances continue to build up, the greater the risk of an abrupt adjustment and the larger the adjustment costs will be for the global economy.
References
Bernanke, Ben (2005), “The Global Saving Glut and the US Current Account Deficit”, 14 April 2005, Homer Jones Lecture, St Louis, Missouri.
Blanchard, Olivier, Francesco Giavazzi and Filippa Sa (2005), “The US Current Account and the Dollar”, MIT, mimeo, January 2005.
Bussière, Matthieu, Marcel Fratzscher and Gernot Müller (2004), “Current Account Dynamics in OECD and EU Acceding Countries – An Intertemporal Approach”, ECB Working Paper No. 311, February 2004.
Bussière, Matthieu, Marcel Fratzscher and Gernot Müller (2005), “Productivity Shocks, Budget Deficits and the Current Account”, ECB Working Paper No. 509, August 2005.
Chinn, Menzie D. and Eswar S. Prasad (2003), “Medium-term determinants of current accounts in industrial and developing countries: an empirical exploration”, Journal of International Economics 59(1), pp. 47-76.
Edwards, Sebastian (2005), “Is the US current account deficit sustainable? And if not, how costly is adjustment likely to be?”, mimeo, UCLA, March 2005.
Enders, Walter and Bong-Soo Lee (1990), “Current Account and Budget Deficits: Twins or Distant Cousins?”, Review of Economics and Statistics 72(3), pp. 373-381.
Erceg, Christopher J., Luca Guerrieri and Christopher Gust (2005), “Expansionary Fiscal Shocks and the Current Account”, International Finance Discussion Papers 825, Washington: Board of Governors of the Federal Reserve System.
Glick, Reuven and Kenneth Rogoff (1995), “Global versus Country-Specific Productivity Shocks and the Current Account”, Journal of Monetary Economics 35, pp. 159-192.
Kennedy, Mike and Torsten Slok (2005), “Structural Policy Reforms and External Imbalances”, Economics Department Working Paper 415, OECD.
Kim, Soyoung and Nouriel Roubini (2003), “Twin Deficits or Twin Divergence? Fiscal Policy, Current Account, and Real Exchange Rate in the US”, NYU Stern, mimeo.
Kraay, Aart and Jaume Ventura, (2005), “International risk sharing with demand shocks”, mimeo, World Bank, January 2005.
Normandin, Michel (1999), “Budget Deficit Persistence and the Twin Deficits Hypothesis”, Journal of International Economics 49, pp. 171-194.
Obstfeld, Maurice and Kenneth Rogoff (2004), “The Unsustainable US Current Account Position Revisited”, NBER Working Paper, October 2004.
Perotti, Roberto (1999), “Fiscal Policy in Good Times and Bad”, Quarterly Journal of Economics 114(4), pp. 1399-1436.
Piersanti, Giovanni (2000), “Current Account Dynamics and Expected Future Budget Deficits: Some International Evidence”, Journal of International Money and Finance 19, pp. 255-271.
-
[1] The definition of net savings used here excludes the consumption of fixed capital.
-
[2] One explanation offered by the economic literature for such a change is that the US fiscal deficit, which was to a large extent due to tax cuts, could possibly be perceived in part as a permanent reduction in taxes and that the adjustment of the fiscal deficit would take place through a cut in non-productive government expenditure. The potential role of liquidity constraints in the household sector, which tend to magnify the effects of fiscal policy, might be a valid alternative explanation and deserves greater scrutiny.
-
[3] Numerous studies have shown that the effect of the considerable Asian savings, reflected in massive reserve asset accumulation by Asian countries, has lowered US long-term interest rates by around 0.3-0.6% (see, for example, Bernanke, Reinhart and Sack, 2004).
-
[4] See OECD (2004), “Structural Policy Reforms and External Imbalances”.
Bank Ċentrali Ewropew
Direttorat Ġenerali Komunikazzjoni
- Sonnemannstrasse 20
- 60314 Frankfurt am Main, il-Ġermanja
- +49 69 1344 7455
- media@ecb.europa.eu
Ir-riproduzzjoni hija permessa sakemm jissemma s-sors.
Kuntatti għall-midja