


Is leverage driving procyclical investor flows? Assessing investor behaviour in UCITS bond funds
Is leverage driving procyclical investor flows? Assessing investor behaviour in UCITS bond funds
Published as part of the Macroprudential Bulletin 9, October 2019.
A recent ECB study shows that leverage is an important driver in investors’ redemption decisions. Regulatory changes to the UCITS framework facilitated the use of derivatives, increasing leverage for some European mutual funds which amplified investors' responsiveness to negative returns in a procyclical manner.
1 Introduction
The use of derivatives has increased for leveraged mutual bond funds after a change to the UCITS regulatory framework adopted in 2010. The rules adopted in 2010 established the use of the absolute Value-at-Risk (VaR) approach as regulatory limit under certain conditions. Funds opting for this approach use derivatives to increase their leverage more than other undertakings for collective investment in transferrable securities (UCITS).[2]
Leverage amplifies the flow-performance nexus in mutual funds and thereby adds to procyclicality in the sector. Empirical evidence shows that investors in corporate bond funds and other less liquid funds respond in a procyclical manner to negative returns, suggesting heightened fragility and procyclicality during these periods.[3] A study by Molestina Vivar et al. (2019) documents the effect of leverage on the flow-performance nexus for UCITS bond funds. The study finds that investors in leveraged funds react more strongly to past negative performance compared with investors in unleveraged funds.
2 Leverage restrictions under the UCITS Directive
UCITS funds generally employ traditional investment strategies with low leverage. They typically invest in marketable securities and have to comply with leverage restrictions under the UCITS Directive. Financial leverage, meaning leverage obtained through outright borrowings, is limited to 10% of net asset value and can be carried out only on a temporary basis. Furthermore, “global exposures” gained through the use of derivatives are restricted to 100% of net asset value, de facto limiting synthetic leverage in UCITS.[4]
EU Member States may allow fund managers to use one of three regulatory limits taking into account the fund’s investment strategy and its use of derivatives. According to Commission Directive 2010/43/EU, adopted in July 2010, EU Member States may allow UCITS management companies to calculate global exposure by using the commitment approach, the relative VaR approach or the absolute VaR approach.[5] The decision regarding the exposure limit should take into account the fund’s investment strategy and its use of derivatives.[6]
The absolute VaR approach generally allows a higher use of derivatives and leverage compared with the other regulatory approaches. Whereas the other two approaches aim to curtail the gearing effect of leverage, the absolute VaR limit is a risk-based measure that does not measure leverage per se.[7] It limits the maximum potential return loss to 20% of net asset value under normal market conditions, irrespective of the level of leverage. Consequently, depending on the type of derivatives and the volatility of the underlying assets, the absolute VaR limit allows a higher use of derivatives and leverage relative to alternative approaches.
3 Empirical findings
After the adoption of the Commission Directive in July 2010, the use of derivatives increased for leveraged funds, including alternative UCITS often referred to as “Newcits”. Chart 1 plots derivative exposures as a share of total portfolio value over time for UCITS bond funds that were leveraged and unleveraged before July 2010.[8] While the use of derivatives remained relatively stable for unleveraged funds, it increased for leveraged funds after the regulatory change. This increase in the use of derivatives for some UCITS funds is in line with media and industry reports describing the rise of alternative UCITS. These include leveraged UCITS funds that invest in derivative instruments increasing synthetic exposures.[9]
Chart 1
Use of derivatives for leveraged and unleveraged bond funds before and after the regulatory change
(y-axis: derivative exposures as share of total portfolio value; x-axis: year)

Source: Authors’ calculations based on Lipper IM (Thomson Reuters).
Notes: This chart shows the derivative exposures as a share of the total portfolio value for UCITS bond funds that were leveraged before July 2010 (blue line) and funds that were unleveraged in all periods before July 2010 (yellow line). The vertical line represents the adoption of Commission Directive 2010/43/EU. The full sample includes 5,227 unique fund share-classes from 2,032 actively managed unique UCITS funds between January 2007 and August 2018 (see Molestina Vivar et al., 2019).
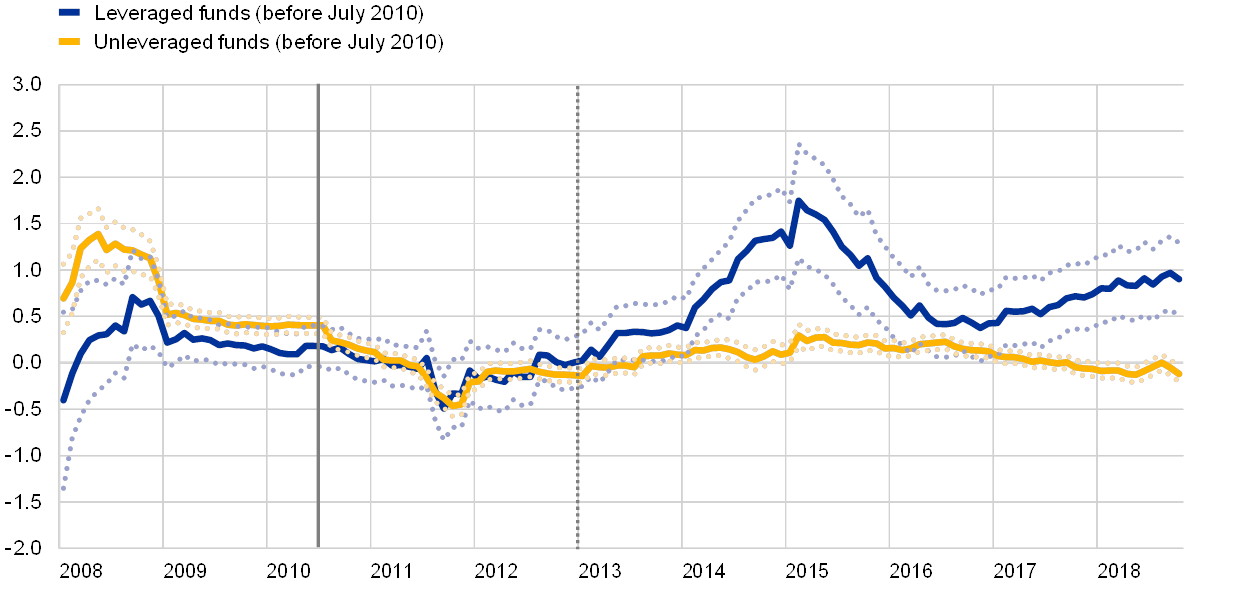
Since the regulatory change, investors in leveraged funds reacted more strongly to negative returns compared with investors in unleveraged funds. Chart 2 shows the flow-performance relationship over time for funds that were leveraged and unleveraged before July 2010. Before the regulatory change, both groups moved largely in parallel. Afterwards, however, investors in leveraged funds reacted more strongly to negative returns than investors in unleveraged funds. This finding is confirmed in a difference-in-differences framework, suggesting that the change to the UCITS framework increased investors' sensitivity to negative returns for leveraged funds.
Chart 2
Flow-performance relationship for leveraged and unleveraged funds before and after the regulatory change
(y-axis: flow-performance sensitivity; x-axis: year)
Source: Authors’ calculations based on Lipper IM (Thomson Reuters).
Notes: This figure plots the flow-performance sensitivities using rolling-window estimates for UCITS bond funds that were leveraged before July 2010 (blue line) and UCITS bond funds that were unleveraged in all periods before July 2010 (yellow line). The first vertical line marks the adoption of Commission Directive 2010/43/EU (July 2010), while from the second vertical line onwards (January 2013) the rolling window estimates are based on post-Directive observations only. Controls include lagged flows, funds’ total net assets, age, cash holdings, total expense ratio, load costs and past year’s return volatility (see Molestina Vivar et al., 2019).
Leverage is used more by absolute VaR funds compared with other UCITS funds, while their investors react more strongly to negative returns. Table 1 compares leverage and the flow-performance relationship between absolute VaR funds and other UCITS funds following either the commitment approach or the relative VaR limit. Absolute VaR funds use leverage more than other UCITS funds, in particular through derivatives (see rows 1‑3). Furthermore, investors in absolute VaR funds react more procyclically to negative returns than investors in other UCITS funds (row 5), although this is not the case for positive returns (row 4).
Table 1
Absolute VaR funds in comparison to other UCITS funds
(sample means; regression coefficients)

Sources: Authors’ calculations based on Lipper IM (Thomson Reuters). The regulatory limits are hand-collected from funds’ investor prospectuses.
Notes: This table shows (i) the means of leverage dummy variables and (ii) the flow-performance coefficients for the group of funds using the absolute VaR approach, compared with the remaining UCITS funds using alternative regulatory approaches. The first three rows show the dummy means, indicating whether a fund uses leverage according to the respective definition or not. “Leveraged” funds have either financial or synthetic leverage. The variable for “financially leveraged” is taken from the Lipper IM database. “Synthetically leveraged” captures those funds holding derivatives positions that are not used for hedging purposes and with an average CAPM Beta above one. The last two rows show coefficient estimates from a flow-performance model indicating sensitivities of flows after positive and negative returns respectively (see Molestina Vivar et al., 2019). Asterisks denote standard statistical significance (* p < 0.1, ** p < 0.05, *** p < 0.01).
Leverage is an important driver in investors’ redemption decisions, suggesting greater outflows for leveraged funds after negative fund performance. Chart 3 plots the relationship between past fund returns and investor flows in UCITS bond funds, based on a semiparametric regression model. While the flow-performance relationship is similar after positive returns, outflows are larger for leveraged funds than for unleveraged funds following negative returns. This result is confirmed in a linear flow-performance regression model, controlling among other variables for fund and time-fixed effects.[10] Corroborating evidence is provided showing that additional security sales from fund managers in leveraged funds increase negative externalities among investors during stressed periods.[11] This may explain investors’ increased sensitivity in leveraged funds to negative fund performance.
Chart 3
Flow-performance relationship for leveraged and unleveraged UCITS bond funds
(y-axis: net flows as percent of lagged total assets; x-axis: lagged relative return, in percentage points)

Source: Authors’ calculations based on Lipper IM (Thomson Reuters).
Notes: This figure plots the semiparametric relationship between net flows as a percentage of a fund’s lagged total net assets (y-axis) and lagged fund returns, relative to the fund’s benchmark returns, in percentage points (x-axis) based on Robinson (1988), for leveraged and unleveraged UCITS bond funds. The sample includes 5,227 unique fund share-classes from 2,032 actively managed unique funds between January 2007 and August 2018. Controls include lagged flows, funds’ total net assets, total expense ratio, load costs and past year’s return volatility (see Molestina Vivar, Wedow and Weistroffer, 2019). The blue (yellow) line represents the semiparametric function for leveraged (unleveraged) funds and the corresponding dotted lines represent the 90% confidence intervals.
4 Conclusion
The findings presented in this article provide evidence that leverage amplifies the flow-performance nexus after negative fund returns. A change in the UCITS framework in July 2010 facilitated the use of derivatives, increasing leverage for some bond funds. Investors in leveraged funds react more strongly to negative past performance than investors in unleveraged funds, suggesting greater outflows for leveraged funds during these periods. Leverage in UCITS funds thus adds to procyclicality and can amplify fragilities in the sector.
Leverage may have played a role in amplifying outflows in some recent cases where UCITS funds faced substantive liquidity mismatches. Between July 2018 and June 2019, sixteen mutual funds held by three asset managers under the UCITS Directive experienced significant investor outflows after a deterioration in portfolio liquidity. In these cases, poor past performance in combination with illiquid asset holdings prompted investors to withdraw their money, which resulted in almost bank-like runs.[12] Although the extent to which derivatives and leverage played a role in the outflows is unclear, it is noteworthy that at least fourteen of the sixteen funds involved were leveraged UCITS funds and used the absolute VaR approach as a regulatory limit.[13]
While the UCITS framework has contributed to the growth of the investment fund sector, possible regulatory shortcomings regarding the use of leverage may need to be further addressed. The UCITS framework has successfully contributed to the widespread expansion of investment funds as one of the main investment vehicles in Europe.[14] Considering the findings presented and the corroborating evidence provided by the recent investor turmoil, leverage can however amplify procyclicality and fragilities in the UCITS bond fund sector. From a financial stability perspective, it is important to investigate how leverage interacts with other factors that can add to negative externalities, such as fund illiquidity or certain investor types.[15] In this regard, regulatory exposure limits, in particular the use of the absolute VaR, may need to be reviewed. More generally, rules regarding fund leverage should also take into account other risk factors, including possible liquidity mismatches to ensure the sector’s resilience in a stress scenario.
5 References
Asset Management and Investors Council and European Fund and Asset Management Association, “Use of Leverage in Investment Funds in Europe”, AMIC/EFAMA, July 2017.
Breuer P, “Measuring off-balance-sheet leverage”, Journal of Banking & Finance, 26(2‑3), 2002, pp. 223‑42.
Committee of European Securities Regulators, ”CESR's Guidelines on Risk Measurement and the Calculation of Global Exposure and Counterparty Risk for UCITS”, CESR, 2010.
Chen, Q., Goldstein, I. and Jiang, W., “Payoff complementarities and financial fragility: Evidence from mutual fund outflows”, Journal of Financial Economics, 97(2), Elsevier, 2010, pp. 239‑262.
European Central Bank, “Green Paper on the enhancement of the EU framework for investment funds”, ECB, 2005.
European Fund and Asset Management Association, “The evolving investment strategies of UCITS. EFAMA report on the so‐called ‘Newcits’ phenomenon”, EFAMA, April 2011.
European Securities and Markets Authority, “Synthetic leverage in the asset management industry. ESMA Report on Trends, Risks and Vulnerabilities”, ESMA, 2016.
Goldstein, I., Jiang, H. and Ng, D.T., “Investor flows and fragility in corporate bond funds”, Journal of Financial Economics, 126(3), 2017, pp. 592‑613.
International Organization of Securities Commissions, “IOSCO Report: Leverage”. Consultation Paper, IOSCO, November 2018.
Massa, A. and Torres, C., “Liquidity and a ‘Lie’: Funds Confront $30 Trillion Wall of Worry”, Bloomberg, June 2019.
Molestina Vivar, L., Wedow, M. and Weistroffer, C., “Burned by leverage? Procyclical flows and fragility in mutual bond funds”, Working Paper Series, forthcoming, ECB, Frankfurt am Main, 2019.
Pozen, R., “The case for labelling Newcits as complex”, Financial Times, December 2011.
Robinson, P.M., “Root-N-consistent semiparametric regression”, Econometrica: Journal of the Econometric Society, 1988, pp. 931‑954.
Thompson, J., “European Ucits fund assets reach €10tn landmark”, Financial Times, July 2019.
van der Veer, K., Levels, A., Lambert, C., Molestina Vivar, L., Weistroffer, C., Chaudron, R. and de Sousa van Stralen, R., “Developing macroprudential policy for alternative investment funds”, Occasional Paper Series, No 202, ECB, Frankfurt am Main, November 2017.
Findings presented in this article are based on Molestina Vivar, L., Wedow, M. and Weistroffer, C. (2019), “Burned by leverage? Procyclical flows and fragility in mutual bond funds”, Working Paper Series, forthcoming, ECB. The views expressed are those of the authors and do not necessarily reflect the position of the European Central Bank.
Leverage refers to a financial technique used to increase a fund’s investment exposure. This can either be achieved by borrowing money, referred to as financial leverage, or by using financial instruments such as derivatives, referred to as synthetic leverage (see for instance Breuer, 2002, European Securities and Markets Authority, 2016, or International Organization of Securities Commissions, 2018). While data on financial leverage is readily available, synthetic leverage is approximated if funds have a CAPM Beta above one on average and make use derivatives that are not for hedging purposes (Molestina Vivar et al., 2019).
See, for instance, Chen et al. (2010) and Goldstein et al. (2017).
According to Directive 2001/108/EC (commonly referred to as UCITS III), the maximum potential exposure relating to derivative instruments should not exceed the total net value of the UCITS's portfolio.
Following Directive 2009/65/EC (referred to as UCITS IV), Commission Directive 2010/43/EU provides legislative clarification with respect to the calculation of global exposures. UCITS IV states that global exposure to derivative instruments should not exceed the total net value of the portfolio, although it does not provide criteria for assessing the adequacy of the risk management process or detail rules regarding the assessment of the value of derivatives. The Committee of European Securities Regulators’ July 2010 technical guidelines specify the calculation methods for each approach (Committee of European Securities Regulators, 2010).
UCITS management companies are required by their respective EU Member State to ensure that the method selected to measure global exposure is appropriate, taking into account the investment strategy pursued by the UCITS and the types and complexities of the financial derivative instruments used, as well as the proportion of the UCITS portfolio that comprises financial derivative instruments (Committee of European Securities Regulators, 2010).
See for instance Asset Management and Investors Council and European Fund and Asset Management Association (2017).
Note that the Commission Directive was not transposed into national law until after July 2010. In Luxembourg, which hosts most of the UCITS funds in our sample, the regulatory changes were transposed into national law in December 2010, although the VaR approach was already available before for some “sophisticated” funds. The deadline for EU Member States to transpose the Directive was 30 June 2011.
See for instance European Fund and Asset Management Association (2011) or Pozen (2011).
Other control variables include the fund’s total expense ratio, load costs, fund size, age, cash holdings, and past year’s return volatility to proxy for the riskiness of the fund’s assets. The greater investor sensitivity following negative fund performance for leveraged relative to unleveraged funds is also confirmed in a previous ECB study, which applies a flow-performance model, based on the one presented in this article, to a sample of alternative investment funds (see van der Veer et al., 2017).
Molestina Vivar et al. (2019) investigate how leverage amplifies negative externalities among investors. As a response to net outflows, leveraged funds are expected to sell additional assets, for instance to keep their leverage constant. Leveraged funds also need to delever proportionally more than unleveraged funds to cover margin calls and higher haircuts on leveraged positions during stressed periods. Given the same amount of net outflows, leveraged funds will therefore have to sell a greater amount of assets and are expected to face higher associated valuation losses than unleveraged funds. To avoid internalising costs from additional security sales during negative periods, investors in leveraged funds may therefore have greater incentives to redeem early relative to investors in unleveraged funds.
See, for instance, Massa, A. and Torres, C. (2019).
The reported leverage levels and the regulatory limits are provided in the investor prospectuses for fourteen out of the sixteen funds. While one fund does not provide its prospectus online, another fund’s prospectus neither provides information on its leverage level nor on its regulatory limit.
See for instance European Central Bank (2005) and Thompson (2019).
See Molestina Vivar et al. (2019).