
- STATISTICAL RELEASE
Euro area economic and financial developments by institutional sector: second quarter of 2021
29 October 2021
- Euro area net saving increased to €716 billion in four quarters to second quarter of 2021, compared with €562 billion one quarter earlier
- Household debt-to-income ratio increased to 96.6% in second quarter of 2021 from 94.6% one year earlier
- Non-financial corporations' debt-to-GDP ratio (consolidated measure) decreased to 80.5% in second quarter of 2021 from 81.1% one year earlier
Total euro area economy
Euro area net saving increased to €716 billion (7.6% of euro area net disposable income) in the four quarters to the second quarter of 2021 compared with €562 billion in the four quarters to the previous quarter. Euro area net non-financial investment grew to €381 billion (4.1% of net disposable income), mainly due to increased investment by households and non-financial corporations (see Chart 1).
Euro area net lending to the rest of the world increased to €345 billion (from €293 billion previously) reflecting net saving growing more than net non-financial investment. Net lending of non-financial corporations increased to €323 billion (3.4% of net disposable income) from €256 billion while that of financial corporations increased to €124 billion (1.3% of net disposable income) from €117 billion. Net lending by households decreased to €728 billion (7.7% of net disposable income) from €874 billion. The overall decrease in net lending by the total private sector was more than offset by a decline in net borrowing by the government sector (-8.8% of net disposable income, after -10.6% previously).
Chart 1. Euro area saving, investment and net lending to the rest of the world
(EUR billions, four-quarter sums)
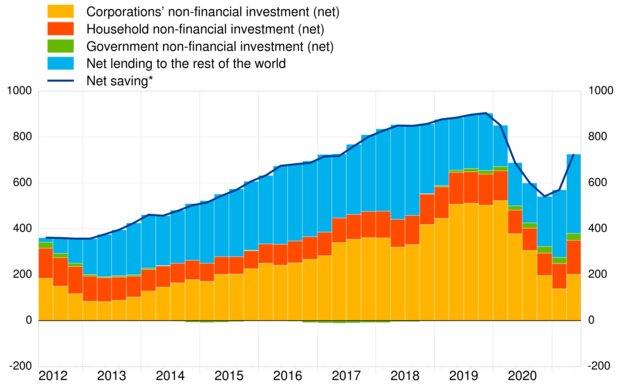
* Net saving minus net capital transfers to the rest of the world (equals change in net worth due to transactions).
Households
The annual growth rate of household financial investment decreased to 4.1% in the second quarter of 2021, from 4.6% in the previous quarter. This deceleration was mainly due to currency and deposits growing at a lower rate of 6.7% (after 8.1%), and net sales of debt securities increasing more strongly (-10.0% after -7.6%) (see Table 1 below).
Households were net buyers of listed shares. By issuing sector, they were net buyers of listed shares of non-financial corporations, other financial institutions, insurance corporations and the rest of the world (i.e. shares issued by non-residents), while shares of MFIs were sold on a net basis. Households continued to sell debt securities (in net terms) issued by MFIs, other financial institutions, government and the rest of the world (see Table 2.2. in the Annex).
The household debt-to-income ratio[1] increased to 96.6% in the second quarter of 2021 from 94.6% in the second quarter of 2020, as loans to households grew faster than disposable income. The household debt-to-GDP ratio increased to 61.1% in the second quarter of 2021 from 60.0% in the second quarter of 2020 (see Chart 2).
Table 1. Financial investment and financing of households, main items
(annual growth rates)
Financial transactions |
|||||
2020 Q2 |
2020 Q3 |
2020 Q4 |
2021 Q1 |
2021 Q2 |
|
Financial investment* |
3.4 |
3.7 |
4.1 |
4.6 |
4.1 |
Currency and deposits |
6.4 |
6.9 |
7.9 |
8.1 |
6.7 |
Debt securities |
-10.5 |
-6.2 |
-8.0 |
-7.6 |
-10.0 |
Shares and other equity |
2.2 |
2.5 |
2.3 |
3.0 |
2.9 |
Life insurance and pension schemes |
1.9 |
1.6 |
2.0 |
2.4 |
2.3 |
Financing** |
2.8 |
2.8 |
3.0 |
3.2 |
3.7 |
Loans |
3.0 |
3.1 |
3.0 |
3.5 |
4.0 |
* Items not shown include: loans granted, prepayments of insurance premiums and reserves for outstanding claims and other accounts receivable.
** Items not shown include: financial derivatives' net liabilities, pension schemes and other accounts payable.
Chart 2. Debt ratios of households and non-financial corporations
(debt as a percentage of GDP)
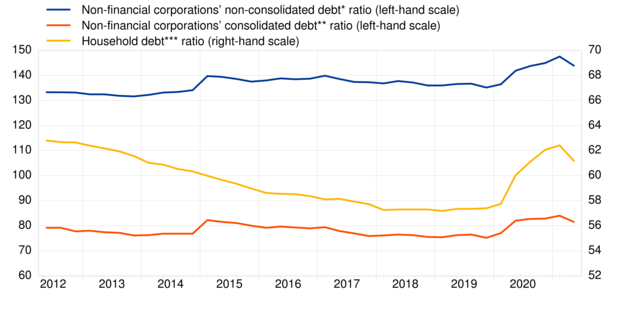
* Outstanding amount of loans, debt securities, trade credits and pension scheme liabilities.
** Outstanding amount of loans and debt securities, excluding debt positions between non-financial corporations.
*** Outstanding amount of loan liabilities.
Non-financial corporations
In the second quarter of 2021, the annual growth of financing of non-financial corporations stood at a broadly unchanged rate of 2.3% compared with the previous quarter, this being the result of a deceleration in financing by debt securities and loans and an acceleration in financing by shares and other equity as well as trade credits (see Table 2 below). Loan financing decelerated as a result of a lower growth of loans from MFIs, other financial corporations and government, while intercompany loans increased at a higher rate and loans from the rest of the world declined at a lower rate (see Table 3.2 in the Annex).
Non-financial corporations' debt-to-GDP ratio (consolidated measure) decreased to 80.5% in the second quarter of 2021, from 81.1% in the second quarter of 2020; conversely, the non-consolidated, wider debt measure increased to 143.7% from 141.8%, as the non-consolidated debt grew faster than GDP, mainly due to the growth of trade credits and loans between non-financial corporations (see Chart 2).
Table 2. Financial investment and financing of non-financial corporations, main items
(annual growth rates)
Financial transactions |
|||||
2020 Q2 |
2020 Q3 |
2020 Q4 |
2021 Q1 |
2021 Q2 |
|
Financing* |
1.9 |
2.0 |
2.0 |
2.2 |
2.3 |
Debt securities |
13.2 |
12.4 |
12.1 |
9.5 |
2.2 |
Loans |
3.3 |
3.0 |
3.5 |
2.8 |
2.3 |
Shares and other equity |
1.2 |
1.4 |
1.1 |
1.3 |
1.6 |
Trade credits and advances |
-5.2 |
-3.4 |
-2.2 |
1.3 |
7.8 |
Financial investment** |
2.3 |
2.7 |
3.3 |
4.0 |
4.5 |
Currency and deposits |
18.5 |
20.4 |
19.4 |
16.8 |
7.5 |
Debt securities |
28.6 |
22.5 |
22.3 |
4.8 |
0.2 |
Loans |
-0.7 |
-0.5 |
0.3 |
1.8 |
4.5 |
Shares and other equity |
2.0 |
2.0 |
1.8 |
1.8 |
2.2 |
* Items not shown include: pension schemes, other accounts payable, financial derivatives’ net liabilities and deposits.
** Items not shown include: other accounts receivable and prepayments of insurance premiums and reserves for outstanding claims.
For queries, please use the Statistical information request form.
Notes
- These data come from a second release of quarterly euro area sector accounts from the European Central Bank (ECB) and Eurostat, the statistical office of the European Union. These data come from a second release of quarterly euro area sector accounts from the European Central Bank (ECB) and Eurostat, the statistical office of the European Union. This release incorporates annual revisions as from the first quarter of 1999 and completed data for all sectors compared with the first quarterly release on "Euro area households and non-financial corporations" of 4 October 2021.
- The debt-to-GDP (or debt-to-income) ratios are calculated as the outstanding amount of debt in the reference quarter divided by the sum of GDP (or income) in the four quarters to the reference quarter. The ratio of non-financial transactions (e.g. savings) as a percentage of income or GDP is calculated as sum of the four quarters to the reference quarter for both numerator and denominator.
- The annual growth rate of non-financial transactions and of outstanding assets and liabilities (stocks) is calculated as the percentage change between the value for a given quarter and that value recorded four quarters earlier. The annual growth rates used for financial transactions refer to the total value of transactions during the year in relation to the outstanding stock a year before.
- The next release of the Household Sector Report containing results for the euro area and all EU countries is scheduled for 10 November 2021.
- Hyperlinks in the main body of the statistical release lead to data that may change with subsequent releases as a result of revisions. Figures shown in annex tables are a snapshot of the data as at the time of the current release.
- The production of quarterly financial accounts (QFA) may have been affected by the COVID-19 crisis. More information on the potential impact on QFA can be found here.
- Calculated as loans divided by gross disposable income adjusted for the change in pension entitlements.