
The rise of services and the transmission of monetary policy
Speech by Benoît Cœuré, Member of the Executive Board of the ECB, at the 21st Geneva Conference on the World Economy, 16 May 2019
One of the biggest mysteries currently facing central banks around the world is why inflation has failed to pick up more forcefully after years of extraordinary monetary stimulus.[1] This is one of the most fiercely debated topics in macroeconomics, with few definitive answers.
Many explanations have been put forward, including discussions on the appropriate measure of economic slack, the role of inflation expectations and the effects of globalisation and digitalisation.[2]
One aspect that has received much less attention in the public discussion, however, relates to the impact of the structural transformation of our economies on inflation dynamics and monetary policy transmission.
There are many dimensions to this transformation to which central banks should remain alert, including the impact of ageing and, looking forward, climate change.[3] In my remarks this evening, I will focus on another dimension. Across advanced economies, secular forces have shifted economic activity, employment and consumption expenditure away from manufactured goods and towards services.
In my remarks this evening, I will argue that these secular forces are likely to have played, and continue to play, a non-negligible role in explaining the sluggish response of inflation to economic activity and monetary policy in recent years.
I will start by presenting some stylised facts that illustrate the extent of past changes in consumption and production patterns in the euro area, the United States and Japan. I will then explain how these changes, and the shift towards services, are likely to have affected monetary policy transmission on both sides of the Atlantic.
In short, prices in the services sector change much less frequently than in other sectors and are less sensitive to exchange rates. This means that it takes longer for inflation to respond to changes in monetary policy and economic activity than it did a few decades ago.
I will also suggest that the rise of the services sector in our economies has only affected the pace of the response of inflation to shocks, but not the overall effectiveness of monetary policy. In other words, the effects of monetary policy take longer to pass through the economy but they have not become less powerful.
Finally, I will argue that policies that can help raise productivity and competition in the services sector may contribute to reduce the lags with which monetary policy is transmitted to consumer prices.
The rise of the service economy
One of the most striking trends in advanced economies over the past few decades has been the growing importance of the services sector in aggregate economic activity.
Three stylised facts document this rise.[4]
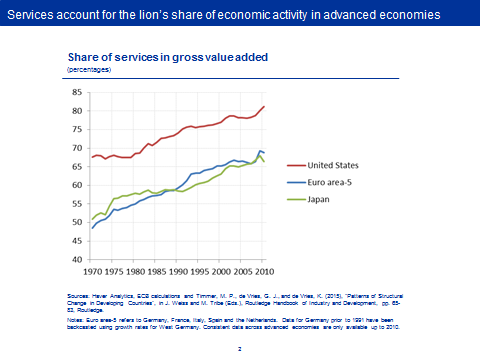
First, from 1970 to 2010, the share of services in total gross value added increased by more than 20 percentage points in the euro area and by about 14 and 16 percentage points in the United States and Japan respectively. You can see this on my first slide.
Second, and unsurprisingly given that many services are labour intensive, there has been an even greater increase in the percentage of the workforce employed in the services sector. You can see this on my next slide. In 2010, the services sector accounted for three-quarters of the jobs in the euro area, while in 1970 this figure was about 45%. The situation in the United States is even more stark. In 2010, the services sector accounted for nearly 85% of jobs.

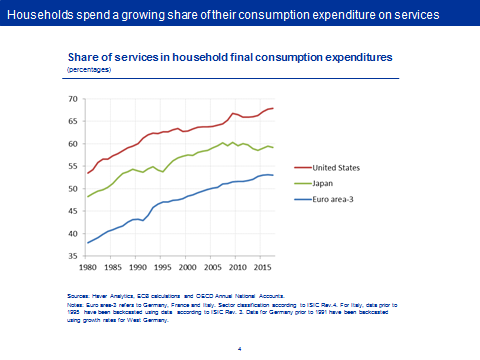
And, third, over the past 40 years we have seen a significant increase in the consumption of services by households.[5] You can see this on my next slide. Services in the euro area today account for more than 50% of final consumption, compared with less than 40% in 1980. In the United States, households today spend nearly 70% of their consumption expenditure on services, and in Japan, this figure is 60%.
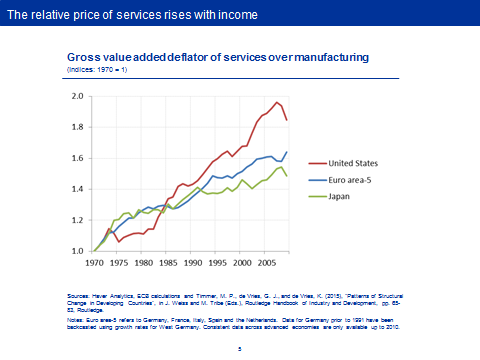
These developments have been studied widely in the literature.[6] William Baumol’s famous “cost disease” channel, for example, predicted that lower productivity growth would raise the relative price of services compared with manufacturing, which in turn would affect the sectoral allocation of consumption and labour.[7]
You can see this clearly on my next slide. Across advanced economies, the output price of services relative to manufacturing goods has risen steadily as productivity gains in the manufacturing sector have outpaced productivity gains in the services sector. As a result, households in advanced economies are allocating less and less of their expenditure to goods, which are getting cheaper, and are instead spending more on services, whose relative prices increase with income over time.[8]
Work by David Autor and others, on the other hand, has documented how technological progress and globalisation have caused profound sectoral shifts in employment in the United States.[9] Their research focused mainly on the flipside of the developments in the services sector – that is, on the stark decline in manufacturing employment.
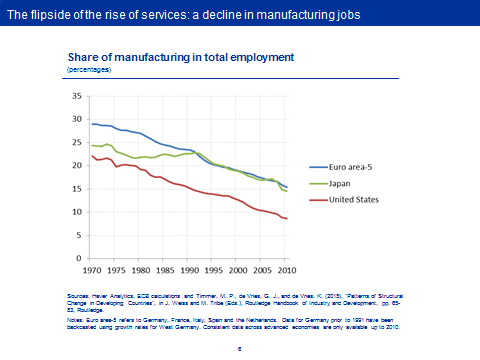
You can see this on my next slide. Since the 1970s, the manufacturing sector’s share of total jobs in the United States and the euro area has practically halved. Today, only around 15% of workers in the euro area are employed in the manufacturing sector.[10] In the United States, the figure is less than 10%. The research by David Autor and others has sensitised policymakers to the challenges that global trade and automation may bring in terms of inequality and social cohesion.[11]
Services, inflation and the transmission of monetary policy
A question that has received much less attention in central banking circles, however, is whether and how the rise of the services sector has affected the transmission of monetary policy, and whether it has contributed to the stubbornly weak inflationary pressures that we are observing today.
There are at least two broad and complementary channels through which this may happen.
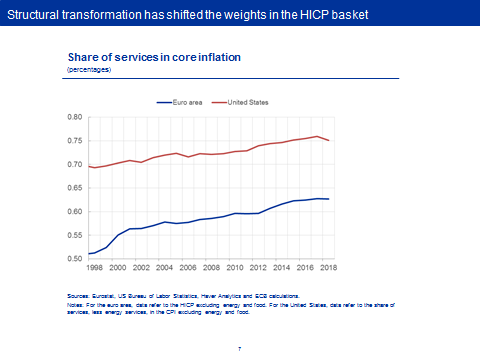
The first channel relates to a composition effect – that is, to the changing weight of services in the consumption basket. As final consumption expenditures shift, so do the weights used to calculate inflation. You can see this on my next slide. The weight of services in euro area core inflation has increased by around 10 percentage points since the launch of the single currency in 1999.[12] In the United States, services today account for three-quarters of the core CPI basket.
If prices in the services sector differ in terms of level, volatility and persistence compared with other sectors, this can be expected to affect aggregate inflation dynamics.
The second channel relates to a transmission effect – that is, differences in how the economy reacts to monetary impulses from the central bank. If services and manufacturing differ with respect to their nominal and real rigidities, or feature different interest and exchange rate sensitivities, then monetary policy will be transmitted differently through the economy. To put it simply, the investment-saving (IS) curve may have a different slope depending on the weight of services in the economy.
In what follows I will argue that both the composition and transmission effects could help us improve our understanding of recent inflation dynamics across advanced economies.
The composition effect
Idiosyncratic shocks in the services sector account for a larger share of aggregate fluctuations today than they did in the past. Today, an arbitrary increase in service price inflation raises euro area core inflation by nearly 25% more than it did in the mid-1990s. On my next slide you can see that, all else being equal, euro area core inflation would have been around 15 basis points lower in 2018 were it not for the increase in the weight of services in the euro area HICP.
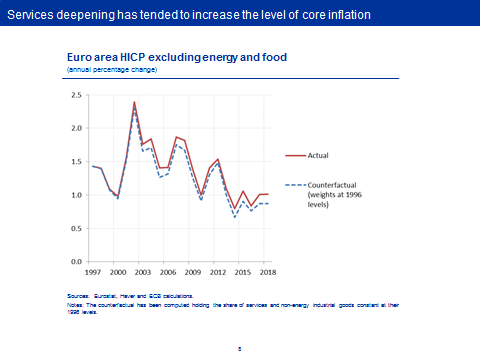
So, consistent with Baumol’s cost disease effect, the shift towards services, whose relative prices increase over time, has tended to lift the level of core inflation.[13] This is also consistent with the limited support often found in the literature for global factors in driving domestic underlying inflation, and with evidence of a declining pass-through of exchange rate changes to final consumer prices since the 1970s and 80s.[14]
Put differently, those products that are most exposed to international competition, that are imported or that have a large import content have gradually become less significant drivers of aggregate inflation outcomes over time. For example, the import content of non-energy industrial goods is close to 20% in the euro area HICP, compared with just 8% for services. I will come back to this in a minute.
The transmission effect
Even more relevant for policymakers, however, is the effect of structural transformation on the persistence of inflation. This can be best illustrated when considering the impact of the second channel I mentioned before, namely the way monetary policy propagates through the economy.
To measure the effects of services deepening on the economy, Eurosystem staff have used a structural model of the euro area to compare how the changes in the structure of the euro area economy between 1970 and 2010 have affected the response of inflation and output to an easing of monetary policy.[15]
On my next slide you can see the results. Three observations stand out.
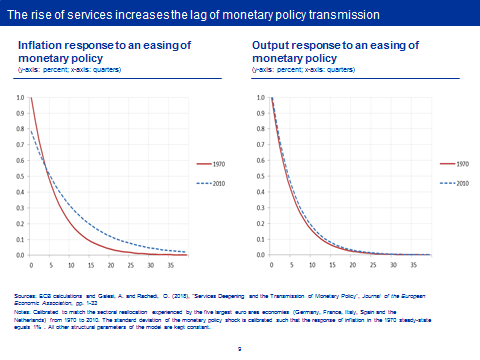
First, today the (simulated) immediate reaction of inflation to an easing of monetary policy is roughly 20% smaller than it was in 1970.[16] You can see this by the blue dashed line being well below the red line for the first year or so.
Second, over a longer horizon, monetary policy affects inflation outcomes more strongly than previously, meaning its effects are distributed more evenly over time.
Third, the real effects of monetary policy – that is, its effects on employment and growth – have changed much less over the past few decades and are, at the margin, even slightly stronger today. You can see this on the right-hand side.
Let me now try to make sense of these three observations.
Services and price rigidities
The key insight for understanding these three effects is the different behaviour of price-setters across economic sectors. In particular, there is a large and growing body of evidence that shows that prices in the services sector are considerably “stickier” than in all other sectors in the economy – that is, they adjust less frequently.[17]
Take the micro evidence presented by the Eurosystem’s Inflation Persistence Network. In the euro area, 5.6% of prices in the services sector change each month, compared with 9.2% for non-energy industrial goods and 28% for unprocessed food.[18]
Housing services, meanwhile, which account for a quarter of the services weight in the euro area HICP, are among the most rigid prices in the economy. Apartment rents in Germany, for example, remain unchanged for more than four years, on average.[19] Ranking industries by frequency of price changes produces remarkably consistent results across economies, both within and outside the euro area.[20]
Estimates of sectoral Phillips curves corroborate these findings. For France, for example, estimates show that the frequency of price changes across sectors ranges from a single quarter to almost two years. In virtually all service industries, the frequency of price changes is towards the upper end of this range.[21]
There are at least two factors that may help explain why services prices may react more sluggishly to changes in firms’ external conditions. One is that wages account for around 40% of input costs in services, compared with 20% in the manufacturing sector.[22] Just think of education, health, childcare, restaurants and so forth. Wage rigidity implies that the costs of producing most services are relatively stable over time, resulting in less need for price adjustments.
Another factor relates to competition. Evidence shows that markups in the services sector are higher, on average, than in the manufacturing sector, partly reflecting reduced exposure to foreign competition.[23] Although the share of services in total global trade has increased somewhat since 1970, they still only account for around a fifth of total global exports today.[24] Lower competition may allow services firms to adjust their prices less frequently.
The implication is that the rise of the services sector has measurably lowered the median frequency of price changes in the economy and, therefore, the response of inflation to changes in demand and monetary policy in the short term, as you can see on the left-hand side of my slide.
But in the medium term, as more and more firms readjust their prices as economic conditions improve, inflation will respond more forcefully. The model predicts that, after around two and a half years, the cumulative effects of monetary policy on inflation are higher today than in 1970. To sum up, services deepening implies that monetary policy takes more time to be transmitted to inflation, but its effectiveness has not diminished.
This is also true for the impact of monetary policy on growth and employment, as you can see on the right-hand side. In a nutshell, there are two opposing forces at work. On the one side, services are, on average, less interest-rate sensitive – that is, the IS curve is flatter, which in principle makes a service-based economy less responsive to monetary policy.
But because prices are now more rigid on the whole, more of the adjustment in the economy needs to happen through changes in quantities rather than prices. Rigid prices are the reason why monetary policy has real effects in the first place. This latter effect may more than offset the reduced interest rate sensitivity, leading to the picture you can see on the right-hand side.[25]
The rise of services as a production input
And yet, one may correctly argue that, even when taking into account the transmission effect, underlying inflation in the euro area today remains too low, given how much time has elapsed since we launched our monetary stimulus. Low inflation appears even more of a puzzle when considering the composition effect, which should cause inflation to rise over time, all else being equal.
Of course, a number of factors may currently be at play, many of which we do not yet understand properly, such as firms’ state-contingent pricing decisions.[26] Structural transformation is also still ongoing. Consider Spain. The services sector’s share of total employment has increased by more than 8 percentage points, to 78% since the start of 2008 alone. The unwinding of imbalances is often the catalyst for large reallocations of economic activity across sectors, which may further delay the pass-through of policy changes.
But I would argue that part of the puzzle may also relate to structural changes within the services sector, which is itself subject to transformation. I would like to highlight two of these changes.
First, all services are not made equal. Recent research shows that some services industries, mostly those that can be delivered at distance, such as telecommunications and finance, are among the most productive and thriving industries in the economy.[27] As a result, a portion of services have been found to feature a falling relative price as income rises, much like manufacturing industries.[28]
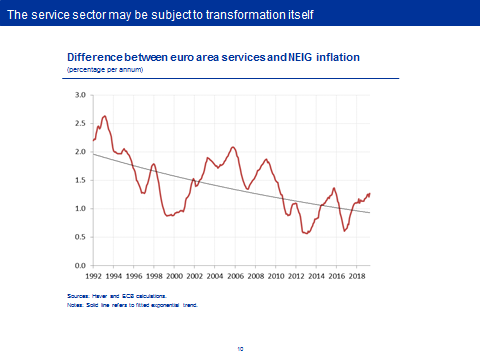
Indeed, on my next slide you can see that the difference between price inflation for services and non-energy goods has been steadily trending downwards over time, reducing overall inflationary pressures in the economy. In other words, the pace with which the relative price of services is increasing over time – Baumol’s cost disease channel – has gradually started to decelerate, at least in the euro area.[29]
The second structural change relates to the input-output structure of our economies. Services not only account for a much larger share of consumption and employment, they also make up a growing share of intermediate inputs used in the production of both services and manufacturing – a development that some have coined “servicification”.[30]
You can see this on my next slide for the case of the United States, where reliable long time series data are available. For the manufacturing sector, the proportion of total inputs accounted for by services increased from around 28% in 1970 to 32% in 2010. For the services sector, the increase is even more striking. Intermediate services increased their share of total inputs by 14 percentage points, to 87%, over the same period.

The implication is that sticker services prices spread much more widely through the economy via their effect on firms’ marginal costs.[31] On my next slide you can see the impact on the transmission of monetary policy. Eurosystem staff have calibrated the same model I mentioned before, but this time for the US economy, also taking into account the change in the input-output structure.

Clearly, the “servicification” of the US economy has contributed to further dampening the impact of monetary policy impulses on inflation in the short term, meaning it takes even longer to see the full effects of monetary easing. Data on input-output structures for the euro area suggest that the effect is likely to be of a similar magnitude on this side of the Atlantic.[32]
Again, current inflation outcomes are likely driven by a host of factors. But, all else being equal, it is now easy to see that the increase in wages that we have observed over the past year or so can be expected to take longer to pass through to final consumer prices than it did in the past.
Conclusion
I will leave you with three key takeaways tonight.
The first is that the rise of services in production and consumption over the past few decades has contributed to lift core inflation across advanced economies – making current low inflation appear even more puzzling.
The second key takeaway is that services deepening has had a profound impact on the transmission of monetary policy, also in the euro area. It has lowered the median frequency of price changes in the economy, increasing the lag with which monetary policy is transmitted to consumer price inflation.
The third and final takeaway is that the service sector itself is subject to change. The rise and expansion of “modern” services that can be delivered at distance means that competition and aggregate productivity may increase over time, thereby contributing to reducing price rigidity. Completing the single market for services in Europe, and reducing barriers to trade for services, would support this process and thereby also facilitate a faster transmission of monetary policy.[33]
Thank you.
- [1]I would like to thank Omar Rachedi, Derry O’Brien and Chiara Osbat for their contributions to this speech. I remain solely responsible for the opinions contained herein.
- [2]For an overview, see Ciccarelli, M. and Osbat, C. (2017), “Low inflation in the euro area: Causes and consequences”, Occasional Paper Series, No 181, ECB; Draghi, M. (2019), “Monetary policy in the euro area”, speech at the conference “The ECB and Its Watchers XX”, Frankfurt am Main, 27 March; Powell, J. H. (2018), “Monetary Policy and Risk Management at a Time of Low Inflation and Low Unemployment”, speech at the “Revolution or Evolution? Reexamining Economic Paradigms”, 60th Annual Meeting of the National Association for Business Economics, Boston, Massachusetts; and Cœuré, B. (2017), “Scars or scratches? Hysteresis in the euro area”, speech at the International Center for Monetary and Banking Studies, Geneva, 19 May.
- [3]See Cœuré, B. (2018), “Monetary policy and climate change”, speech at a conference organised by the Network on Greening the Financing System, the Deutsche Bundesbank and the Council on Economic Policies, Berlin, 8 November; and Nerlich, C. and Schroth, J. (2018), “The economic impact of population ageing and pension reforms”, Economic Bulletin, Issue 2, ECB.
- [4]Data on gross value added and employment may differ from national accounts data due to differences in sectoral allocations. See Timmer, M. P., de Vries, G. J., and de Vries, K. (2015), “Patterns of Structural Change in Developing Countries”, in J. Weiss, and M. Tribe (eds.), Routledge Handbook of Industry and Development, (pp. 65-83), Routledge.
- [5]Consumption data availability is more limited. The analysis therefore focuses on the three largest euro area countries and covers the period since 1980.
- [6]For an early reference, see Kuznets, S. (1959), “Quantitative Aspects of the Economic Growth of Nations: IV. Distribution of National Income by Factor Shares”, Economic Development and Cultural Change,Vol. 7, No 3, Part 2, pp. 1-100. See also Herrendorf, B., Rogerson, R. and Valentinyi, A. (2013), “Two Perspectives on Preferences and Structural Transformation”, American Economic Review, Vol. 103, No 7, pp. 2752-2789; Herrendorf, B., Rogerson, R. and Valentinyi, A. (2014), “Growth and Structural Transformation”, in Aghion, P. and Durlauf, S. N. (eds.), Handbook of Economic Growth, Vol. 2, pp. 855-941, Amsterdam: North-Holland. For the impact of the decline in manufacturing on GDP volatility, see: Carvalho, V. and Gabaix, X. (2013), “The Great Diversification and Its Undoing”, American Economic Review, Vol. 103, No 5, pp. 1697-1727; and Moro, A. (2012), “The structural transformation between manufacturing and services and the decline in the US GDP volatility”, Review of Economic Dynamics, Vol. 15, No 3, pp. 402-415.
- [7]See Baumol, W., and Bowen, W. (1966), Performing Arts, The Economic Dilemma: a study of problems common to theater, opera, music, and dance, M.I.T. Press.
- [8]Developments in per capita income are associated with changes in consumption patterns, a well-known regularity that dates back to Engel, if not further. See Engel, E. (1857), “Die Produktions- und Konsumverhältnisse des Königreichs Sachsen”, in Zeitschrift des Stat. Büros der Kgl. Sächs. Ministeriums des Inneren.
- [9]See Autor, D., Dorn, D. and Hanson, G. (2013a), “The China Syndrome: Local Labor Market Effects of Import Competition in the United States”, American Economic Review, Vol. 103, No 6, pp. 2121-2168; Autor, D. and Dorn, D. (2013b), “The Growth of Low-Skill Service Jobs and the Polarization of the US Labor Market”, American Economic Review, Vol. 103, No 5, pp. 1553-1597; and Ngai, L. R. and Pissarides, C. (2007), “Structural Change in a Multisector Model of Growth”, American Economic Review, Vol. 97, No 1, pp. 429-443.
- [10]There are, of course, notable differences across euro area countries.
- [11]See Cœuré, B. (2018), “Taking back control of globalisation: Sovereignty through European integration”, contribution to the 2018 Schuman Report on Europe, 28 March; and IMF (2018), “Manufacturing Jobs: Implications for Productivity and Inequality”, World Economic Outlook, Chapter 3, April.
- [12]Core inflation refers to the euro area HICP, excluding food and energy.
- [13]For the United States, see, for example, Wolman, A. and Ding, F. (2005), “Inflation and Changing Expenditure Shares”, Economic Quarterly, Vol. 91, No 1, Federal Reserve Bank of Richmond, Winter 2005. Of course, such simple comparisons suffer from the endogenous relationship between the relative prices of services and their impact on changes in nominal consumption weights. Yet, a large share of the increase in the consumption of services also happened in real terms.
- [14]See, for example, ECB (2017), “Domestic and global drivers of inflation in the euro area”, Economic Bulletin, Issue 4; Cœuré, B. (2017), “The transmission of the ECB’s monetary policy in standard and non-standard times”, speech at the workshop “Monetary policy in non-standard times”, Frankfurt am Main, 11 September; Mikolajun, I. and Lodge, D. (2016), “Advanced economy inflation: the role of global factors”, Working Paper Series, No 1948, ECB; and Eickmeier, S. and Pijnenburg, K. (2013), “The Global Dimension of Inflation – Evidence from Factor Augmented Phillips Curves”, Oxford Bulletin of Economics and Statistics, Vol. 75, No 1, pp. 103-122.
- [15]See Galesi, A. and Rachedi, O. (2018), “Services Deepening and the Transmission of Monetary Policy”, Journal of the European Economic Association, pp. 1-33.
- [16]In reality, inflation responds to monetary impulses with a delay and features a so-called hump-shaped response, with the peak some four to eight quarters after the initial impulse. This effect is often achieved in models by introducing inflation indexation. The precise dynamic response of inflation is not relevant for the purpose of this exercise, however. See also Dixon, H. and Kara, E. (2006), “Understanding inflation persistence: a comparison of different models,” Working Paper Series, No 672, ECB.
- [17]See, for example, Bouakez, H., Cardia, E. and Ruge-Murcia, F. (2009), “The Transmission of Monetary Policy in a Multi-Sector Economy”, International Economic Review, Vol. 50, No 4, pp. 1243-1266; Bouakez, H., Cardia, E. and Ruge-Murcia, F. (2014), “Sectoral Price Rigidity and Aggregate Dynamics”, European Economic Review, Vol. 65(C), pp. 1-22; and Nakamura, E. and Steinsson, J. (2008), “Five Facts about Prices: A Reevaluation of Menu Cost Models”, Quarterly Journal of Economics, Vol. 123, No 4, pp. 1415-1464.
- [18]See Álvarez et al. (2006), “Sticky Prices in the Euro Area: A Summary of New Micro-evidence”, Journal of the European Economic Association, Vol. 4, No 2/3, pp. 575-584. To the extent that e-commerce is contributing to further increasing the frequency of price changes of goods sold online, the difference between services and goods is likely to grow further. See Gorodnichenko, Y. and Talavera, O. (2017), “Price Setting in Online Markets: Basic Facts, International Comparisons, and Cross-Border Integration”, American Economic Review, Vol. 107, No 1, pp. 249-82.
- [19]See Hoffmann, J. and Kurz-Kim, J.-R. (2006), “Consumer price adjustment under the microscope: Germany in a period of low inflation,” Working Paper Series, No 652, ECB.
- [20]In the United States, prices are, in general, more flexible. 15% of prices in the services sector are changed each month, compared with 22% in non-energy industrial goods. See Álvarez et al. (2006), op. cit.
- [21]See Imbs, J., Jondeau, E. and Pelgrin, F. (2011), “Sectoral Phillips Curves and the Aggregate Phillips Curve”, Journal of Monetary Economics, Vol. 58, No 4, pp. 328-344.
- [22]See Bobeica, E., Ciccarelli, M. and Vansteenkiste, I. (2019), “The link between labor cost and price inflation in the euro area”, Working Paper Series, No 2235, ECB.
- [23]See Cavalleri et al. (2019), “Concentration, market power and dynamism in the euro area”, Working Paper Series, No 2253, ECB.
- [24]See IMF (2018), op. cit.
- [25]See also Nakamura, E. and Steinsson, J. (2010), “Monetary Non-Neutrality in a Multisector Menu Cost Model”, Quarterly Journal of Economics, Vol. 125, No 3, pp. 961-1013; Pastén, E., Schoenle, R. and Weber, M. (2018), “The Propagation of Monetary Policy Shocks in a Heterogeneous Production Economy”, NBER Working Paper, No 25303; and Llaudes, R. (2007), “Monetary Policy Shocks in a Two-Sector Open Economy: An Empirical Study”, Working Paper Series, No 799, ECB.
- [26]See Bobeica et al. (2019), op. cit.
- [27]See IMF (2018), op. cit.; and Stiroh, K. (2002), “Information Technology and the U.S. Productivity Revival: What Do the Industry Data Say?”, American Economic Review, Vol. 92, No 5, pp. 1559-1576.
- [28]The trend increase in the relative price of aggregate services is thus mostly driven by large expenditure categories, such as housing, government and healthcare. See Duarte, M. and Restuccia, D. (2017), “Relative Prices and Sectoral Productivity”, NBER Working Paper, No 23979; Eichengreen, B. and Gupta, P. (2013), “The two waves of service-sector growth,” Oxford Economic Papers, Vol. 65, No 1, pp. 96-123; and Berlingieri, G. (2013), “Outsourcing and the Rise in Services,” CEP Discussion Papers, No 1199.
- [29]This can also be seen on slide 4. The relative price of services in the euro area increased by 33% from 1970 to 1989 and by 21% from 1990 to 2009.
- [30]See, for example, Baldwin, R., Forslid, R. and Ito, T. (2015), “Unveiling the Evolving Sources of Value Added in Exports”, IDE-JETRO Joint Research Program Series, No 161. See also IMF (2018), op. cit. For a more general discussion, see Acemoglu et al. (2012), “The Network Origins of Aggregate Fluctuations”, Econometrica, Vol. 80, No 5, pp. 1977-2016.
- [31]See also Pastén, E., Schoenle, R. and Weber, M (2018), op. cit, and Anderton et al. (2017), “Sectoral Wage Rigidities and Labour and Product Market Institutions in the Euro Area”, Open Economies Review, Vol.28(5), pp.923–965. Changes in the input-output structure have also been found to have affected sectoral reallocation of labour, in particular though outsourcing. See Berlingieri, G. (2014), “Outsourcing and the Rise in Services”, CEP Discussion Paper, No 1199.
- [32]The World Input-Output Database suggests that, for the largest five euro area countries, the gross input share of services in the production of final services has increased by 5 percentage points, to 81%, from 1995 to 2011. For goods, it has increased by 2 percentage points, to 38%.
- [33]See also Masuch et al. (2018), “Structural policies in the euro area”, Occasional Paper Series, No 210, ECB.
Europäische Zentralbank
Generaldirektion Kommunikation
- Sonnemannstraße 20
- 60314 Frankfurt am Main, Deutschland
- +49 69 1344 7455
- media@ecb.europa.eu
Nachdruck nur mit Quellenangabe gestattet.
Ansprechpartner für Medienvertreter