
- SPEECH
Monetary policy in a pandemic: ensuring favourable financing conditions
Speech by Philip R. Lane, Member of the Executive Board of the ECB, at the Economics Department and IM-TCD, Trinity College Dublin
26 November 2020
Introduction
My aim in this speech today is to explain the role of monetary policy in the pandemic, with a natural focus on the ECB and the euro area. [1],[2] I will first review the monetary policy measures that we have taken in response to the pandemic before highlighting some of the current economic and financial challenges that confront the euro area. I will then explain why the current priority for monetary policy is to ensure favourable financing conditions to support the economic recovery and counteract the negative impact of the pandemic on the projected inflation path.
The ECB’s monetary policy measures in 2020: a recap
The scale and nature of the pandemic shock called for an extraordinary policy response. The three main tasks for the ECB since the onset of the pandemic have been: first, to stabilise markets; second, to protect credit supply; and third, to neutralise the pandemic-related downside risks to the inflation path. Addressing the first two challenges are high priorities, given that market instability and/or a credit crunch would undermine the running of an effective monetary policy; meeting the third challenge is central to delivering our price stability mandate.
In terms of our monetary policy measures, the combination of the already-low levels of our main policy rates and our previously-installed forward guidance on the future path of interest rates (which links the path of our policy rates to the robust convergence of inflation to our aim) has acted as an automatic stabiliser through the adjustment of policy rate expectations – and hence the entire spectrum of monetary conditions – to pandemic-related changes in the inflation outlook.
Since additional monetary policy measures were clearly necessary to meet the scale and special nature of the pandemic shock, we introduced a comprehensive package of complementary measures that acted along two main dimensions: (i) asset purchases; and (ii) liquidity operations. For asset purchases, an extra €120 billion was added to the ongoing asset purchase programme (APP) on 12 March and the pandemic emergency purchase programme (PEPP) was launched on 18 March; for liquidity operations, the main element was the revision of the structure and pricing of the targeted longer-term refinancing operations (TLTRO III) programme. These flagship initiatives were accompanied by a suite of supporting measures, including the easing of the collateral framework along various dimensions.[3],[4] In parallel to the monetary policy measures, the European banking supervision (Single Supervisory Mechanism) and national macroprudential authorities also quickly implemented a host of countercyclical measures.
The PEPP and the easing of conditions under the TLTRO programme have been the two cornerstones of our monetary policy response: their design and calibration are directly linked to the evolution of the pandemic and its impact on the monetary transmission mechanism and the economic outlook.
The PEPP plays a dual role of stabilising financial markets and contributing to easing the overall monetary policy stance. The stabilisation function, which is facilitated by the ability to purchase volumes in a flexible manner over time, across asset classes and countries has been successful in addressing fragmentation risks, has provided a stabilising force for markets and has helped to reverse the tightening in financial conditions that was observed earlier in the year, as illustrated by the convergence of the euro area GDP-weighted sovereign yield curve to the overnight indexed swap (OIS) curve, which is an important indicator of the euro area risk-free term structure (Chart 1).[5] Sovereign bond yields, in turn are central for determining the funding conditions of banks, corporates and households across the euro area. Moreover, the PEPP eases the monetary policy stance by extracting duration risk held by investors. By pushing down the medium-to-long end of the yield curve, the PEPP also reinforces the impact of negative interest rates and forward guidance on the path of policy rates.
Chart 1
Drivers of the euro area GDP-weighted 10-year yield
(percentage points)
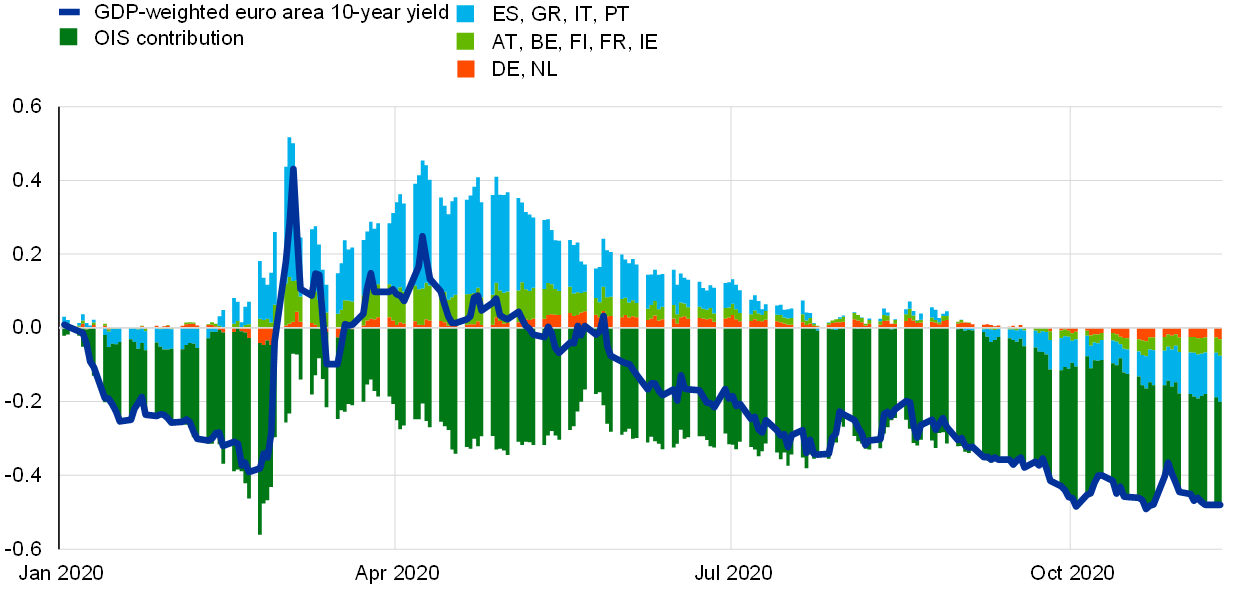
Source: ECB calculations.
Note: The latest observation is for 24 November 2020.
In addition, the easing of the conditions governing the TLTROs has been crucial in warding off the risks of a credit crunch. This effect was reinforced by an easing of collateral requirements to ensure that banks could make full use of these operations. The TLTROs incentivise banks to lend to the real economy. As shown in Chart 2, these operations have substantially supported the granting of loans to the non-financial private sector, have been effective in easing terms and conditions on bank lending and have helped keep lending rates near historic lows.
Chart 2
Evolution of expected use of TLTRO III funds
(share of respondents weighted by TLTRO III and bridge LTROs outstanding amounts)

Sources: ECB, euro area bank lending survey.
Notes: The four bars in the third column to the right measure the outstanding TLTRO III amounts in September 2020 distributed by the responses to the October 2020 BLS. The red bar measures the take-up of banks that reported that they will use TLTRO funds to substitute market funding sources. The blue bar measures the same take-up by banks that intend to use the funds for granting loans. The yellow bar reflects take-up by banks that intend to use the funds for purposes other than substituting market funding or granting loans (government securities, holding as cash, financing other financial entities, and others). The green bar reports the take-up by banks that plan to allocate the funds to more than one purpose. The bars in the first column to the left measure the outstanding TLTRO III amounts in December 2019 distributed by the responses to the January 2020 BLS. The bars in the second column in the centre measure the outstanding TLTRO III amounts in March 2020 and the amount of bridge LTROs distributed by the responses to the April 2020 BLS. Shaded areas report take-up of banks that change their expected use of funds between survey waves.
The cost of monetary policy inaction
In assessing the contribution of monetary policy to countering the pandemic shock, a natural benchmark is to calculate the adverse impact that would have materialised had monetary policy not been responsive.
To calculate the alternative path the economy would have taken in the absence of our monetary policy measures, we can construct constellations of financial conditions that would have materialised in the absence of our monetary policy actions, and then feed these counterfactual financial conditions into macroeconomic models.
A first approach to calculating counterfactual financial conditions is to employ pre-pandemic impact estimates of past monetary policy recalibrations in order to calculate by how much higher, say, average yields would have been in the absence of monetary policy action.
Counterfactual analysis by ECB staff based on this approach suggests that, absent our monetary policy measures, euro area output would be 1.3 percentage points lower and the annual inflation rate would be 0.8 percentage points lower by 2022 in cumulative terms (Chart 3).[6]
Chart 3
Estimated impact of the ECB’s decisions since March 2020 on the central tendency of inflation and economic activity
(percentage points)

Source: ECB calculations.
Notes: The estimated impact via a suite of models refers to the average across a set of models used by the Eurosystem for policy simulations, a BVAR model (Rostagno, M., Altavilla, C., Carboni, G., Lemke, W., Motto, R., Saint Guilhem, A. and Yiangou, J. (2019), “A tale of two decades: the ECB’s monetary policy at 20”, Working Paper Series, No 2346, European Central Bank), the NAWM-II model, and the ECB-BASE model.
These calculations are based on estimated elasticities of financial conditions to policy impulses that are obtained using data generated under calm market conditions: as a result, the impact estimates are typically moderate in size. It follows that this first approach to quantifying the effects of our policies is likely to underestimate by a wide margin their true effect under the macro-financial conditions generated by the extraordinary pandemic shock.
A more realistic assumption for constructing counterfactual financial conditions is to recognise that, in the event of policy inaction, financial markets – which were already highly destabilised – would have gone into a tailspin, sending the economy into a meltdown.
In the type of macroeconomic models that central banks typically use for simulation and policy analysis, it is challenging to reflect the role of monetary policy measures in providing a credible backstop against adverse tail risks – such as an arrest in the flow of credit to the economy and acute financial instability.
However, building on recent advances in the macro-econometrics of estimating the impact of financial tail risks, preliminary results by ECB staff indicate that the ECB’s removal of the financial tail risk associated with the pandemic ensured a degree of support to growth that is several times larger than the impact derived by the more limited calculation shown in Chart 3.[7],[8] In particular, as Chart 4 shows, econometric analysis that quantifies the impact of a tightening in euro area financial conditions – not only on the mean of output growth but also on different parts of its empirical distribution through quantile regression – shows a negative impact on activity that is several times larger when the economy is experiencing headwinds than in a situation in which a tightening occurs during better economic times.[9] ECB analysis also finds that our measures have been crucial in preserving the flow of credit to the economy and preventing disruptive financial instability.[10]
Chart 4
Impact on output of a tightening of credit conditions under different states of the economy
(year-on-year percentage changes)
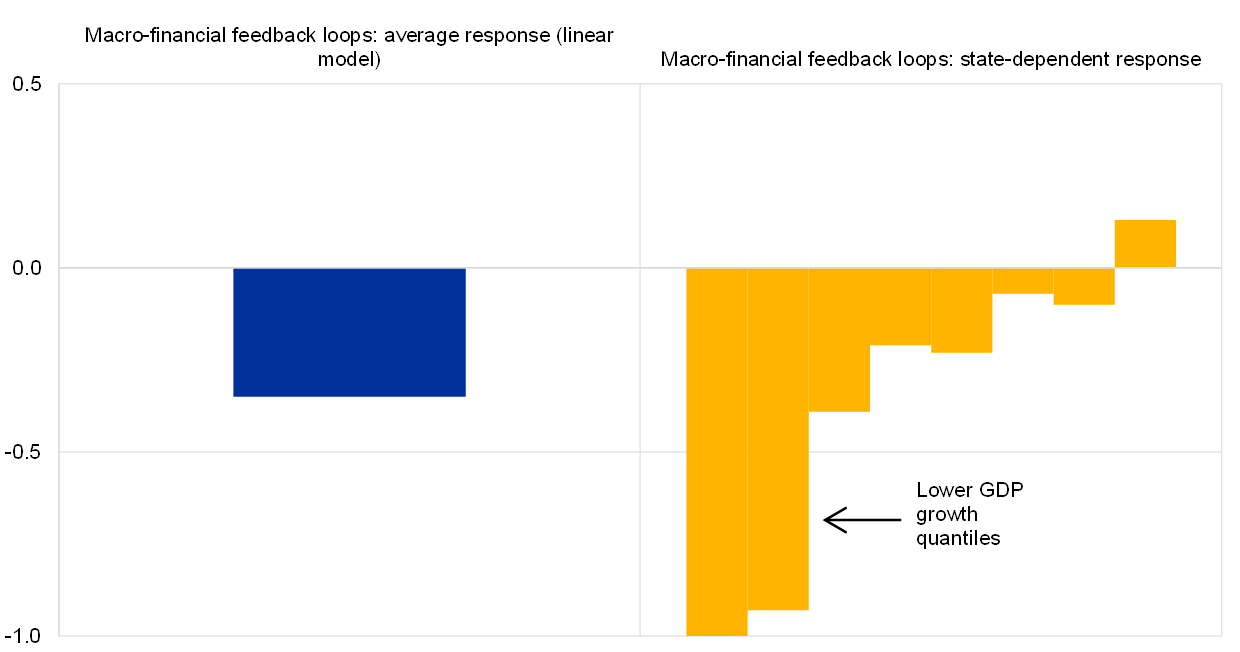
Source: ECB calculations.
Notes: The chart shows the response of real GDP growth to a tightening in financial conditions (one standard deviation) measured through a financial conditions index. The right panel shows the impact across quantiles of the GDP distribution.
Economic and financial challenges
While the recent news on vaccines is very welcome and reduces the likelihood of the most severe scenarios, the current surge in infections and the re-imposition of containment measures serve as warning signals that the recovery path will still be long and fraught with risks. Economic developments are likely to be unsteady and uneven across countries and sectors for some time to come and remain subject to elevated uncertainty.
As Chart 5 shows, the services sector is clearly bearing the brunt of the pandemic, especially those services industries (including travel, tourism and entertainment) that are most affected by social distancing and containment measures. Chart 6 shows that the impact of the pandemic also varies across countries, in line with differences in the relative importance of the services sector and available policy space.[11]
Chart 5
Sectoral decomposition of GDP
(quarter-on-quarter percentage change, percentage point contributions)

Sources: Eurostat and ECB staff calculation.
Notes: Data for the third quarter of 2020 are based on Germany, France, Spain and the Netherlands. The latest observation is the third quarter of 2020.
Chart 6
GDP growth rates across countries
(year-on-year percentage change)

Source: Eurostat.
Note: The latest observation is for the third quarter of 2020 (flash estimate).
Chart 7 shows that, despite the pandemic-related decline in hours worked and earnings, the disposable incomes in the household sector have been largely protected by countervailing fiscal measures. In terms of composition, households in the lower portion of the income distribution have been most affected by the pandemic (Chart 8). However, the results of the ECB’s pilot Consumer Expectations Survey (CES) confirm that these households are receiving a higher share of pandemic-related government support. Since, as is shown in Chart 9, lower-income households also face greater liquidity constraints and exhibit higher marginal propensities to consume, fiscal support for this group is especially important from a macroeconomic perspective.
The elevated uncertainty about future employment and wage dynamics (and, more generally, uncertainty about the wider implications of the pandemic) is leading many households to exercise caution in their consumption behaviour. This has led to very high savings rates especially among the higher-income cohorts (Chart 10 and Chart 11).[12]
Chart 7
Disposable income and consumption
(year-on-year percentage change, percentage point contributions)
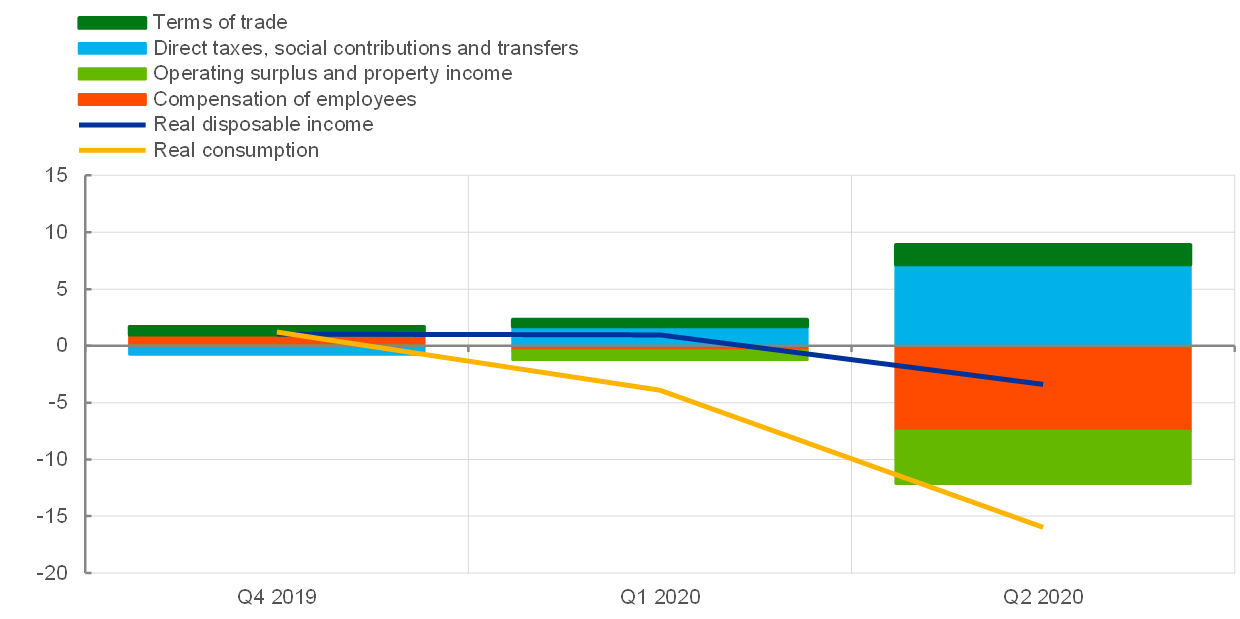
Sources: Eurostat and ECB staff calculations.
Note: The latest observation is for the second quarter of 2020.
Chart 8
Decline in hours worked and government support by income percentiles
(x-axis: income percentiles, y-axis: percentage of respondents)
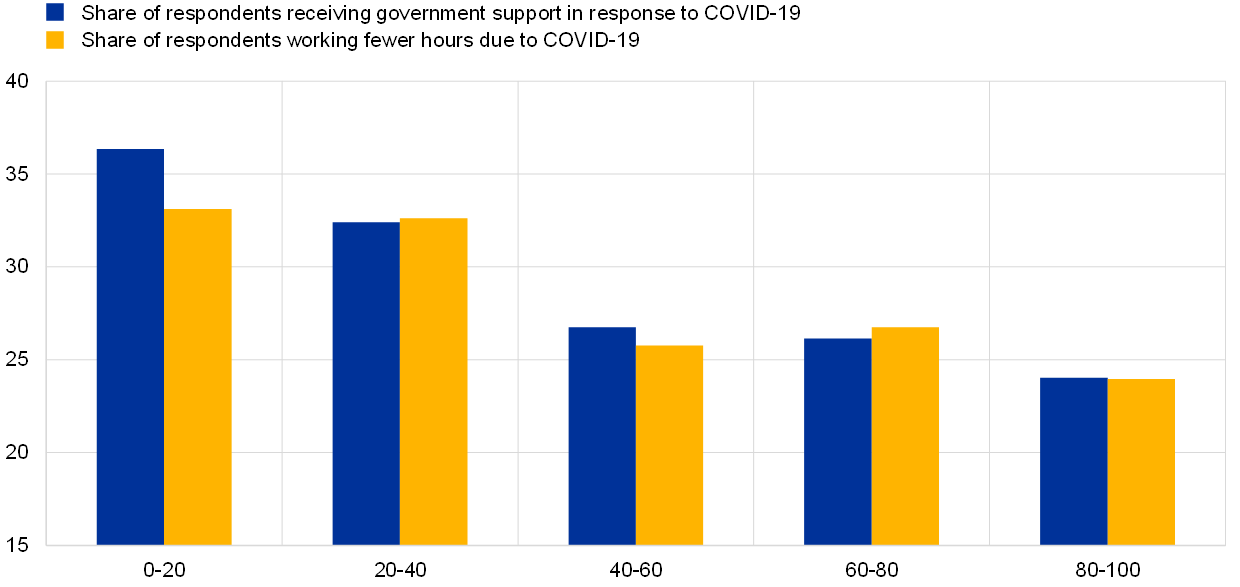
Source: ECB pilot Consumer Expectations Survey (CES) – June 2020 wave.
Note: All reported numbers are aggregated using individual household weights.
Chart 9
Liquidity constrained households by income percentiles
(x-axis: income percentiles, y-axis: percentage of respondents)
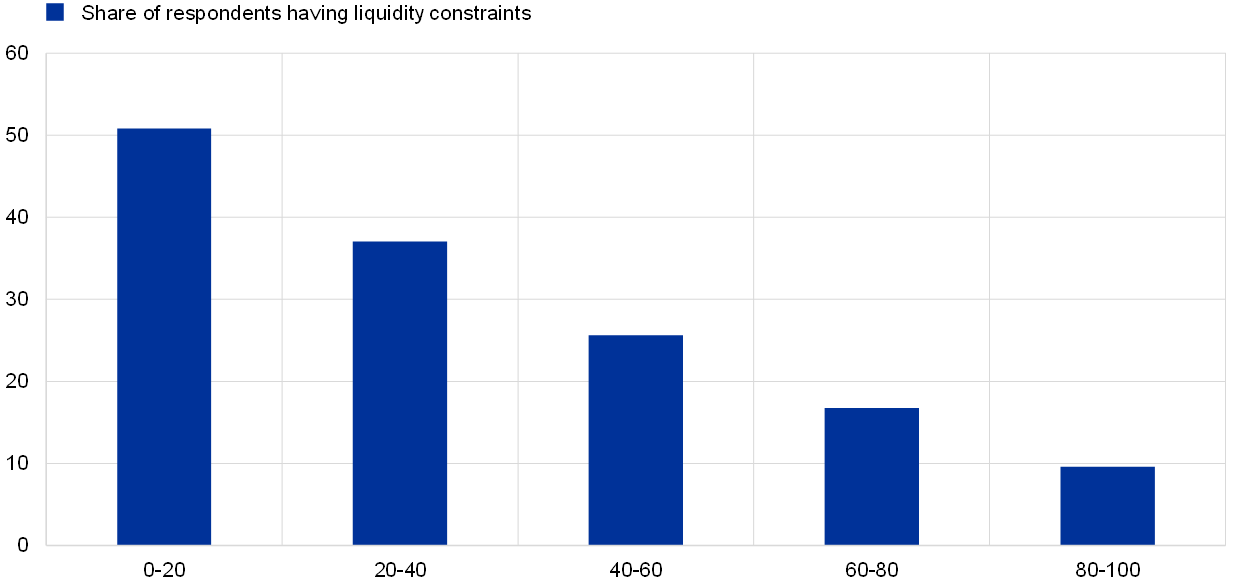
Source: ECB pilot Consumer Expectations Survey (CES) – June 2020 wave.
Note: All reported numbers are aggregated using individual household weights.
Chart 10
Private consumption and consumer confidence in the euro area
(year-on-year percentage change, percentage balance)
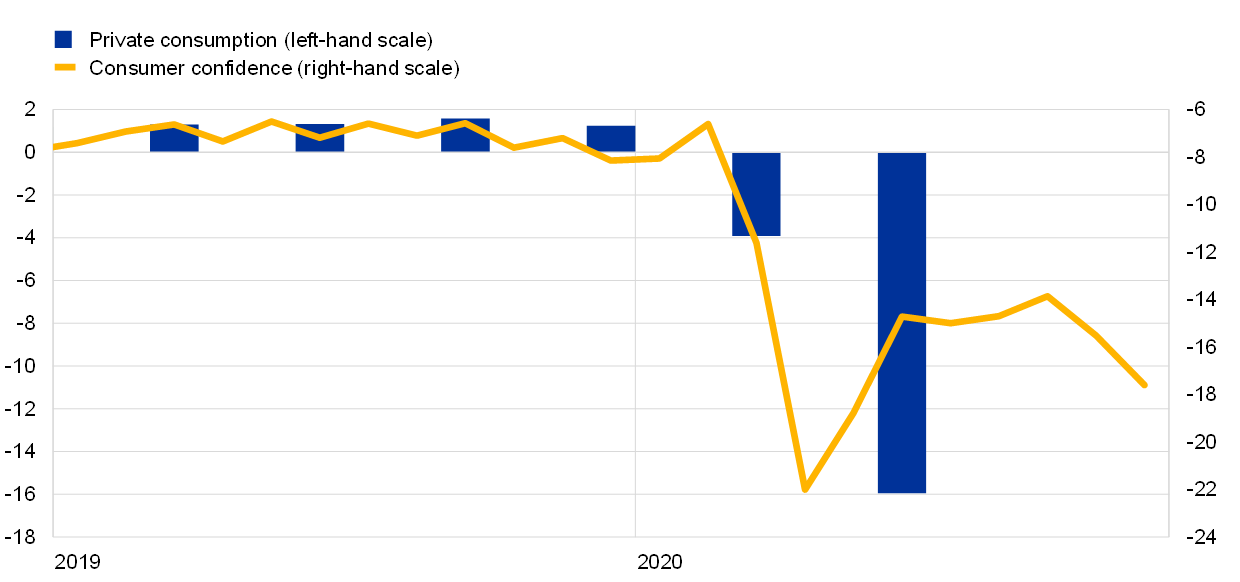
Sources: European Commission Directorate-General for Economic and Financial Affairs, Eurostat and ECB.
Note: The latest observation is for the second quarter of 2020 for consumption and November 2020 (flash estimate) for consumer confidence.
Chart 11
Household savings, deposits, loans and currency in circulation
(change since end-2019, percentage points of disposable income)

Sources: European Commission Directorate-General for Economic and Financial Affairs, Eurostat and ECB.
Notes: Change since December 2019 for deposits, loans, and currency in circulation and since the fourth quarter of 2019 for the savings rate. Loans to households are reported with an inverted sign. The contribution of currency flows should be considered an upper bound, as a breakdown by holding sector is not available. The latest observation is for October 2020 for deposits, loans and currency in circulation and the second quarter of 2020 for the saving rate.
In relation to business investment, firms are likely to postpone or cancel some of their capital expenditure plans against a background of heightened uncertainty about future demand for their products, spare capacity and weakened balance sheets (Chart 12). So far, supportive policies such as loan guarantees and moratoria, together with capital relief provided by supervisory authorities, have also been effective in averting a liquidity crisis, as indicated by the sharp improvement in the quick ratio – a measure of a firm’s ability to meet its short-term obligations with its most liquid assets (Chart 13). This has also allowed firms to finance working capital and compensate for diminished revenues, which has been fundamental for heading off a wave of insolvencies and permanent damage to productive capacity, as well as protecting jobs.[13] At the same time, firms have been taking on more debt, as reflected in leverage ratios (Chart 14). The evidence suggests that firms entering the last financial crisis with a higher leverage ratio experienced a sharper decline in investment.[14] This points to the risk that cumulated leverage might weigh on business investment during the post-pandemic recovery phase.
Chart 12
Industrial confidence and investment in machinery and equipment
(quarter-on-quarter percentage change; percentage balance)

Sources: European Commission Directorate-General for Economic and Financial Affairs and ECB.
Notes: Industrial confidence is de-meaned using the sample period 1999-2020. The latest observation is for the second quarter of 2020 for investment in machinery and equipment and the fourth quarter of 2020 for industrial confidence.
Chart 13
The quick ratio of firms
(median)
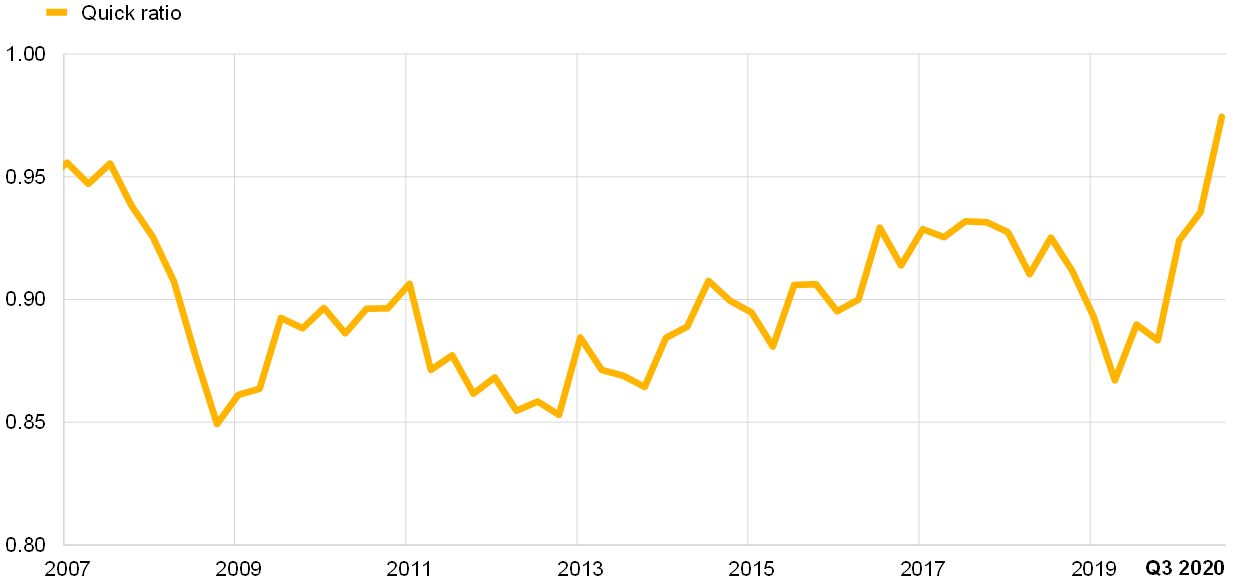
Sources: Standard & Poor’s and ECB staff calculations.
Notes: The latest observation is for the third quarter of 2020. The quick ratio is defined as total cash and short-term investments, plus accounts receivable, other receivables and finance division accounts receivable divided by total current liabilities.
Chart 14
Leverage ratio of firms
(percent, median)
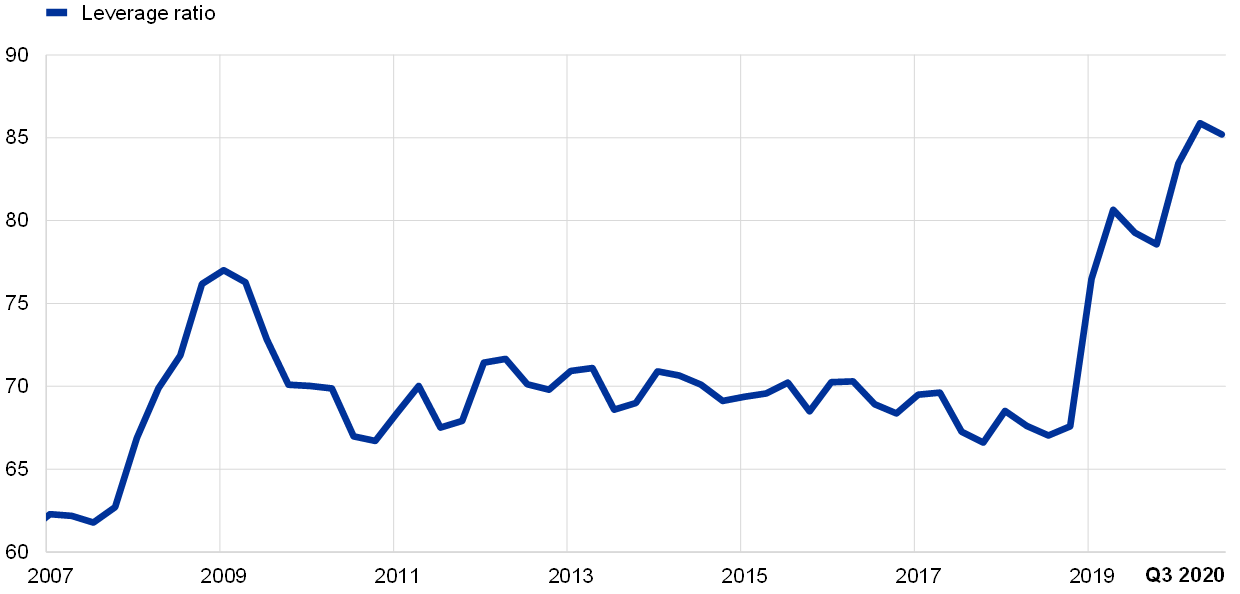
Sources: Standard & Poor’s and ECB staff calculations.
Note: The latest observation is for the third quarter of 2020
Fiscal policy is in the best position to differentiate and channel economic support to where it is needed most. Fiscal policy also has an important role to play as a driver of aggregate demand. It follows that there is a clear lead role for fiscal policy in driving overall demand and addressing sectoral asymmetries.[15] This is even more the case under current conditions, since the effects of decisive and well-targeted fiscal action will likely prove to be stronger than usual. In particular, fiscal transfers in normal times are associated with only-limited effects on output, but these constitute a powerful instrument when granted to liquidity-constrained households or struggling firms in the current environment.[16] Moreover, the pursuit of fiscal support for the economy and an accommodative fiscal policy are facilitated by the knowledge that there is light at the end of the tunnel.
The risk of an adverse real-financial feedback loop
The ruling out of adverse feedback loops between the real economy and financial markets is a central task for policy makers. A tightening in funding costs or worsening liquidity positions have so far been forestalled by the prompt policy reaction, and banks, in turn, have been able and willing to meet the strong demand for liquidity over the course of the pandemic.
However, there are some worrying signals in recent survey data. The October euro area bank lending survey (BLS) reports a broad-based tightening of credit standards that banks attribute primarily to the risks underlying the macroeconomic environment and a deterioration in borrower creditworthiness (Chart 15). The BLS also shows that the scaling back of investment plans has been an important source of the decline in credit demand in the last quarters (Chart 16). A similar message is also provided by the latest Survey on the Access to Finance of Enterprises in the euro area (SAFE): SMEs expect the availability of external and internal sources of finance to deteriorate (Chart 17).
Chart 15
Changes in credit standards applied to the approval of loans or credit lines to enterprises and contributing factors
(net percentages of banks reporting a tightening of credit standards and contributing factors)
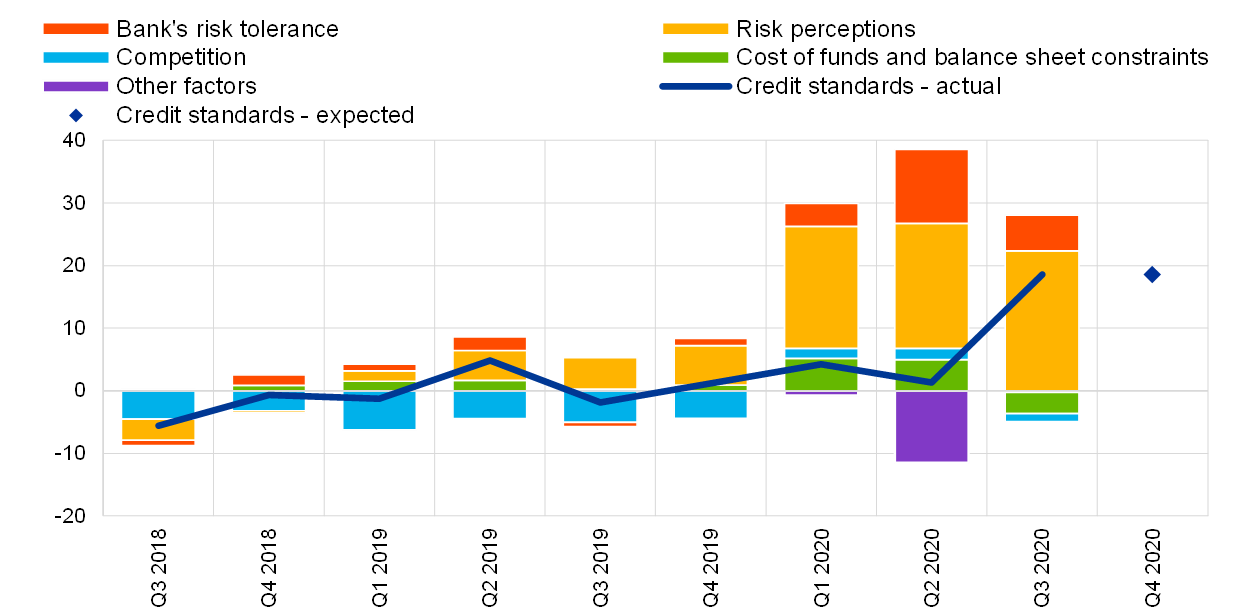
Source: ECB (October 2020 euro area bank lending survey).
Notes: “Actual” values are changes that have occurred, while “expected” values are changes anticipated by banks. Net percentages are defined as the difference between the sum of the percentages of banks responding “tightened considerably” and “tightened somewhat” and the sum of the percentages of banks responding “eased somewhat” and “eased considerably”. The net percentages for responses to questions related to contributing factors are defined as the difference between the percentage of banks reporting that the given factor contributed to a tightening and the percentage reporting that it contributed to an easing. “Cost of funds and balance sheet constraints” is the unweighted average of “costs related to capital position”, “access to market financing” and “liquidity position”; “risk perceptions” is the unweighted average of “general economic situation and outlook”, “industry or firm-specific situation and outlook/borrower’s creditworthiness” and “risk related to the collateral demanded”; “competition” is the unweighted average of “competition from other banks”, “competition from non-banks” and “competition from market financing”. The net percentages for the “other factors” refer to further factors which were mentioned by banks as having contributed to changes in credit standards, currently mainly related to the policy interventions in response to the COVID-19 pandemic. The latest observation is for the third quarter of 2020 for actual credit standards and the fourth quarter of 2020 for expected credit standards.
Chart 16
Changes in demand for loans or credit lines to enterprises and contributing factors
(net percentages of banks reporting an increase in demand and contributing factors)

Source: ECB (October 2020 euro area bank lending survey).
Notes: “Actual” values are changes that have occurred, while “expected” values are changes anticipated by banks. Net percentages for the questions on demand for loans are defined as the difference between the sum of the percentages of banks responding “increased considerably” and “increased somewhat” and the sum of the percentages of banks responding “decreased somewhat” and “decreased considerably”. The net percentages for responses to questions relating to contributing factors are defined as the difference between the percentage of banks reporting that the given factor contributed to increasing demand and the percentage reporting that it contributed to decreasing demand. “Other financing needs” is the unweighted average of “mergers/acquisitions and corporate restructuring” and “debt refinancing/restructuring and renegotiation”; “use of alternative finance” is the unweighted average of “internal financing”, “loans from other banks”, “loans from non-banks”, “issuance/redemption of debt securities” and “issuance/redemption of equity”. The latest observation is for the third quarter of 2020 for actual demand and the fourth quarter of 2020 for expected demand.
Chart 17
Change in the expectations of euro area enterprises regarding the availability of financing
(net percentage of respondents)

Source: ECB (Survey on the Access to Finance of Enterprises in the euro area).
Note: “Actual availability” refers to the period from April to September 2020 and “expectations” refers to the period from October 2020 to March 2021.
Taken together, the BLS and SAFE surveys signal some risk of a mutually-reinforcing adverse loop. In one direction, banks may view the dwindling loan demand as a negative signal about the state of the economy. In the other direction, firms may see their concerns about the future prospects for the macroeconomic situation confirmed by a tightening of borrowing conditions. Furthermore, this adverse interaction would be reinforced if household spending were to weaken and thereby were to further dampen firm prospects.
Another type of adverse real-financial feedback loop under pandemic conditions consists of the self-reinforcing nature of a sub-optimal fiscal-financial interaction process by which fiscal policy insufficiently responds to the pandemic shock in fear of triggering an unwarranted tightening of funding conditions. In a high-multiplier environment, this equilibrium could be self-reinforcing since the associated deterioration in the macro-financial environment could indeed validate an increase in sovereign risk premia. By contrast, the positive macro-financial impact of a vigorous fiscal response can reconcile the twin phenomena of an increase in fiscal deficits and a decline in sovereign yields.
It therefore remains vital for fiscal and monetary policymakers to guard against the risks of these financial amplification channels.
Ensuring favourable financing conditions
At our October monetary policy meeting, we announced that, on the basis of a thorough assessment of the economic outlook and the balance of risks surrounding it, we will recalibrate our instruments, as appropriate, to respond to the unfolding situation and to ensure that financing conditions remain favourable to support the economic recovery and counteract the negative impact of the pandemic on the projected inflation path.
Ensuring favourable financing conditions to support the economic recovery and counteract the negative impact of the pandemic on the projected inflation path is essential for several reasons.
First, the commitment by the central bank to ensure favourable financing conditions supports confidence levels among consumers, firms, financial intermediaries and governments.
Second, this commitment also reduces the likelihood of the materialisation of the adverse real-financial doom loops outlined above. In particular, the emergence of self-fulfilling trajectories by which borrowers and lenders pull back in fear of a tightening of financial conditions is less likely if it is commonly understood that market disruptions will trigger central bank intervention.
Third, since it is clear that considerable fiscal support (at both EU and national levels) remains necessary for as long as the pandemic limits the normal operation of the economy and in order to underpin the post-pandemic recovery phase, monetary policy must act both to facilitate the necessarily-expansive fiscal stance and to minimise the crowding-out of private sector activity that would occur if high levels of public borrowing were transmitted to an increase in sovereign yields.
Fourth, while the arrival in the coming weeks and months of further positive signals about progress in the rollout of vaccine treatments would certainly be highly welcome, these “news shocks” might be more quickly absorbed by financial markets than by households and firms. Accordingly, it is essential that the macroeconomic recovery is not derailed by a premature steepening of the yield curve.
Finally, ensuring favourable financial conditions is central to restoring inflation momentum and ensuring that inflation expectations are guided by the commitment of the central bank to counter the negative pandemic shock to the inflation process and secure convergence towards the inflation aim over the medium term. Chart 18 shows the challenge for inflation stabilisation in stylised form.[17] Before the onset of the pandemic (time t), inflation was expected to rise gradually towards the inflation aim (“π*”) following the “AD” path (the bold blue line). The pandemic has resulted in disinflationary pressures, with the downward impact of greater economic slack outweighing any inflationary pressures from supply constraints. In the chart, this negative shock to the inflation outlook is represented by the downward shift in the expected path of inflation from “A” to “B”.
Chart 18
The projected inflation path
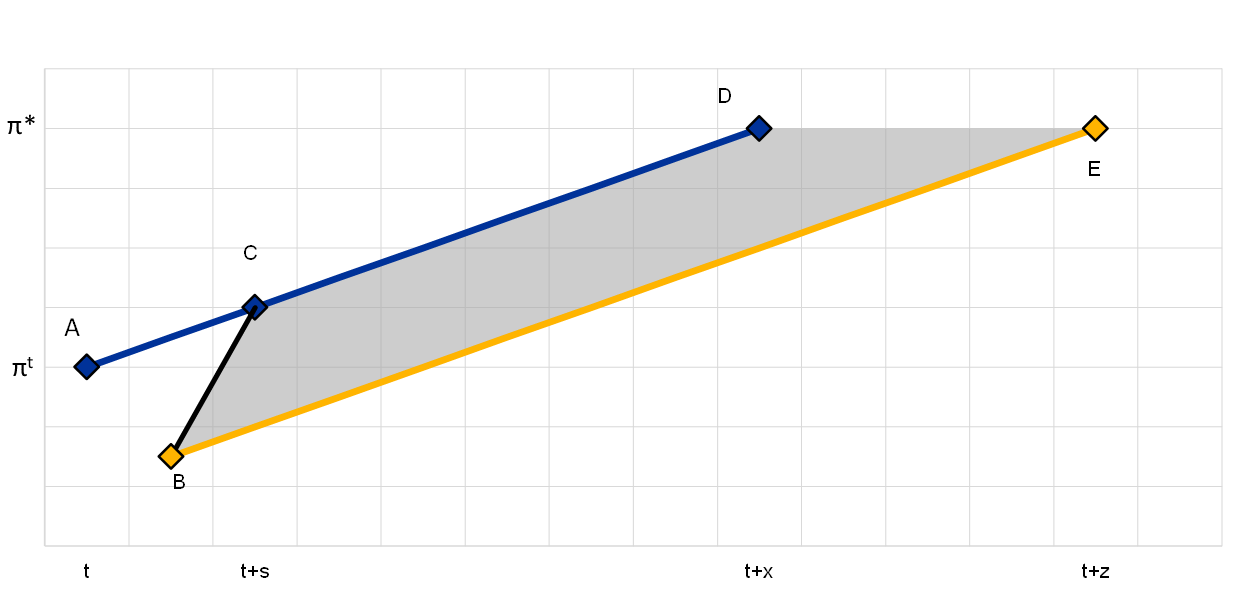
Source: ECB.
Notes: “AD” (the blue line) represents the expected inflation path before the pandemic shock. The initial negative impact of the pandemic shock – in the absence of additional monetary policy accommodation – is captured by the downward shift in the expected path from “A” to “B”. The “BE” path (the yellow line) illustrates a transition path of inflation that is even lower than originally envisaged. By providing additional monetary policy accommodation, the central bank can aim towards the upper region of the “BCDE” zone, so that the adjustment is closer to the “BCD” path.
Tolerating a longer phase of even lower inflation (illustrated by the yellow “BE” path in Chart 18) than originally envisaged would be costly and risky. First, it would imply a weaker recovery of consumption and investment, as a result of higher expected real interest rates. Second, it would contribute to a downward drift in inflation expectations that might become entrenched. The risk to inflation expectations is especially relevant in the context of the euro area, since inflation has already been below target for a prolonged period. In this context, it is essential that inflation expectations are anchored by the commitment of the central bank to offset the negative pandemic shock to the inflation path and ensure convergence to the inflation aim over the medium term.
Under these conditions, the first challenge in delivering the medium-term inflation aim is to reconnect inflation to its pre-pandemic projected path. This means boosting inflation momentum towards the upper part of the “BCDE” area (the grey shaded area), so that the adjustment approaches the “BCD” path. By setting the monetary stance at the appropriate level to deliver the financial conditions required to offset the pandemic shock to inflation, the underlying inflation trajectory will be restored. In turn, this also serves to underpin the formation of inflation expectations in a manner that is consistent with meeting the medium-term inflation aim.
Looking beyond the immediate task, even once the disinflationary pressures caused by the pandemic have been sufficiently offset, the second challenge will be to ensure that the post-pandemic monetary policy stance will deliver the timely and robust convergence of inflation to our medium-term aim. In this context, our in-progress strategy review will help to shape the future course of our monetary policy.
Conclusion
The pandemic constitutes a multi-phase challenge for monetary policy. In the initial weeks of the pandemic in spring 2020, the top priority was clearly to stabilise markets. With the ongoing interruptions to economic activity throughout 2020 and running into 2021, monetary policy continues to have a clear role to play in ensuring the preservation of favourable financial conditions. This will remain an essential priority even in the post-pandemic phase, given that the macroeconomic hit from the pandemic is likely to persist even after medical solutions have been rolled out. Only by ensuring appropriately-favourable financial conditions will the full economic recovery be assured and, by countering the negative impact of the pandemic on the projected inflation path, will robust convergence to our medium-term inflation aim be copperfastened.
- I am grateful to Krzysztof Bankowski, Giacomo Carboni, Maarten Dossche, Marien Ferdinandusse, Fédéric Holm-Hadulla, John Hutchinson, Danielle Kedan, Nick Ligthart, Arthur Saint-Guilhem and Roberto De Santis for their contributions to this speech.
- See also Lagarde, C. (2020), “Monetary policy in a pandemic emergency”, keynote speech at the ECB Forum on Central Banking, 11 November; Lane, P. R. (2020), “Understanding the pandemic emergency purchase programme”, speech at the Princeton BCF Covid-19 Webinar Series, 22 June; Lane, P.R. (2020), “The pandemic emergency: the three challenges for the ECB”, speech at the Jackson Hole Economic Policy Symposium, Federal Reserve Bank of Kansas City, 27 August; Lane, P. R. (2020), “The ECB’s monetary policy in the pandemic: meeting the challenge”, speech at the 62 NABE Annual Meeting, 6 October.
- For a full list of ECB measures in response to the pandemic, see Chart 4 in Lane, P. R. (2020), “The ECB’s monetary policy in the pandemic: meeting the challenge”, speech at the 62 NABE Annual Meeting, 6 October
- See also de Guindos, L. and Schnabel, I. (2020), “Improving funding conditions for the real economy during the COVID-19 crisis: the ECB’s collateral easing measures”, blog post, 22 April.
- See also Lane, P. R. (2020), “The market stabilisation role of the pandemic emergency purchase programme”, ECB blog post, 22 June.
- To arrive at these estimates, a suite of models is deployed. This approach reflects the uncertainty about the most appropriate model representation of the monetary transmission, which is particularly acute when the monetary impulse is imparted through unconventional tools such as asset purchase programmes. Adopting such a broad-based modelling approach increases the robustness of the estimates.
- See Lane, P.R. (2020), “The ECB’s monetary policy response to the pandemic: liquidity, stabilisation and supporting the recovery”, speech at the Financial Center Breakfast Webinar organised by Frankfurt Main Finance, 24 June.
- A recent Federal Reserve study makes further progress towards the construction of counterfactuals that are more realistic when the starting conditions are extremely fragile: see Kiley, M. T. (2020), “Pandemic Recession Dynamics: The Role of Monetary Policy in Shifting a U-Shaped Recession to a V-Shaped Rebound”, Finance and Economics Discussion Series 2020-083, Board of Governors of the Federal Reserve System. Kiley illustrates how effective US monetary policy has been in responding to the pandemic and, in doing so, preventing a V-shaped rebound from morphing into a deep U-shaped recession. The paper shows how the sharp increase in financing conditions at the outset of the pandemic were assuaged by a QE programme that eased balance sheet constraints on financial intermediaries, which in turn improved overall financial conditions. The study also shows that these crisis policy interventions may have longer lasting effects on the economy. In the model set-up, these are shown to prevent a fall in the stock of productive capital.
- This approach follows Adrian, T., Boyarchenko, N., and Giannone, D. (2019), “Vulnerable growth”, American Economic Review, Vol 109 (4), pp. 1263-89.
- See also Lane, P.R. (2020), “The ECB’s monetary policy response to the pandemic: liquidity, stabilisation and supporting the recovery”, speech at the Financial Center Breakfast Webinar organised by Frankfurt Main Finance, 24 June, which outlines that while it is analytically challenging to provide an exact quantification of this dimension in terms of the macroeconomic support of our policy measures, an insightful example can be shown by way of the TLTROs. While the amplification effects of the COVID-19 crisis via banks have so far been contained, the severity of the shock had the potential to lead to a liquidity crunch that would morph into a fully-fledged credit crunch. An illustrative counterfactual exercise by ECB staff suggests that the TLTRO support in removing tail risk would be in the order of three percentage points of euro area real GDP growth in cumulative terms over 2020-22. To come to this result, a model-based counterfactual exercise was undertaken in which it is assumed that non-linear real-financial feedback loops materialise in a more adverse manner than was actually the case since the start of the crisis. Simulations are based on a set of models, including the New Multi-Country Model (Dieppe, González Pandiella, Hall and Willman (2013)), the New Area Wide Model II (Coenen, Karadi, Schmidt and Warne (2018)), Darracq Pariès and Kühl (2016), and Darracq Pariès, Kok and Rodriguez Palenzuela (2011). The simulations consider an extreme amplification scenario in which the balance sheets of firms and households deteriorate over the projection horizon, causing banks to incur credit losses and a depletion of capital. In this quantitative analysis, the TLTROs are found to significantly mitigate the macroeconomic impact of adverse amplification mechanisms. For more on the models, see Dieppe, A., Gonzalez Pandiella, A., Hall, S. and Willman, A. (2013), “Limited information minimal state variable learning in a medium-scale multi-country model”, Economic Modelling, Vol 33, pp. 808-825; Coenen, G., Karadi, P., Schmidt, S. and Warne, A. (2018), “The New Area-Wide Model II: an extended version of the ECB’s micro-founded model for forecasting and policy analysis with a financial sector”, Working Paper Series, No 2200, European Central Bank; Darracq Pariès, M. and Kühl, M. (2016), “The optimal conduct of central bank asset purchases”, Working Paper Series, No 1973, European Central Bank; and Darracq Pariès, M., Kok, C. and Rodriguez Palenzuela, D. (2011), “Macroeconomic Propagation under Different Regulatory Regimes: Evidence from an Estimated DSGE Model for the Euro Area”, International Journal of Central Banking, Vol 7 (4), pp. 49-113. See also Lagarde, C. (2020), “Monetary policy in a pandemic emergency”, speech at the ECB Forum on central banking, 11 November.
- See also Lane, P. R. (2020), “The ECB’s monetary policy in the pandemic: meeting the challenge”, speech at the 62 NABE Annual Meeting, 6 October and Lagarde, C. (2020), “Monetary policy in a pandemic emergency”, keynote speech at the ECB Forum on Central Banking, 11 November.
- See for example Bounie, D., Camara, Y., Fize, É., Galbraith, J., Landais, C., Lavest, C., Pazem, T. and Savatier, B. (2020), “Consumption Dynamics in the COVID Crisis: Real Time Insights from French Transaction & Bank Data”, Focus, No 049-2020, Conseil d’analyse économique, p. 9 ff.
- Similar conclusions emerge when considering the current ratio – which is the ratio between a firm’s current assets and liabilities: the ratio for the median firm is well above one and has increased from 1.3 in the fourth quarter of 2019 to an estimated 1.4 in the third quarter of 2020.
- See Kalemli-Özcan, S. Laeven, L. and Moreno, D. (2019), “Debt overhang, rollover risk, and corporate investment: evidence from the European crisis”, Working Paper Series, No 2241, European Central Bank. See also Duval, R., Hong, G. H., and Timmer, Y. (2020), “Financial frictions and the great productivity slowdown”, The Review of Financial Studies, Vol, 33(2), pp. 475-503.
- Various studies provide theoretical frameworks to assess policy proposals aimed at addressing the large differences in the impact of the COVID-19 crisis across sectors. See, for example, Woodford, M. (2020), “Effective demand failures and the limits of monetary stabilisation policy”, NBER Working Paper Series, No 27768; and Guerrieri, V., Lorenzoni, G., Straub, L. and Werning, I. (2020), “Macroeconomic implications of COVID-19: Can negative supply shocks cause demand shortages?”, NBER Working Paper Series, No 26918.
- See, for example, the strand of literature attempting to evaluate the effects of fiscal stimuli during the COVID-19 crisis: Bayer, C., Born, B., Luetticke, R. and Müller, G. (2020), “The Coronavirus Stimulus Package: How large is the transfer multiplier?”, CEPR Discussion Papers, No 14600, Centre for Economic Policy Research; Hinterland, N., Moyen, S., Roehe, O. and Staehler, N. (2020), “Gauging the Effects of the German COVID-19 Fiscal Stimulus Package”, mimeo; and Pfeiffer, P., Werner, R. and in’t Veld, J. (2020), “The COVID19-Pandemic in the EU: Macroeconomic Transmission & Economic Policy Response”, Discussion Paper 127, European Commission.
- See also Lane, P.R. (2020), “The pandemic emergency: the three challenges for the ECB”, speech at the Jackson Hole Economic Policy Symposium, Federal Reserve Bank of Kansas City, 27 August; and Lane, P.R. (2020), “The ECB’s monetary policy in the pandemic: meeting the challenge”, speech at the 62 NABE Annual Meeting, 6 October.
Banc Ceannais Eorpach
Stiúrthóireacht Cumarsáide
- Sonnemannstrasse 20
- 60314 Frankfurt am Main, an Ghearmáin
- +49 69 1344 7455
- media@ecb.europa.eu
Ceadaítear atáirgeadh ar choinníoll go n-admhaítear an fhoinse.
An Oifig Preasa