
Survey on the Access to Finance of Enterprises in the euro area − April to September 2018
Introduction
This report presents the main results of the 19th round of the Survey on the Access to Finance of Enterprises (SAFE), which was conducted between 17 September and 26 October 2018. The survey covers the period from April 2018 to September 2018. The total euro area sample size was 11,020 enterprises, of which 10,033 (91%) had fewer than 250 employees.[1]
The report provides evidence on changes in the financial situation of enterprises and documents trends in the need for and availability of external financing. It includes results on small and medium-sized enterprises (SMEs) as well as large firms, and examines developments both at the euro area level and in individual countries.
1 Overview of the results
Availability of skilled labour remained the dominant concern for euro area SMEs, together with the difficulty of finding customers, while access to finance was considered the least important obstacle. As in previous editions, the 19th round of the Survey on the Access to Finance of Enterprises (SAFE) also asked entrepreneurs to indicate the most pressing problem facing their company. Availability of skilled labour was considered the main problem for euro area SMEs (26%, from 24% in the previous survey), together with the difficulty of finding customers (22%, from 23%). Access to finance, on the other hand, remained the least important obstacle (7%, from 8%), after cost of production and competition (both unchanged at 12%) and regulation (13%, unchanged). SMEs in Greece continued to be strongly affected by the lack of access to finance, with 17% mentioning it as their most important problem. At 9%, Italy had the second largest share of SMEs reporting access to finance as their dominant concern.
Euro area SMEs continued to indicate improvements in their overall financial situation during the reference period, although at a slower pace. In particular, a net[2] 25% of euro area SMEs reported higher turnover (from 24%). At the same time, however, only few euro area SMEs reported increases in profits (3%, from 4%). Cross-country differences in profits were strongly correlated with turnover trends.
Euro area enterprises continued to report, on balance, rising costs amid improvements in their debt situation and higher investment. The net percentage of SMEs indicating an increase in labour costs reached 51% (up from 50%), while the net percentage of firms reporting an increase in other costs jumped to 57% (from 54%). In this round, a small net percentage of SMEs reported an increase in interest expenses (4%, from 2%), while declining leverage was reported by slightly more SMEs (-8%, from -7%).
The economic expansion was reflected in investment and hiring decisions. In net terms, 18% of SMEs reported increases in fixed investments (from 19%), 9% in inventories and working capital (from 7%) and 14% in the number of employees (from 12%).
The external financing gap of SMEs – the difference between the change in demand for and the change in the availability of external financing – remained negative[3] at the euro area level (-5%, from -4%) and in most euro area countries (see Table A, column 10).
Demand for bank loans has not changed over the period under review. In net terms, euro area SMEs reported an unchanged need for bank loans (0%, from 3%), but a still increasing need for credit lines (5%, from 7%) (see Table A, column four). About 9% of SMEs, on balance, reported an increased need for trade credit (from 11%), and 13% indicated a higher demand for leasing or hire-purchase (from 12%). Financing from external and internal sources was mainly used for fixed investment and for inventories and working capital. Moreover, SMEs used finance to hiring and training new employees and developing and launching new products.
SMEs continued to indicate improvements in the availability of external sources of finance, but weaker than in the previous survey. The net percentage of SMEs reporting an improvement in the availability of bank loans declined to 11% (from 14%) (see Table A, column six). The countries in which SMEs reported the most improvements in the availability of bank loans were Spain, Ireland and Slovakia. In Greece, a small net percentage of SMEs reported improvements for the first time since 2009.
Latest developments in SAFE country results for SMEs
(over the preceding six months; net percentages of respondents)
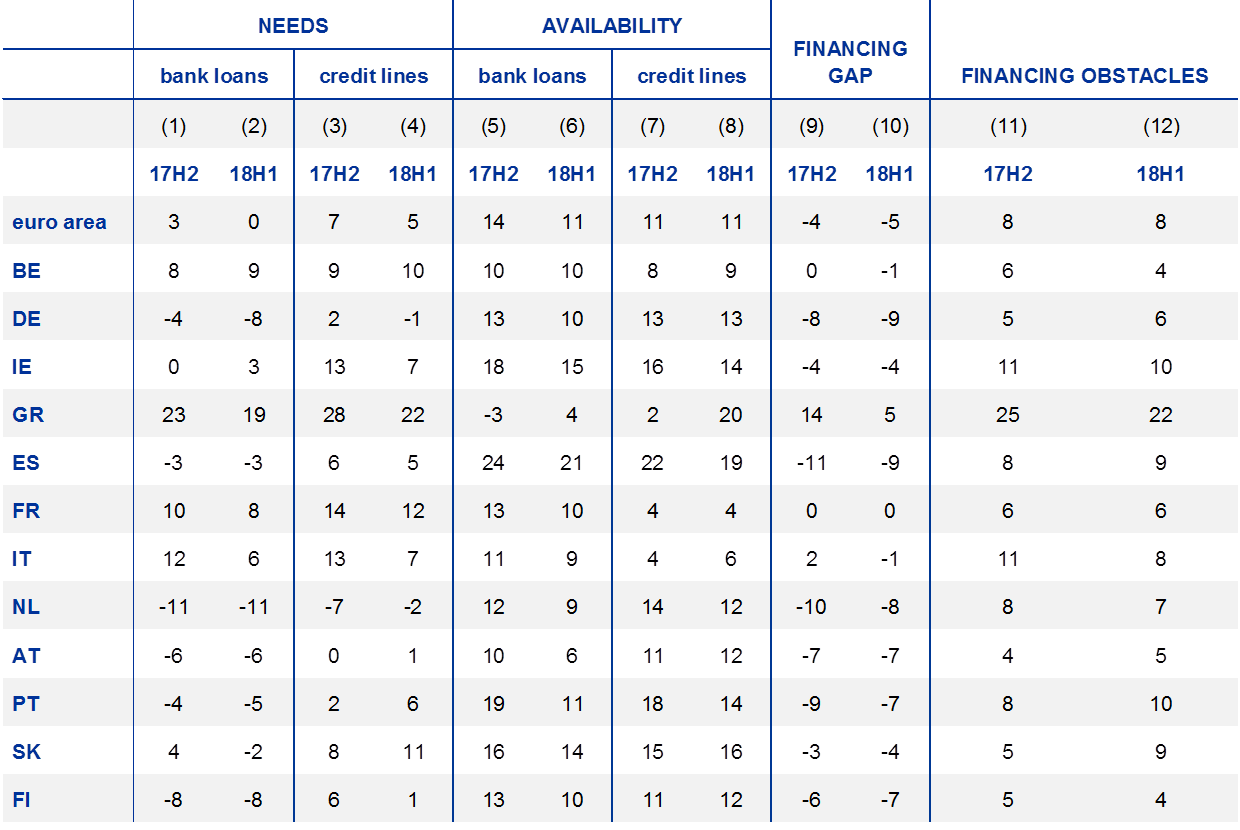
Notes: For “needs”, see Chart 11, for “availability”, see Chart 15, and for the “financing gap”, see the notes to Chart 17. For “financing obstacles” see the notes to Chart 20. “17H2” refers to round eighteen (October 2017 to March 2018) and “18H1” refers to round nineteen (April to September 2018).
With the exception of access to public support, SMEs perceived all factors examined in the survey to positively affect the availability of external finance, though with lower net percentages than in the previous round. A net 17% of SMEs reported an improvement in the willingness of banks to provide credit (from 19%) with some variation across countries. A significantly smaller share of SMEs (2%, from 13%) perceived the macroeconomic outlook as a factor conducive to higher availability of external finance. In fact, in some large euro area countries, the general economic outlook has started to be considered as an impediment by some respondents. At the same time, euro area SMEs continued to report improvements in their firm-specific outlook (16%), capital position (20%), and credit history (20%).
The overall indicator of financing obstacles[4] for bank loans for SMEs remained unchanged at 8% (see Table A, last column). While the percentages of SMEs reporting difficulty in accessing bank loans have diminished in most countries, financing obstacles remained relatively large in Ireland and Portugal (both 10%) and Greece (22%). In this survey round, 27% of SMEs had applied for a loan. The rate for fully successful loan applications was 74% (down from 76%), while the rejection rate rose slightly (to 5% from 4%).
Concerning price terms and conditions of bank financing, SMEs reported, on balance, rises in bank interest rates (3%, up from -1%) for the first time since 2014. At the same time, 31% of SMEs (from 26%) continued to report higher levels of other costs of financing, such as charges, fees and commissions. As for non-price terms and conditions, SMEs reported, on balance, increases in the available size (13%) and maturity (3%), but also increases in collateral requirements (12%), all of which were broadly unchanged from the previous survey round.
The financial situation of large enterprises remained better than that of SMEs, as they continued to report marked increases in both turnover and profits, although with some moderation relative to the previous survey rounds. Around 45% of large firms applied for a bank loan, with a success rate that was much higher (84%) and a rejection rate that was much lower (1%) than those of SMEs. According to the survey results, the average interest rate charged to large enterprises on credit lines was about 170 basis points lower than that paid by SMEs. Large firms therefore continued to benefit from better access to finance than SMEs.
In sum, the survey results are consistent with a broad-based economic expansion favourable to investment and employment which continues to be supported by accommodative financing conditions. Nevertheless, in this survey round SMEs reported some growing concerns about developments in their business environment, with incipient signs of increases in funding costs.
2 The financial situation of SMEs in the euro area
2.1 Smaller improvements in the financial situation of euro area SMEs
In the period between April 2018 and September 2018, the financial situation of euro area SMEs was consistent with a broad-based economic expansion which continued to be supported by accommodative financing conditions (see Chart 1).
Change in the income and debt situation of euro area enterprises
(over the preceding six months; net percentages of respondents)

Base: All enterprises. Figures refer to rounds three (March-September 2010) to nineteen (April-September 2018) of the survey.Notes: The net percentage is the difference between the percentage of enterprises reporting an increase for a given factor and the percentage reporting a decrease. From round eleven onwards (April-September 2014), the concept of “Net interest expenses (what you pay in interest for your debt minus what you receive in interest for your assets)” was replaced with “Interest expenses (what your company pays in interest for its debt)”.
Q2. Have the following company indicators decreased, remained unchanged or increased over the past six months?
The net percentage[5] of euro area SMEs[6] reporting higher turnover rose to 25% (from 24% during the previous survey period[7]), suggesting an ongoing economic expansion. Nevertheless, SMEs reported some rising concerns about developments in their business environment. As in previous survey rounds, the net percentage of firms reporting higher turnover increased with size. While, on balance, only 15% (up from 12%) of micro firms reported higher turnover, the corresponding share of large firms was 42% (down from 50%), with small firms (40%, down from 41%) and medium-sized firms (29%, unchanged) in between.
Euro area enterprises continued to report, on balance, rising costs amid improvements in their debt situation and higher investment. A high net proportion of euro area SMEs across all size categories continued to report rising labour costs (51% overall, up from 50%) with responses that were broadly unchanged relative to the previous survey round: 45% (from 44%) for micro, 55% (unchanged) for small, 58% (from 57%) for medium and 59% (unchanged) for large firms. As regards net increases in other costs, the reported rise was broad-based across all firm sizes: large firms (60%, from 52%) and SMEs (57% overall, up from 54%).
The rise in costs was also reflected in profits, as a net 3% of euro area SMEs reported increases in profits (down from 4% in the previous round). While micro firms continued to report declining profits (-3%, from -4%), lower net percentages of larger firms reported profit rises, at 10% (down from 21%) for large and 10% (down from 14%) for medium-sized firms, while for small firms the net percentage reporting higher profits remained unchanged at 8%.
Deleveraging among euro area enterprises seems to have slowed since the previous survey round. In net terms, the net percentage of SMEs indicating a decline in their debt-to-asset ratio rose (-8%, from -7%), with higher a percentage among micro firms (-8%, from -5%), while the net percentages of larger firms reporting decreases in debt-to-asset ratios in this survey round were lower, at -1% (up from -11%) for large firms and -6% (up from -10%) for medium-sized firms.
In this survey round the net percentage of SMEs reporting an increase in interest expenses rose again (4%, from 2%). However, the average masks some heterogeneity with regard to firm size. While the net balance of reporting higher interest costs rose to 8% for micro enterprises and 2% for small (from 7% and 0% respectively), larger enterprises continued to indicate lower reductions in interest expenses (to -3% from -11% for large and to -3% from -7% for medium-sized firms).
The broad-based economic expansion was also reflected in investment and hiring decisions. On balance, euro area SMEs continued to report rising fixed investments at a moderately lower pace (18%, from 19%), increasing inventories and working capital (9%, from 7%) and a growing number of employees (14%, from 12%). These positive developments applied to firms in all size categories, while the net percentages for large firms were significantly higher than those for SMEs in these three areas.
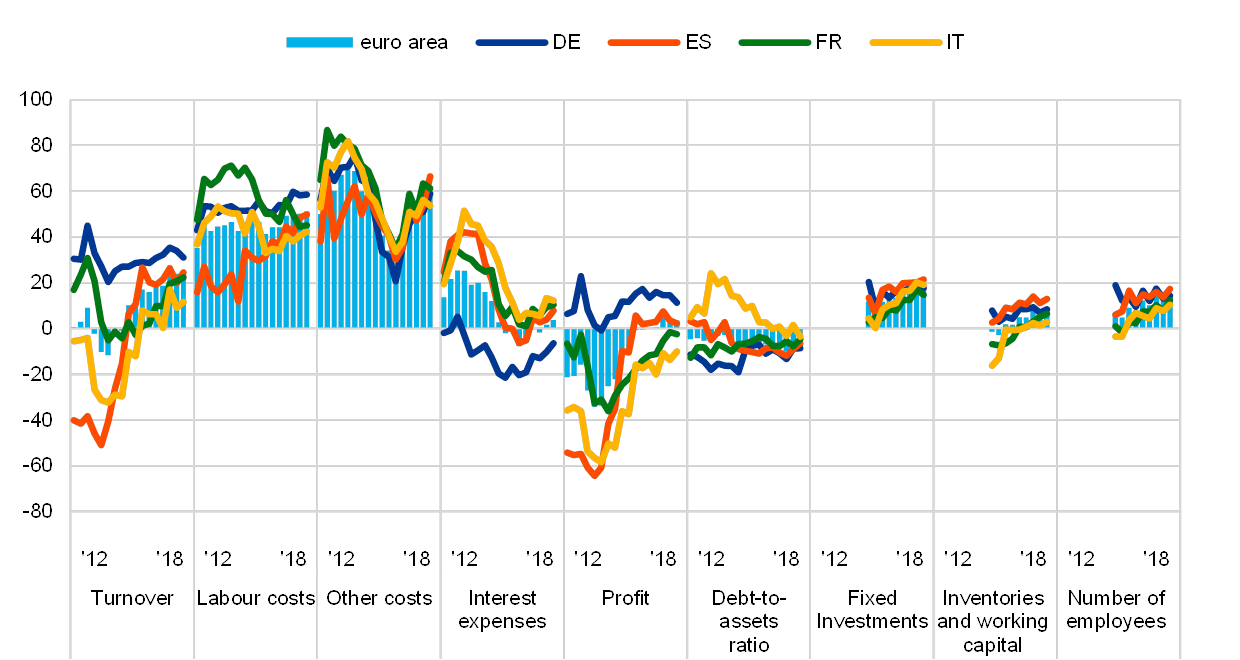
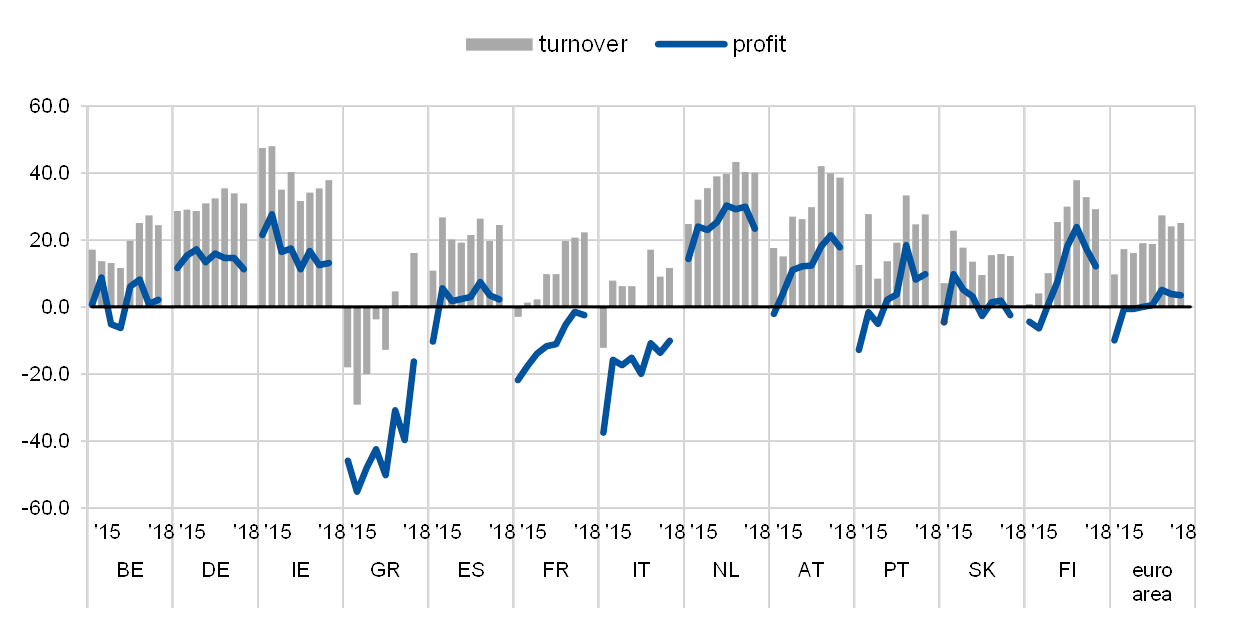
The improvements in turnover were widespread across countries. Among the large euro area countries, the net percentage of SMEs indicating higher turnover was largest in Germany (31%, from 34%), followed by Spain (24%, from 20%), France (22%, from 21%), and Italy (12%, from 9%) (see Chart 2). SMEs also reported higher turnover in the other euro area countries, particularly in the Netherlands, Ireland and Austria, but also in Greece, where the net percentage of SMEs reporting increased turnover reached double digits (16%, up from 0%) for the first time since the beginning of the crisis (see Chart 1a in Annex 1).
As in previous rounds of the survey, profit dynamics varied greatly from country to country. Among the large euro area countries, a net percentage of SMEs in Germany (11%, from 15%) and Spain (2%, from 4%) reported increasing profits, while French (-2%, from -1%) and Italian SMEs (-10%, from -14%) continued to report declines. In all other euro area countries, with the exception of Slovakia and Greece, the net percentages of SMEs reporting increased profits fell (see Chart 1a in Annex 1). In Greece a large, but declining, net percentage of SMEs reported decreasing profits (-16%, up from -40%).
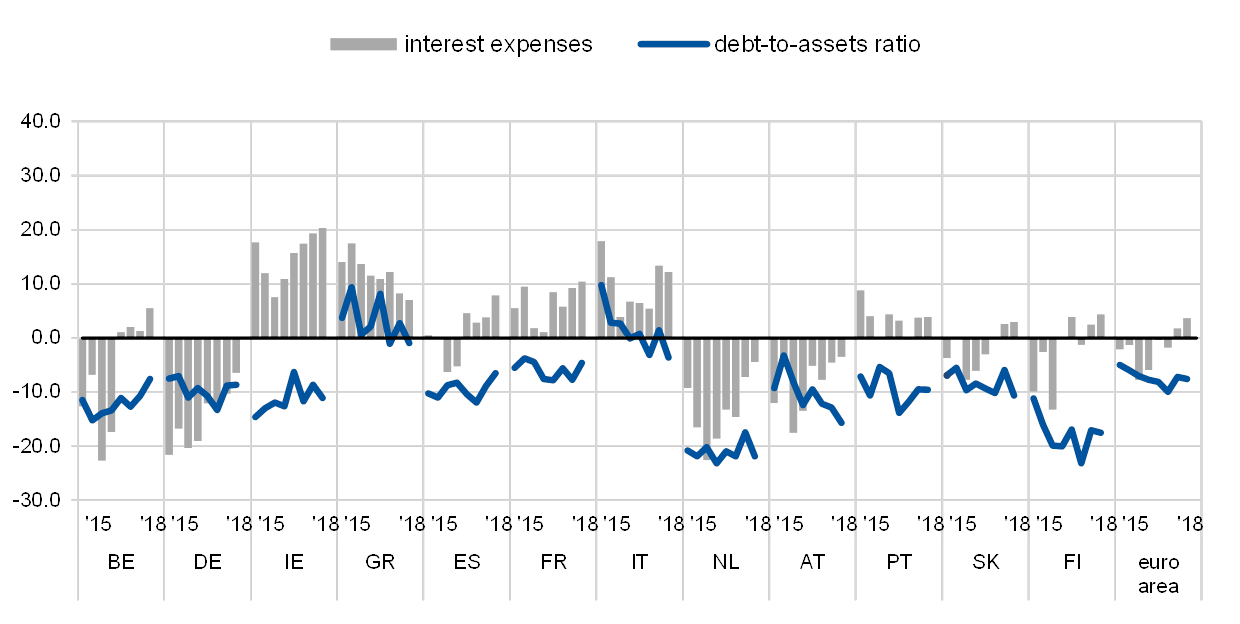
Across countries, euro area enterprises continued to deleverage, but less so than in the previous survey round. Among the large countries, on balance, SMEs in Germany (-9%, unchanged), Spain (-7%, up from -9%), France (-5%, up from -8%) and Italy (-4%, down from 1%) reported a reduction in the debt-to-asset ratio. SMEs in all other euro area economies also reported, on balance, lower debt-to-asset ratios (see Chart 2a in Annex 1).
In line with the moderation in the deleveraging process, most euro area SMEs indicated an increase in interest expenses, although country-specific developments differed. Among the large economies, the highest net percentages were recorded by Italian (12%, from 13%) and French SMEs (10%, from 9%), while German SMEs continued to report lower net interest expenditures (-6%, from -10%). Among the other countries, only SMEs in the Netherlands (-4%, from -7%) and Austria (-3%, from -5%) reported, on balance, lower net interest expenditures, while Ireland had the highest net percentage of SMEs reporting an increase in interest expenses (20%, up from 19%).
Change in the income and debt situation of euro area SMEs
(over the preceding six months; net percentages of respondents)
Base: All SMEs. Figures refer to rounds three (March-September 2010) to nineteen (April-September 2018) of the survey.Note: See the notes to Chart 1.
Q2. Have the following company indicators decreased, remained unchanged or increased over the past six months?
An increase in labour and other costs (for material, energy and interest expenses) was visible across all countries. The net percentage of SMEs reporting an increase in labour costs was highest in Ireland (64%, from 68%) and lowest in Italy (42%, from 41%) and Greece (39%, from 40%). For other costs, the corresponding net percentage was also highest in Ireland (69%, from 65%) and Spain (66%, from 54%) and lowest in the Netherlands (45%, from 40%) and Greece (40%, from 42%).
On balance, SMEs in all countries reported increasing fixed investment, while the increases were more moderate for inventories and working capital and for employment. Among the large euro area countries, in Germany, Spain and Italy around one fifth of SMEs, on balance, reported an increase in fixed investment (18%, 21% and 19%, respectively, compared with 20% in all of them previously), and a slightly lower proportion in France (15%, down from 17%). Among the other euro area countries, the net percentage of SMEs indicating rising fixed investment was highest in Ireland (29%). In net terms, inventories and working capital increased at a somewhat higher pace in most countries. SMEs in all of the four largest euro area countries reported an increase relative to the previous survey round. In the other countries, only Greek SMEs continued to report declining inventories and working capital (-5%, up from -12%).
Regarding employment in the large euro area countries, the net percentage of SMEs reporting an increase in the number of employees was highest in Spain (17%, from 14%) and lowest in Italy (10%, from 8%). Among the other euro area countries, the net percentage of SMEs reporting increasing employment was highest in the Netherlands (24%) and Portugal (20%)
Looking at size differences, smaller firms remain more vulnerable than large companies but the gap has declined over time. According to the two indicators of vulnerable and profitable firms[8] – which summarise the overall financial conditions of the most and least vulnerable euro area firms across firm sizes and countries – only 2.9% of euro area SMEs encountered major difficulties in running their business and servicing their debt and, as a result, might face more difficulties in accessing finance (see Chart 3). In the previous survey round the percentage was slightly higher at 3.3%. At the other end of the spectrum, the percentage of firms that are more likely to be resilient to financial shocks and tend to invest and hire more often than other firms has reached 5.7%, down from 6.0% in the previous survey round.
In this survey round the percentage of vulnerable firms among large firms increased to 1.6% from 0.6%. Although the financial situation of large enterprises remained better than that of SMEs, the moderation that was reported in the period from April to September 2018 is reflected in the decline of the net percentage of profitable large firms, which dropped to 5.9% from 9%, the lowest recorded since 2012.
Vulnerable and profitable enterprises of euro area
(percentages of respondents)
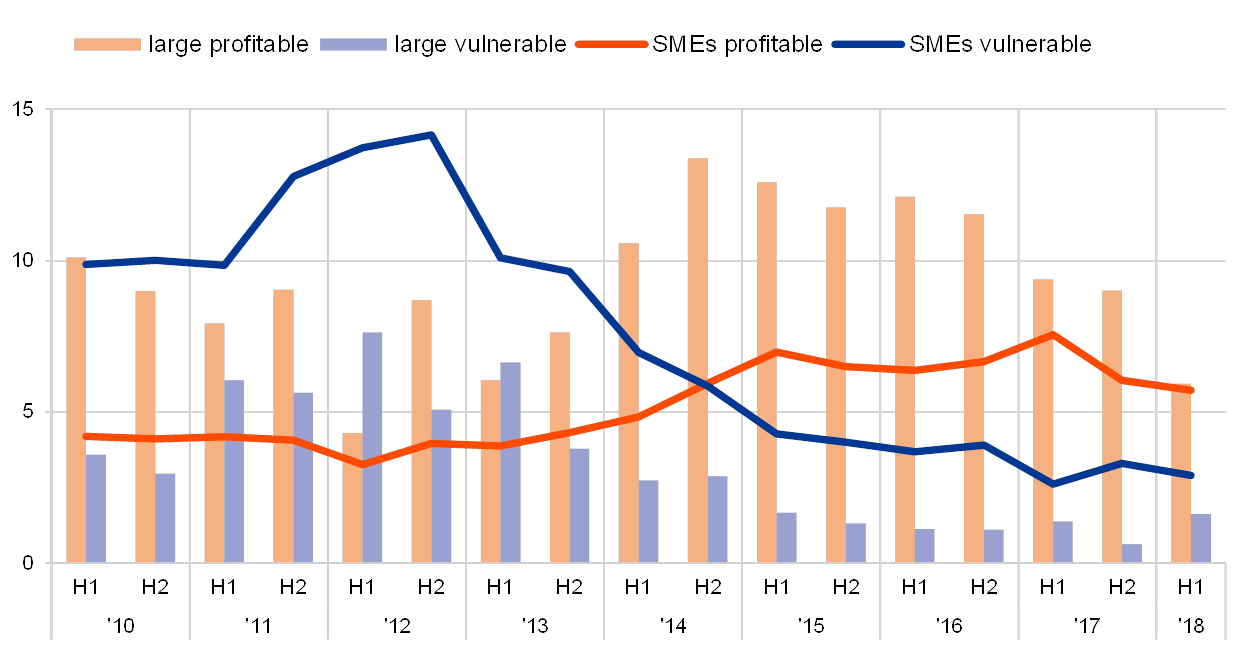
Base: All enterprises. Figures refer to rounds three (March-September 2010) to nineteen (April-September 2018) of the survey.Note: For definitions, see footnote 8 of the report.
Q2. Have the following company indicators decreased, remained unchanged or increased over the past six months?
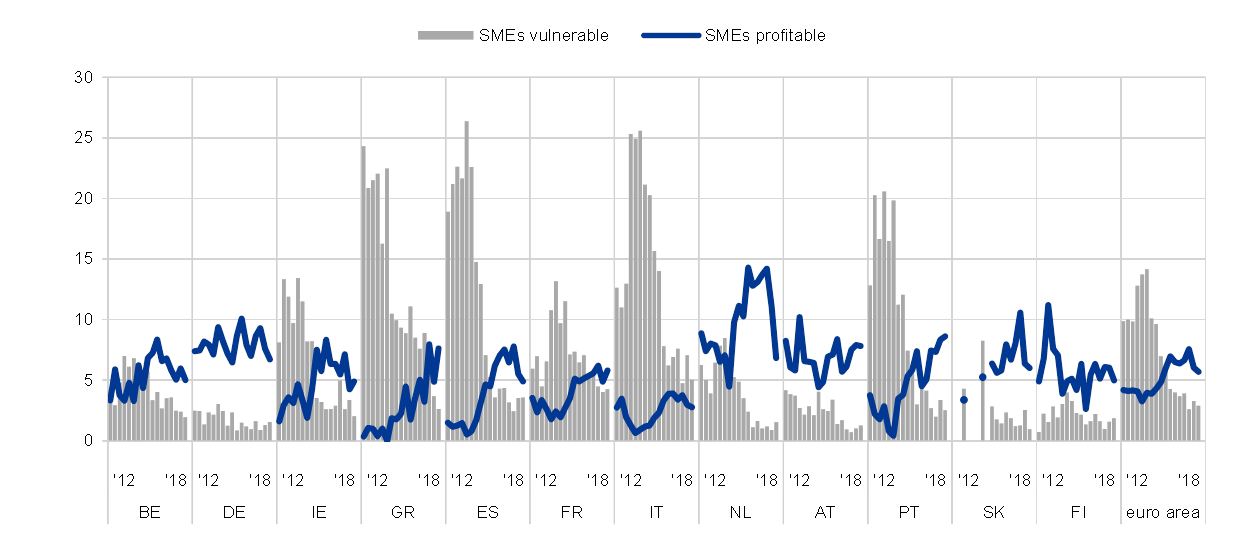
Focusing on SMEs, the profitable-vulnerable indicators reveal some differences across countries. Chart 4 shows profitable and vulnerable SMEs in the four large euro area countries. The percentage of distressed companies remained high in Spain (3.6%, up from 3.5%) and Italy (5.0%, down from 7%), though much lower than the peak reached during the sovereign debt crisis. At the same time, the percentage of vulnerable firms also increased slightly in Germany (1.6%, up from 1.3%). In France a reduction in the share of vulnerable firms (to 2.9% from 4%) was accompanied by an increase in that of profitable firms (to 5.8% from 4.9%), while in the other large euro area countries the percentage of profitable firms declined. For the trend in other euro area countries, see Chart 3a in Annex 1.
Vulnerable and profitable SMEs
(percentages of respondents)
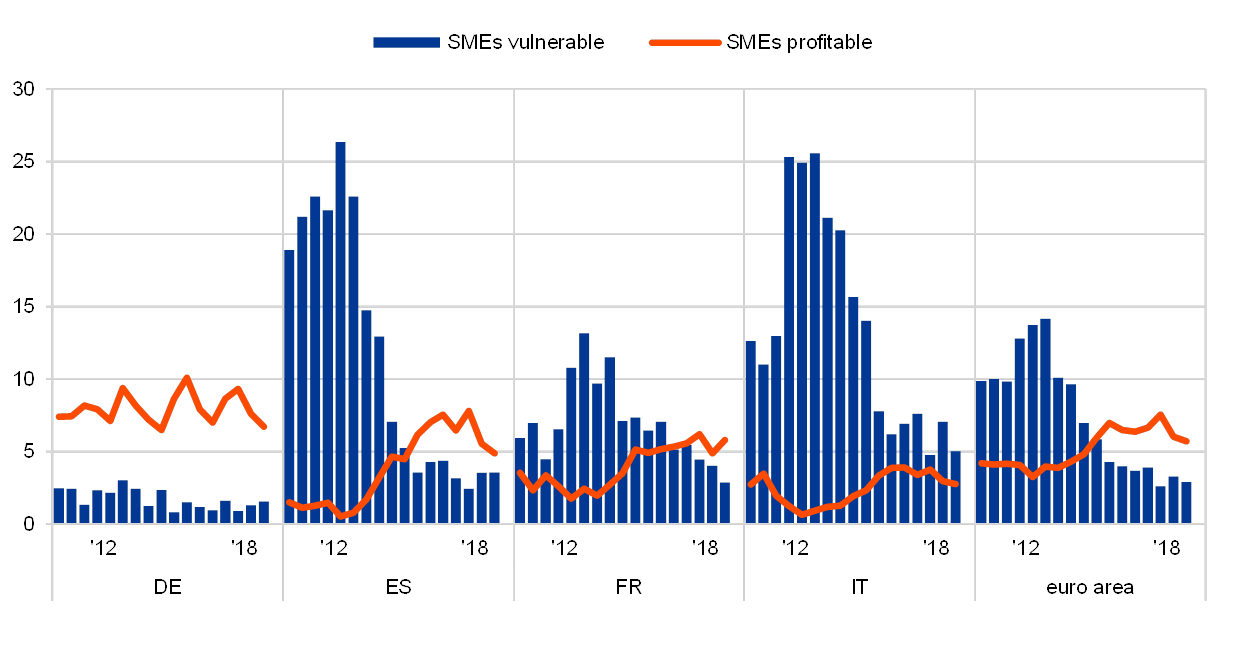
Base: All SMEs. Figures refer to rounds three (March-September 2010) to nineteen (April-September 2018) of the survey.
Q2. Have the following company indicators decreased, remained unchanged or increased over the past six months?
2.2 SMEs continued to rank access to finance as their least important concern
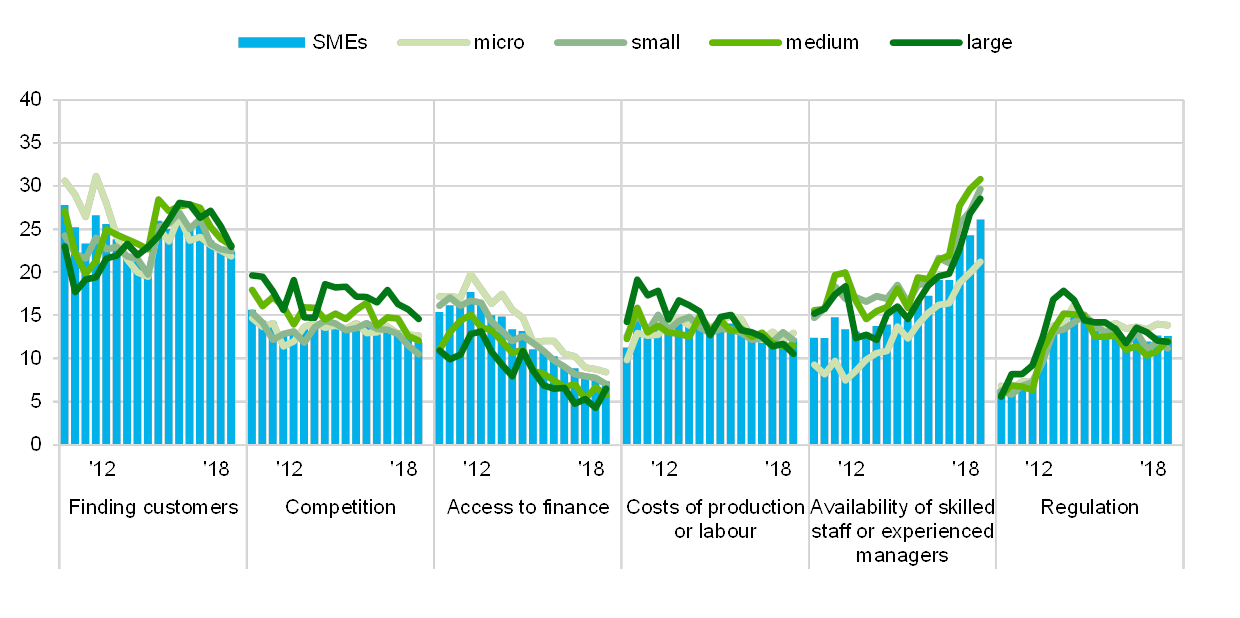
Availability of skilled labour continues to be the dominant concern for euro area SMEs, together with the difficulty of finding customers, while access to finance was considered the least important obstacle. In this survey round, 26% of euro area SMEs cited “availability of skilled labour” as their main problem (up from 24% in the previous survey round), followed by “difficulty of finding customers” (22%, down from 23%) (see Chart 5).
Looking at small, medium and large euro area companies, the main concern across the board was “availability of skilled labour”, with net percentages of 30%, 31% and 29% respectively, followed by “finding customers” (22%, 23% and 23% respectively). However, micro firms were more or less equally concerned about finding skilled staff (21%) and finding customers (22%). The differences across firm size may reflect the fact that demand for staff is lower among micro firms, while a higher share of large firms reported that the lack of skilled staff is a pressing problem in their business (29%, up from 27%). “Access to finance” was considered the least important obstacle for euro area SMEs (7%, down from 8%), after “cost of production” (12%, unchanged), “competition” (12%, unchanged) and “regulation” (13%, unchanged).
Concern about access to finance, which has tended to decrease with firm size in the past, was roughly similar across all firms in this survey round. 8% of micro firms reported that access to finance was an obstacle, while the net percentage was 7% for large companies (up from 4%), 7% for small companies and 6% for medium-sized companies.
The most important problems faced by euro area enterprises
(percentages of respondents)
Base: All enterprises. Figures refer to rounds three (March-September 2010) to nineteen (April-September 2018) of the survey.Notes: The formulation of the question has changed over the survey rounds. Initially, respondents were asked to select one of the categories as the most pressing problem. From round eight, all respondents were asked to indicate how pressing a specific problem was on a scale from 1 (not pressing) to 10 (extremely pressing). In round seven, the formulation of the question followed the initial phrasing for one half of the sample and the new phrasing for the other half. In addition, if two or more items had the highest score in question Q0B on the “pressingness” of the problems, a follow-up question (Q0C) was asked to resolve this, i.e. which of the problems was more pressing, even if only by a small margin. This follow-up question was removed from the questionnaire in round eleven. The past results from round seven onwards were also recalculated, disregarding the replies to question Q0C. In round twelve, the word “pressing” was replaced by the word “important”.
Q0. How important have the following problems been for your enterprise in the past six months?
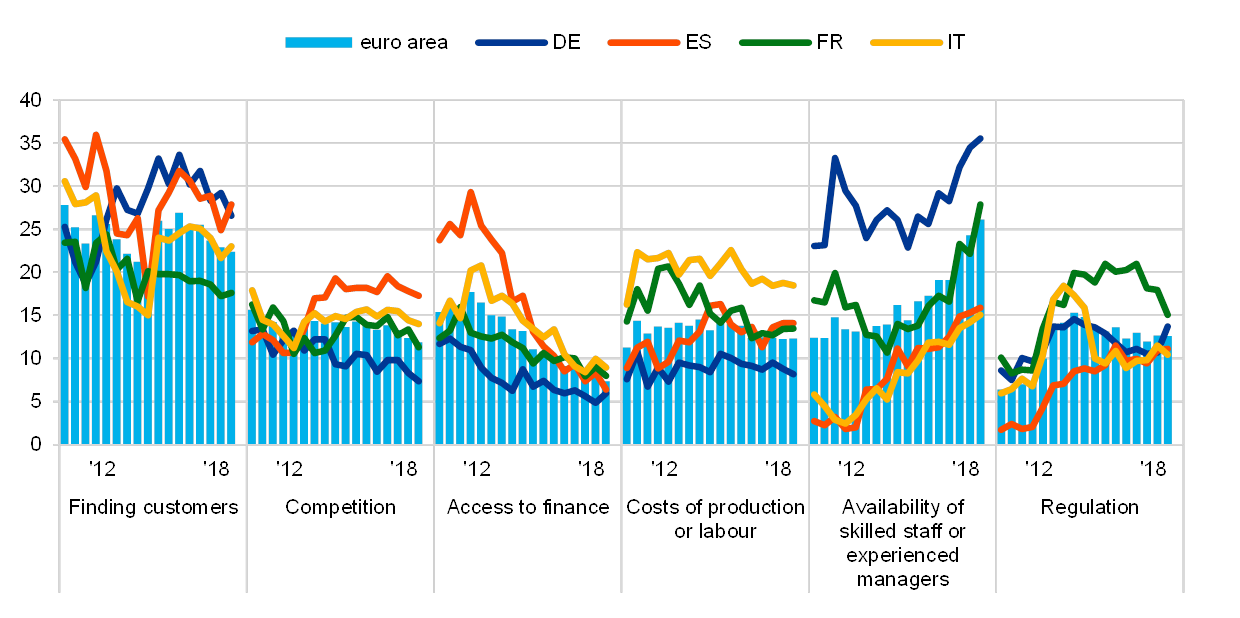
The euro area aggregate masks considerable differences across countries (see Chart 6 and Chart 4a in Annex 1). German (35%) and French SMEs (28%) most frequently cited the availability of skilled staff as their dominant concern, ahead of finding customers (27% and 18%, respectively). Spanish (28%) and Italian (23%) SMEs instead reported finding customers as their main problem. SMEs in Greece continued to be disproportionately affected by the lack of access to finance, with, on balance, 17% (down from 21%) still mentioning it as their most important problem, well above the levels for the euro area as a whole (7%) and other individual countries, for all of which it remained in single digits.
The most important problems faced by euro area SMEs
(percentages of respondents)
Base: All SMEs. Figures refer to rounds three (March-September 2010) to nineteen (April-September 2018) of the survey.Note: See the notes to Chart 5.
Q0. How important have the following problems been for your enterprise in the past six months?
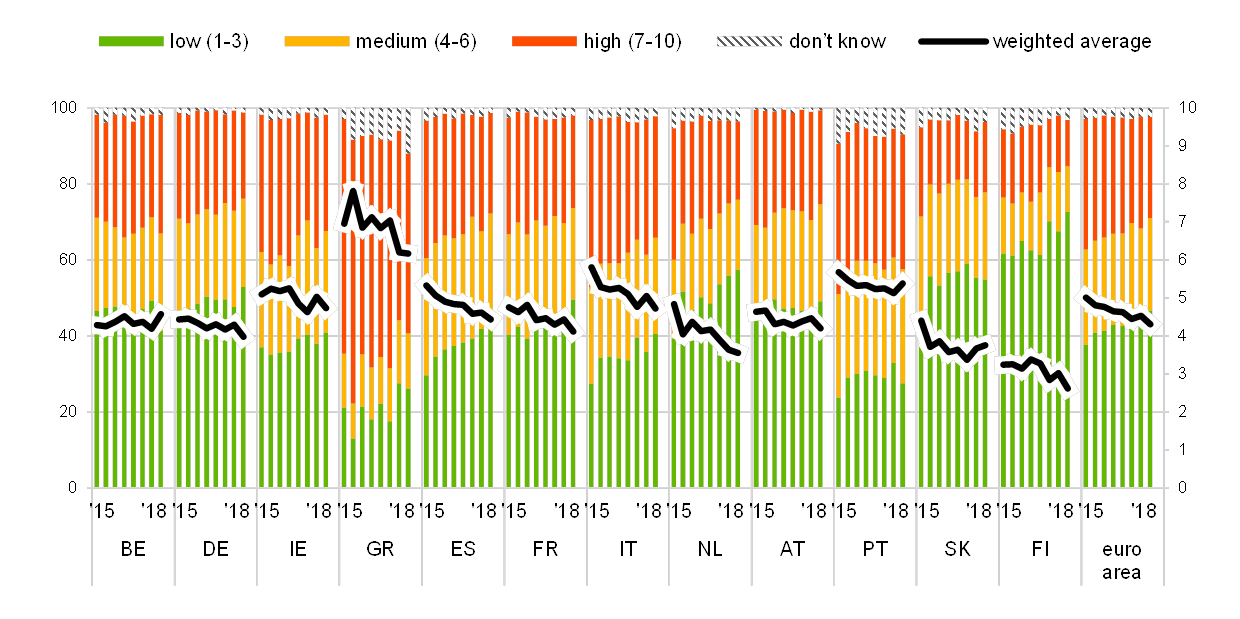
A similar picture emerges when looking at the replies on whether “access to finance” was a problem in their current situation on a scale of 1-10. SMEs in Greece continued to perceive it as a very important issue (rating it at 6.2 on average; see Chart 7), followed by scores of 5.4 in Portugal and 4.7 in both Italy and Ireland. The remainder of the countries reported scores close to or below the euro area average of 4.3, with SMEs in Finland continuing to report the lowest average score (2.6).
Importance of access to finance as perceived by SMEs across euro area countries
(left-hand scale: percentages; right-hand scale: weighted averages)
Base: All SMEs. Figures refer to rounds twelve (October 2014-March 2015) to nineteen (April-September 2018) of the survey. Notes: Enterprises were asked to indicate how important a specific problem was on a scale from 1 (not at all important) to 10 (extremely important). On the chart, the scale has been divided into three categories: low (1-3), medium (4-6) and high importance (7-10). The weighted average score is an average of the responses using the weighted number of respondents.
Q0b. How important have the following problems been for your enterprise in the past six months?
3 External sources of financing and needs of SMEs in the euro area
3.1 Banks remained the most relevant source of finance
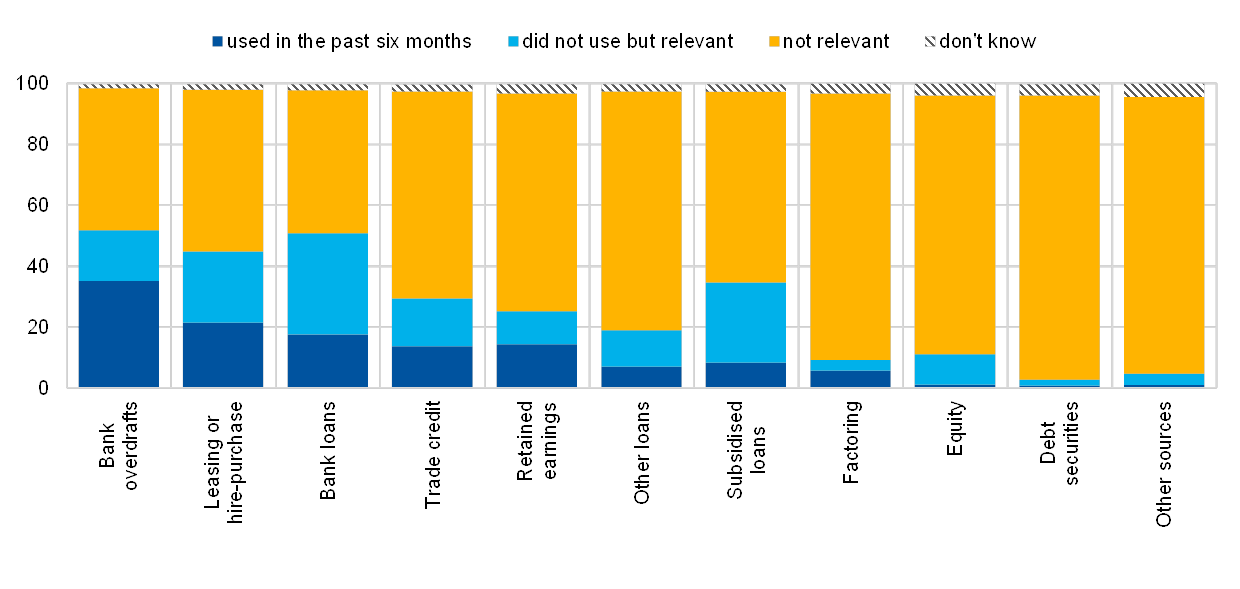
Bank-related products remained the most relevant financing source for SMEs, ahead of market-based instruments and other sources of finance. For the period from April to September 2018, just over half of the euro area SMEs considered bank loans and credit lines to be relevant financial instruments for their businesses (51% and 52%, respectively) (see Chart 8).[9] Leasing or hire-purchase was relevant for 45% of SMEs, while 35% indicated that grants and subsidised loans were a potential source of finance. Such loans involve support from public sources in the form of guarantees or other interventions. About 30% of SMEs considered trade credit an important financial instrument, while 25% reported using their internal funds to finance their business activity. Finally, 19% of SMEs pointed to other loans, for example from family, friends or related companies, as a relevant source of finance. Market-based instruments, such as equity (11%) and debt securities (3%), and factoring (9%) were much less frequently considered a potential source of finance.
Relevance of financing sources for euro area SMEs
(over the preceding six months; percentages of respondents)
Base: All SMEs. Figures refer to round nineteen (April-September 2018) of the survey.
Q4. Are the following sources of financing relevant to your enterprise, that is, have you used them in the past or considered using them in the future? If “yes”, have you obtained new financing of this type in the past six months?
The use of all financing instruments increased with firm size. Compared with SMEs, a greater share of large firms reported having used any given financing instrument (see Chart 9). Short-term bank finance (credit line/bank overdraft/credit card) remained the most popular instrument by some margin, followed by leasing and bank loans. Equity and debt securities, on the other hand, were among the least frequently used sources of finance. This pattern applied to both SMEs and large firms.
Use of internal and external funds by euro area enterprises by firm size
(percentages of respondents that had used the respective instrument in the past six months)
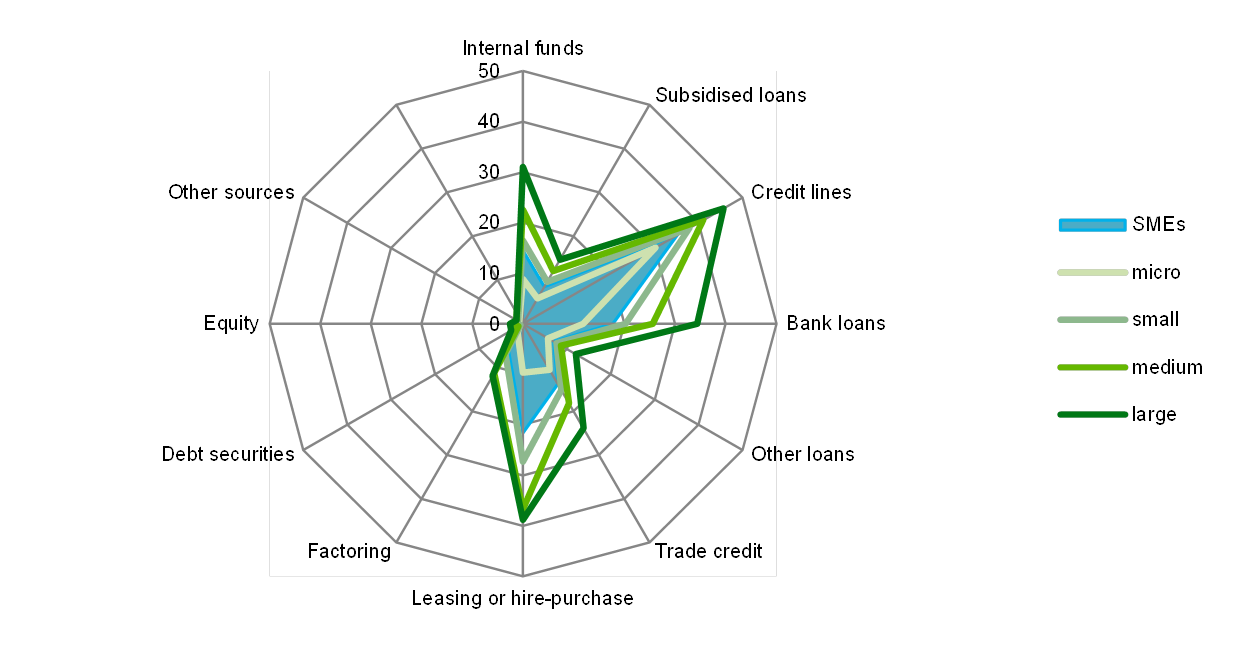
Base: All enterprises. Figures refer to round nineteen (April-September 2018) of the survey.
Q4. Are the following sources of financing relevant to your enterprise, that is, have you used them in the past or considered using them in the future? If “yes”, have you obtained new financing of this type in the past six months?
Focusing on vulnerable and profitable SMEs[10] only (see Chart 10), it can be seen that vulnerable firms resorted to credit lines (54%) and banks loans (26%) as their main source of external finance, and to a much greater degree than profitable firms (27% and 14% respectively).
Use of internal and external funds by euro area SMEs across profitable and vulnerable firms
(percentages of respondents that had used the respective instrument in the past six months)
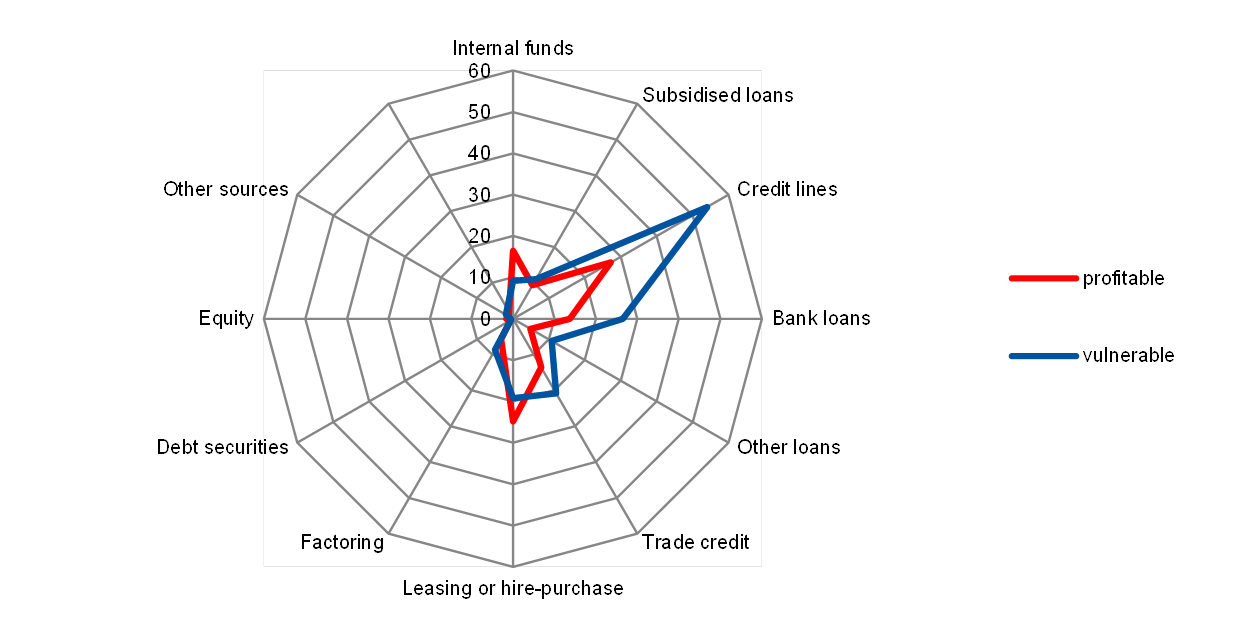
Base: All SMEs. Figures refer to round nineteen (April-September 2018) of the survey.
Q4. Are the following sources of financing relevant to your enterprise, that is, have you used them in the past or considered using them in the future? If “yes”, have you obtained new financing of this type in the past six months?
3.2 Significant heterogeneity in demand for external financing from euro area non-financial corporations
Demand for all external financing instruments was strongly related to firm size during the period under review (see Chart 11). SMEs reported no changes in their demand for bank loans[11] (0%, from 3%), while, on balance, large enterprises continued to report higher demand for loans (14%, from 8%). A similar discrepancy across firm size is shown for credit lines, trade credit and other types of loan, while demand for leasing and hire-purchase seems to have eased for large firms (17%, from 19%) and slightly increased for SMEs (13%, from 12%).
Large firms reported increased demand for external financing more frequently than SMEs. In net terms, a higher share of large firms reported increases in demand for external finance (demand for bank loans increased by 14%, up from 8%; access to credit lines increased by 15%, up from 8%). Moreover, on balance, demand for trade credit (16%, up from 11%) and other loans (13%, up from 3%) also continued to expand, while demand for leasing activity eased somewhat in comparison to the previous survey round (17%, down from 19%).
Change in external financing needs of euro area enterprises
(over the preceding six months; net percentages of respondents)
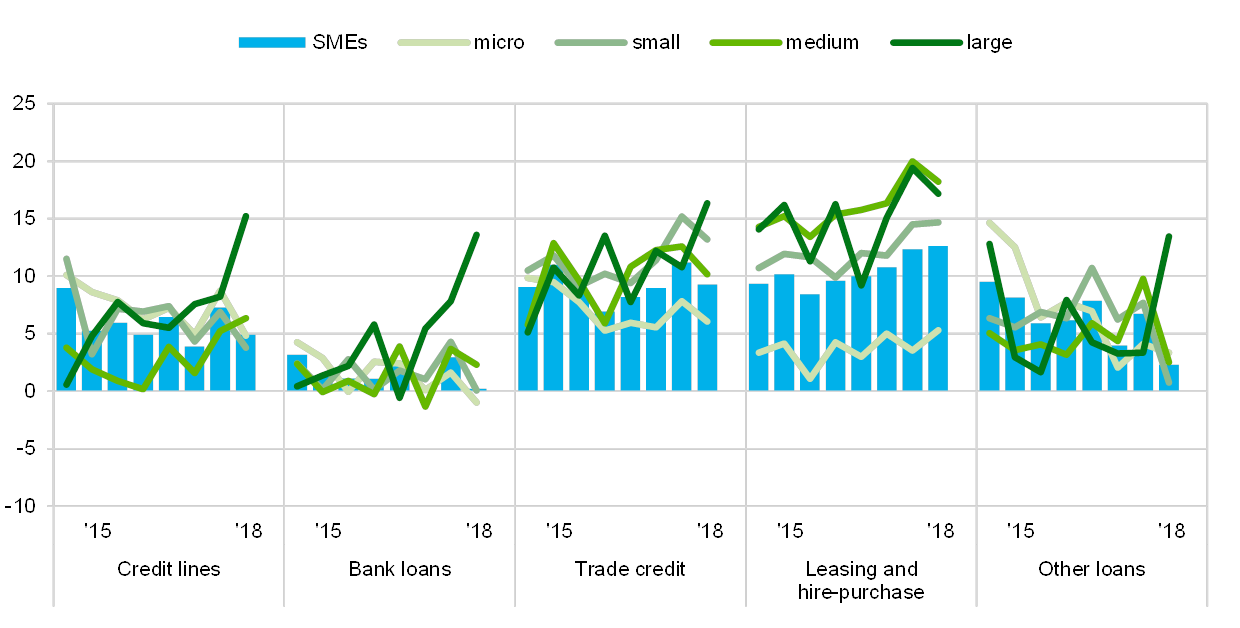
Base: Enterprises for which the respective instrument is relevant. Figures refer to rounds twelve (October 2014-March 2015) to nineteen (April-September 2018) of the survey.Notes: See the notes to Chart 1. The categories “Other loans” and “Leasing or hire-purchase” were introduced in round twelve (October 2014-March 2015). A financing instrument is “relevant” if the enterprise used the instrument in the past six months or did not use it but has experience of it (for rounds one to ten). From round eleven onwards, the respondents were asked whether the instrument was relevant, i.e. whether the enterprise had used it in the past or considered using it in the future. Given that the current concept of a “relevant” financing instrument differs from that used in the past, this might have an impact on the comparability over time for the subsequent questions. Caution should therefore be exercised when comparing the recent results with those of the previous rounds.
Q5. For each of the following types of external financing, please indicate if your needs increased, remained unchanged or decreased over the past six months.
SMEs’ demand for bank finance eased across the euro area, including the four largest economies. The need for bank loans continued to decline in Germany (-8%, from -4%) and Spain (-3%, unchanged), while in France (8%, from 10%) and Italy (6%, from 12%) SMEs indicated increasing needs (see Chart 12). The demand for credit lines also eased in all four countries, particularly in Italy (7%, from 13%). Similarly, SMEs from large countries reported, on balance, a lower need for trade credit, while demand for leasing and hire purchase increased in Spain (11%, from 8%) and France (18%, from 14%).
In the other euro area countries, demand for external financing continued to be strongest in Greece. Nonetheless, on balance, Greek SMEs’ demand for bank loans and credit lines fell to 19% (from 23%) (see Chart 5a in Annex 1) and 22% (from 28%), respectively.
Change in external financing needs of euro area SMEs
(over the preceding six months; net percentages of respondents)
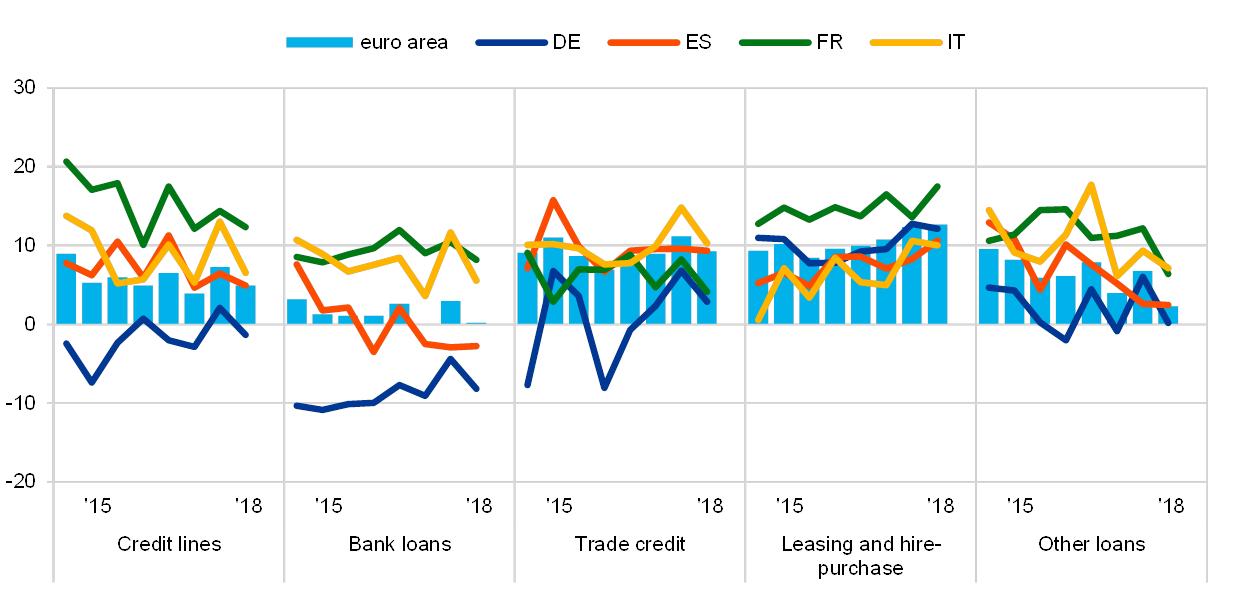
Base: SMEs for which the respective instrument is relevant. Figures refer to rounds twelve (October 2014-March 2015) to nineteen (April-September 2018) of the survey.Note: See the notes to Chart 1 and Chart 11.
Q5. For each of the following types of external financing, please indicate if your needs increased, remained unchanged or decreased over the past six months.
3.3 SMEs continued to use financing mostly for fixed investments, inventory and working capital
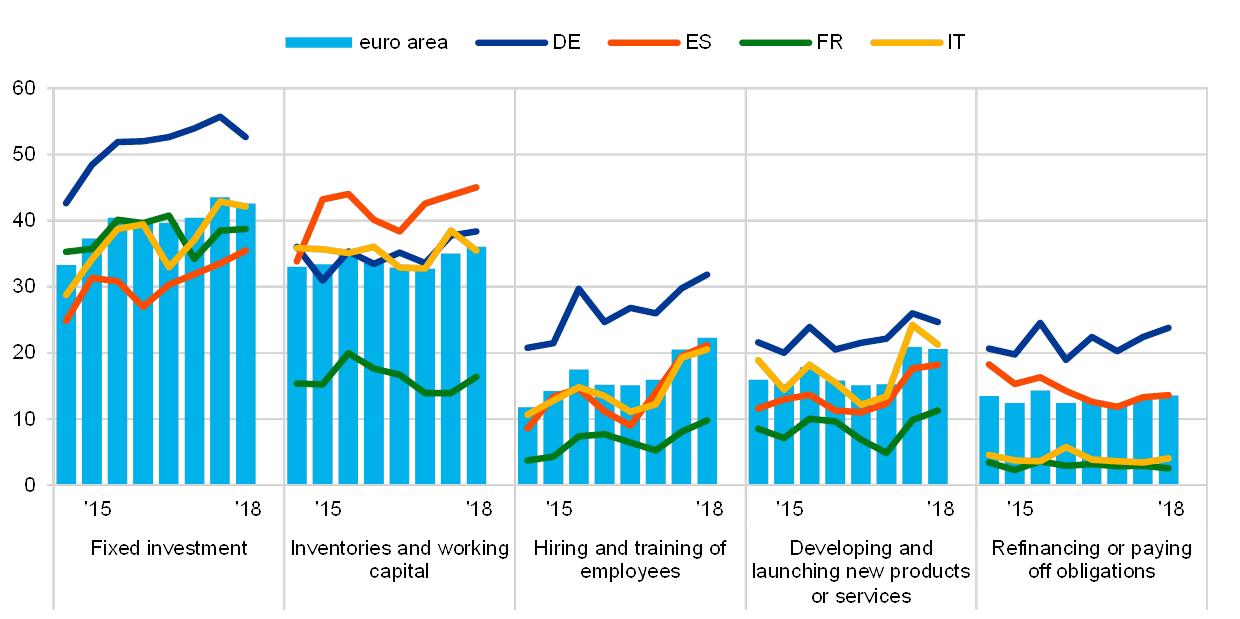
Financing from external and internal sources continued being used mainly for fixed investment, followed by inventories and working capital. Financing for hiring and training new employees and for developing and launching new products remained broadly unchanged from the previous survey round. About 43% of SMEs (from 44%) reported using financing for fixed investment, while 36% (from 35%) mentioned inventory and working capital (see Chart 13).
Purpose of the financing as perceived by euro area enterprises
(over the preceding six months; percentages of respondents)

Base: All enterprises. Figures refer to rounds twelve (October 2014-March 2015) to nineteen (April-September 2018) of the survey.Note: The figures are based on the new question introduced in round eleven (April-September 2014).
Q6A. For what purpose was financing used by your enterprise during the past six months?
The prevalence of fixed investment continued to be associated with company size. While 67% of large firms reported using funds for fixed investment, this applied to only 34% of micro firms. Investment in working capital and inventories was also correlated with firm size. Less frequently, SMEs used financing to hire employees (22%, from 21%), develop new products (21%, unchanged), and refinance obligations (14%, from 13%).
Among the large euro area countries, German SMEs continued to stand out in terms of the high prevalence of fixed investment, hiring and training and refinancing purposes. About 53% of German SMEs reported using funding for fixed investment, compared with only 35% of Spanish or 39% of French SMEs. Spanish firms continued to make strong use of financing for inventory and working capital (45%) more frequently than for fixed investment (see Chart 14).
Purpose of the financing as perceived by SMEs across euro area countries
(over the preceding six months; percentages of respondents)
Base: All SMEs. Figures refer to rounds twelve (October 2014-March 2015) to nineteen (April-September 2018) of the survey.Note: See the note to Chart 13.
Q6A. For what purpose was financing used by your enterprise during the past six months?
4 Availability of external financing for SMEs in the euro area
4.1 Improved availability of external financing, with some moderation particularly for larger firms
4.1.1 Availability of all external financing sources increased, but less than previously
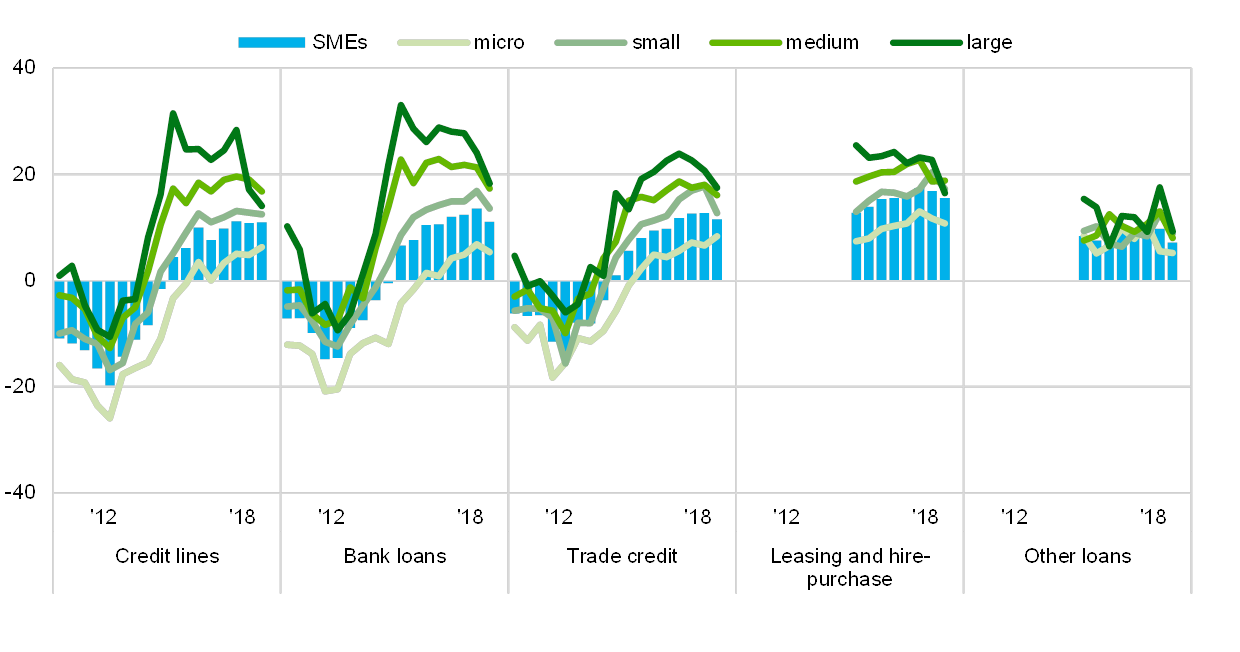
In the latest round of the survey, fewer SMEs reported improved availability of the external financing sources relevant for their business (see Chart 15).[12] Particularly for bank loans, one of the most important means of funding for SMEs, the net percentage of respondents indicating improved availability declined to 11% (from 14%). For all other financing instruments, the net percentage of SMEs reporting easier access stayed positive and roughly constant, at 11% for credit lines, 12% for trade credit, 16% for leasing and hire-purchase, and 7% for other loans.
Change in the availability of external financing for euro area enterprises
(over the preceding six months; net percentages of respondents)
Base: Enterprises for which the respective instrument is relevant. Figures refer to rounds three (March-September 2010) to nineteen (April-September 2018) of the survey. Note: See the notes to Chart 1 and Chart 11.
Q9. For each of the following types of financing, would you say that their availability has improved, remained unchanged or deteriorated for your enterprise over the past six months?
Large and medium-sized companies continued to be the most positive in their assessment of the availability of external financing. However, the difference between them and smaller firms has narrowed somewhat in recent rounds of the survey. The net percentage of firms reporting better access to external funding declined most for medium-sized and large enterprises. Nonetheless, the gaps remained sizeable, particularly in the case of bank loans, for which only a net 5% of micro firms reported better availability, whereas a net 18% of large companies did. The differences are somewhat smaller for trade credit (8% against 17%), credit lines (6% against 14%), other loans (5% against 9%) and leasing and hire-purchase (11% against 16%).
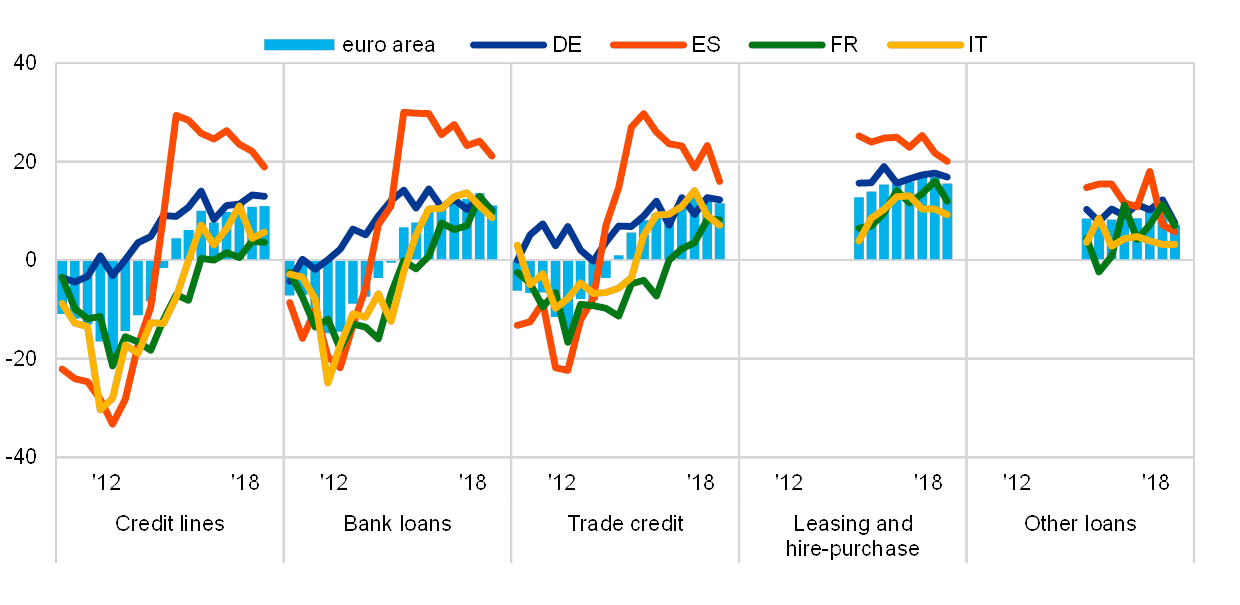
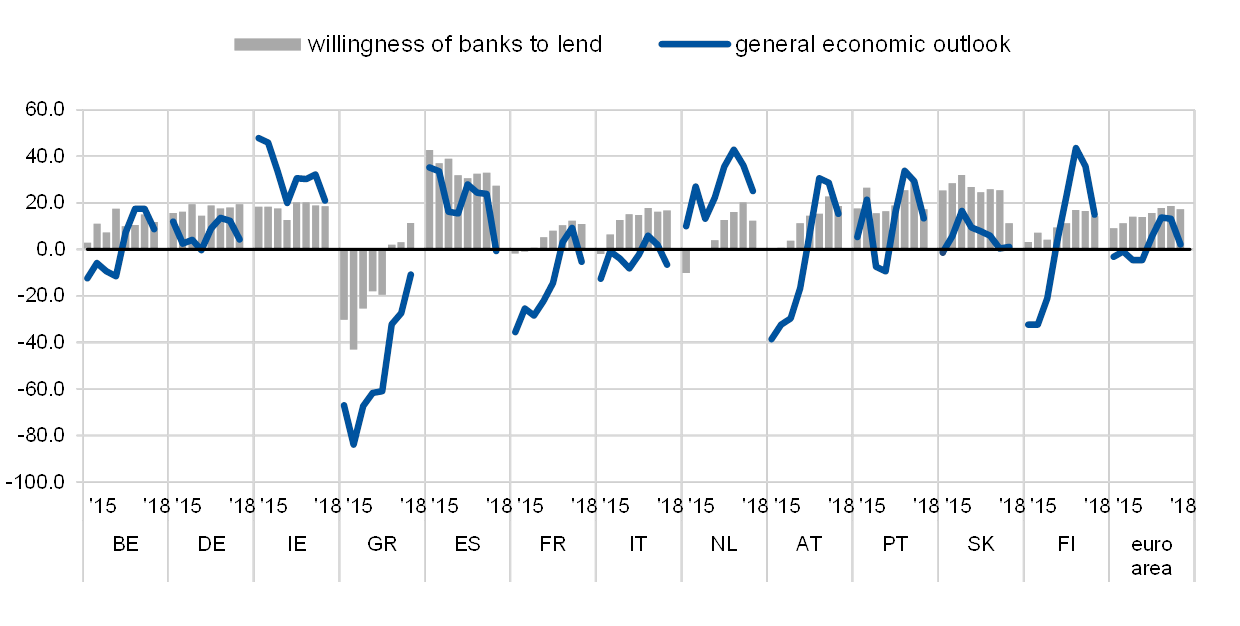
Across countries, the differences are narrowing (see Chart 16 and Chart 5a in Annex 1). However, lower net percentages of respondents indicated better availability of bank products, except for Greek SMEs. Similarly, fewer firms were reporting better access to leasing and hire-purchase, except in Austria, Greece and Portugal, and to other loans, except in Belgium. Overall, SMEs in Spain still remained most sanguine about their external financing environment.
Change in the availability of external financing for euro area SMEs
(over the preceding six months; net percentages of respondents)
Base: SMEs for which the respective instrument is relevant. Figures refer to rounds three (March-September 2010) to nineteen (April-September 2018) of the survey.Note: See the notes to Chart 1 and Chart 11.
Q9. For each of the following types of financing, would you say that their availability has improved, remained unchanged or deteriorated for your enterprise over the past six months?
4.1.2 External financing availability seen to rise faster than needs
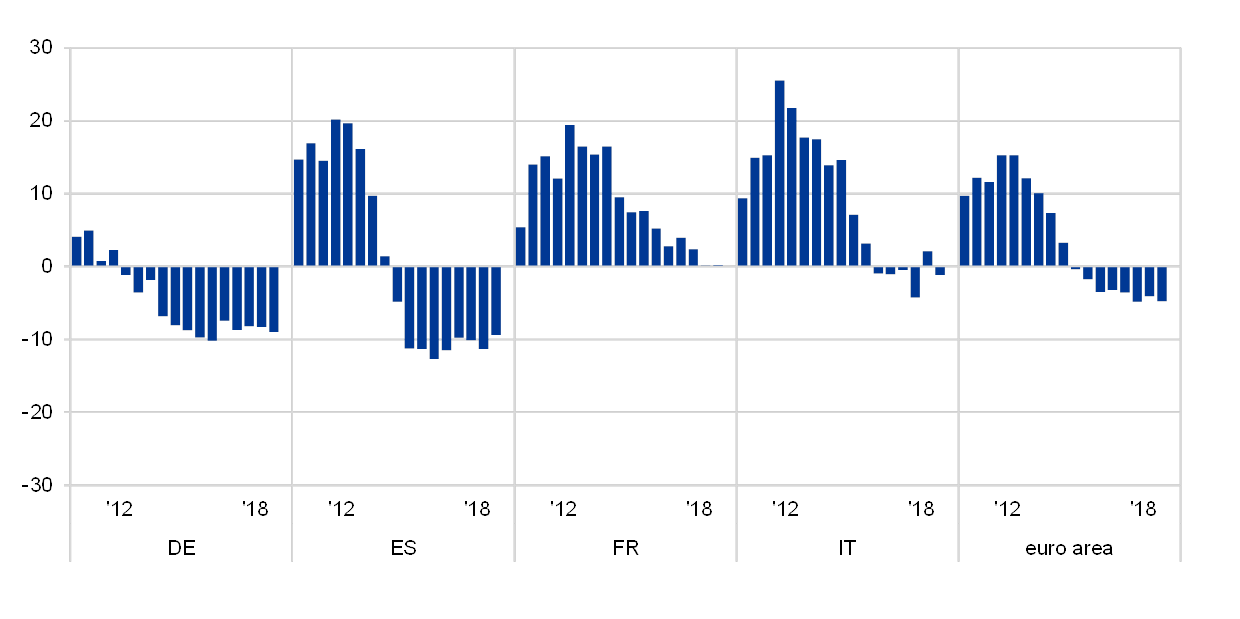
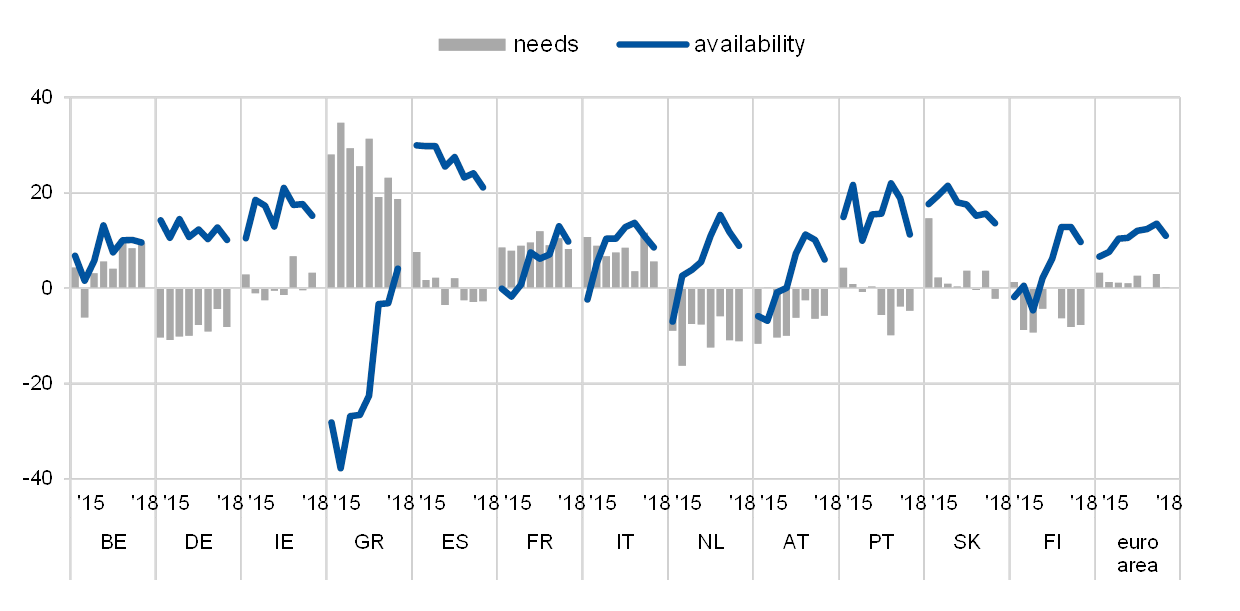
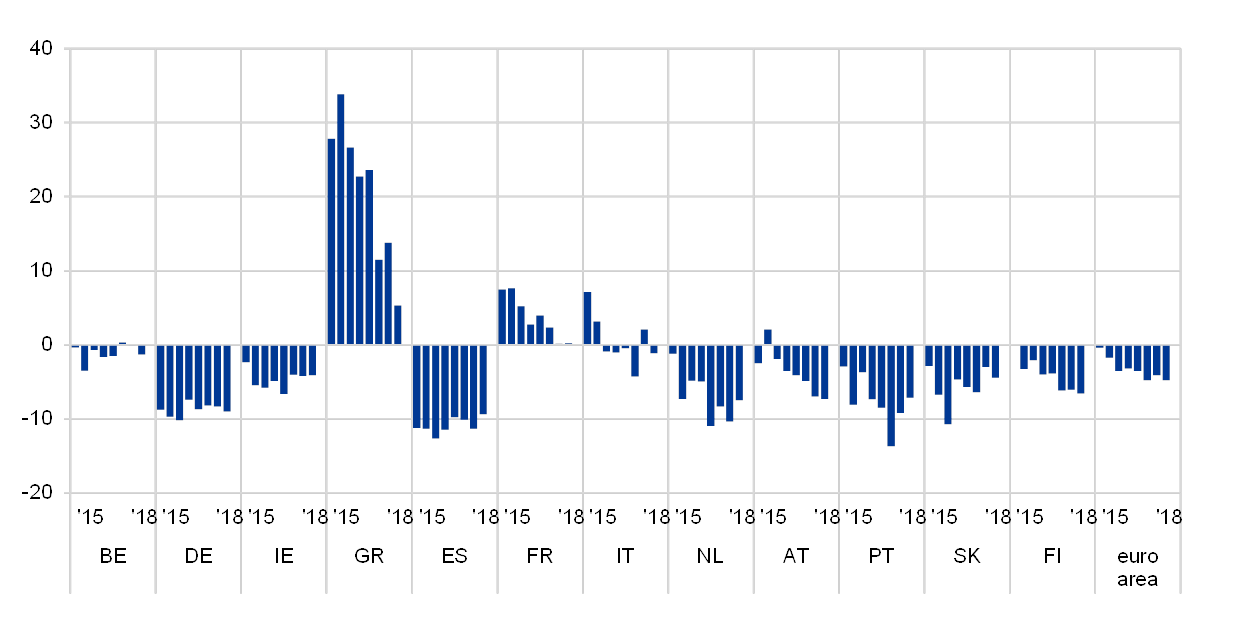
For the euro area as a whole, SMEs perceived the improvements in their access to external funds to be larger than the increases in corresponding financing needs, resulting in a negative external financing gap of -5% (see Chart 17). At the level of individual euro area countries, the financing gap was negative in the majority of cases, most notably in Germany and Spain (both -9%), the Netherlands (-8%), Portugal and Austria (both -7%) (see also Chart 6a in Annex 1). In France, external funding availability and needs were in balance in the recent round of the survey, while SMEs in Greece continued to remain financially constrained, though with a substantial improvement in the financing gap (5%, from 14%).
Change in the external financing gap perceived by SMEs across euro area countries
(over the preceding six months; weighted net balances)
Base: SMEs for which the respective instrument is relevant. “Not applicable” and “Don’t know” answers are excluded. Figures refer to rounds three (March-September 2010) to nineteen (April-September 2018) of the survey.Notes: See the notes to Chart 11. The financing gap indicator combines both financing needs and availability of bank loans, credit lines, trade credit, equity and debt securities at firm level. For each of the five financing instruments, the indicator of the perceived change in the financing gap takes the value of 1 (-1) if the need increases (decreases) and availability decreases (increases). If enterprises perceive only a one-sided increase (decrease) in the financing gap, the variable is assigned a value of 0.5 (-0.5). The composite indicator is the weighted average of the financing gap related to the five instruments. A positive value of the indicator suggests an increasing financing gap. Values are multiplied by 100 to obtain weighted net balances in percentages.
Q5. For each of the following types of external financing, please indicate if your needs increased, remained unchanged or decreased over the past six months.Q9. For each of the following types of financing, would you say that their availability has improved, remained unchanged or deteriorated for your enterprise over the past six months?
4.1.3 Ongoing improvement in the willingness of banks to lend, supported more by firm-specific factors than the general economic outlook
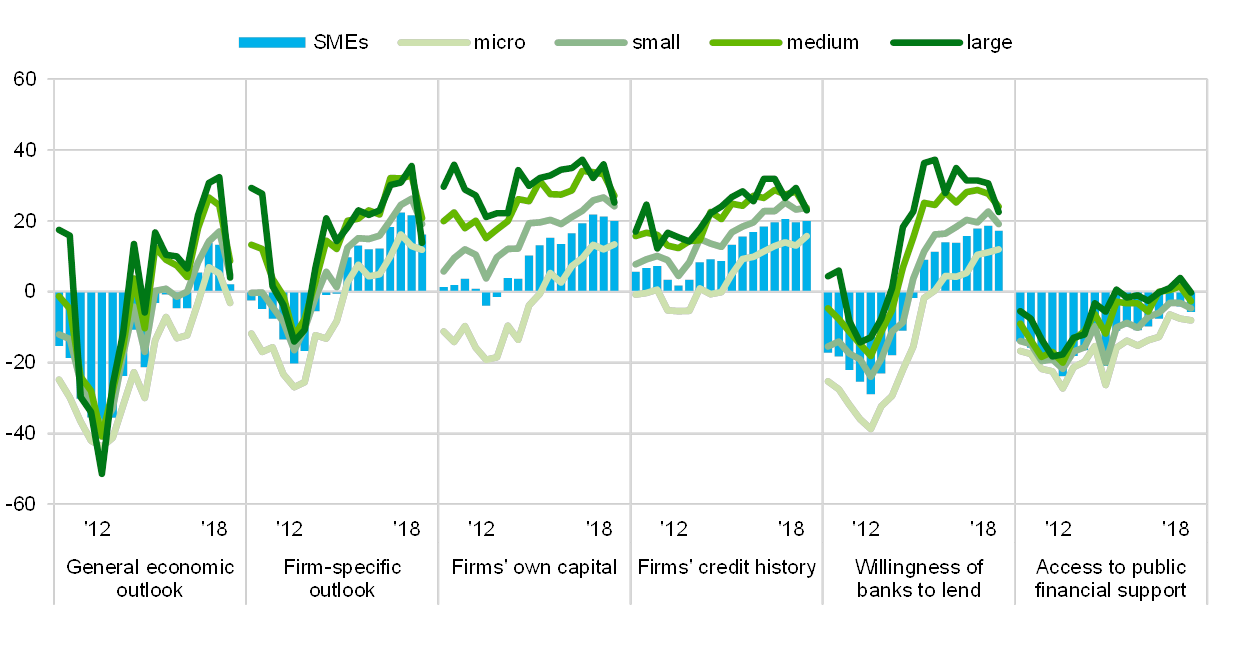
Firm-specific factors supported the access by SMEs to external financing to a lower degree than in the previous round (see Chart 18). Specifically, the firm-specific outlook (16%, from 22%), firms’ own capital (20%, from 21%) and firms’ credit history (20%, unchanged) continued to positively shape SMEs’ perceptions of the availability of external financing. However, in this survey round, only a net 2% (from 13%) of SMEs reported a positive effect on access external finance from the general economic outlook. In addition, access to public financial support continued to register as a negative factor in net terms, as in the previous survey rounds.
Change in factors with an impact on the availability of external financing to euro area enterprises
(over the preceding six months; net percentages of respondents)
Base: All enterprises; for the category “Willingness of banks to lend”, enterprises for which at least one bank financing instrument (credit line, bank overdraft, credit card overdraft, bank loan, subsidised bank loan) is relevant. Figures refer to rounds three (March-September 2010) to nineteen (April-September 2018) of the survey.Note: From round eleven (April-September 2014), the category “Willingness of banks to provide a loan” was reformulated slightly to “Willingness of banks to provide credit to your enterprise”.
Q11. For each of the following factors, would you say that they have improved, remained unchanged or deteriorated over the past six months?
Banks’ willingness to provide credit continued to improve, albeit more moderately than in the previous round. A smaller net percentage of SMEs reported increasing willingness of banks to lend in this survey round (17%, down from 19%), though the net percentage has remained on the high side since it re-entered positive territory as a result of the various non-standard monetary policy measures adopted by the Eurosystem since 2014.
In comparison to SMEs, large enterprises generally conveyed a slightly more favourable view of the factors influencing their access to external finance. However, for the first time since 2013, fewer large companies than medium and small-sized companies perceived the general economic outlook to be supportive for their access to external finance, while for micro firms the macroeconomic conditions seem again to have become an impediment to access to finance. Regarding more firm-specific variables, the assessment by large enterprises continued to improve in net terms, but much less relative to the previous survey rounds and relative to medium-sized companies. For the willingness of banks to lend, the net percentage of micro firms indicating better conditions increased (to 12% from 11%), while it declined for the other size classes, in particular for large enterprises (to 23% from 31%).
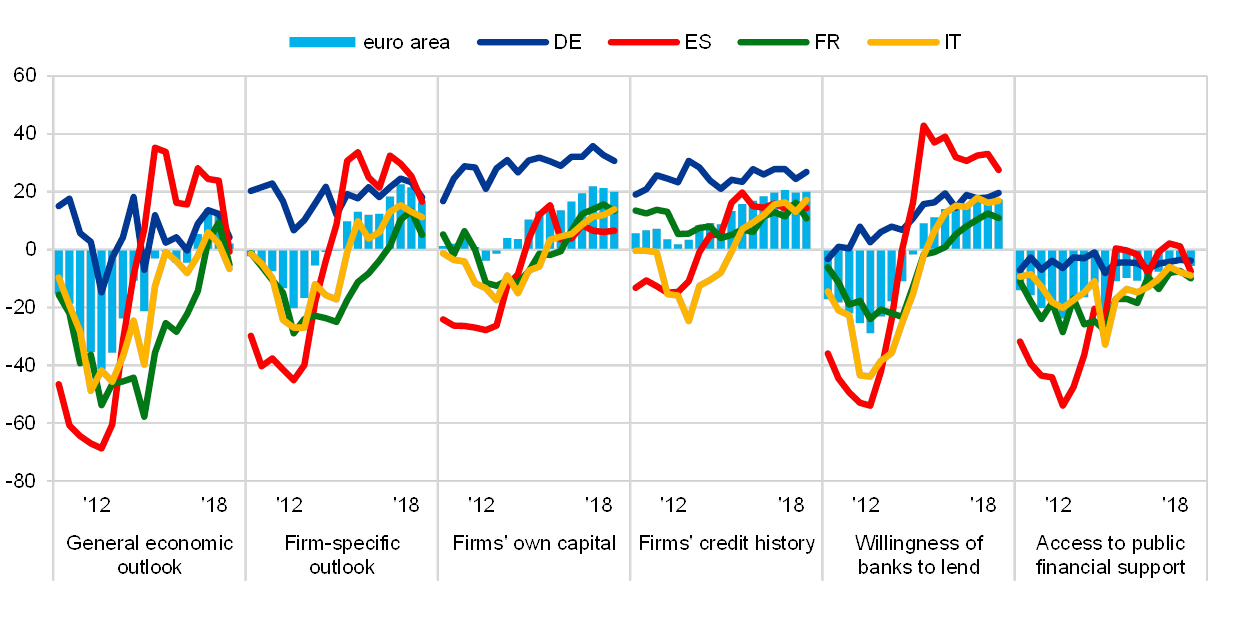
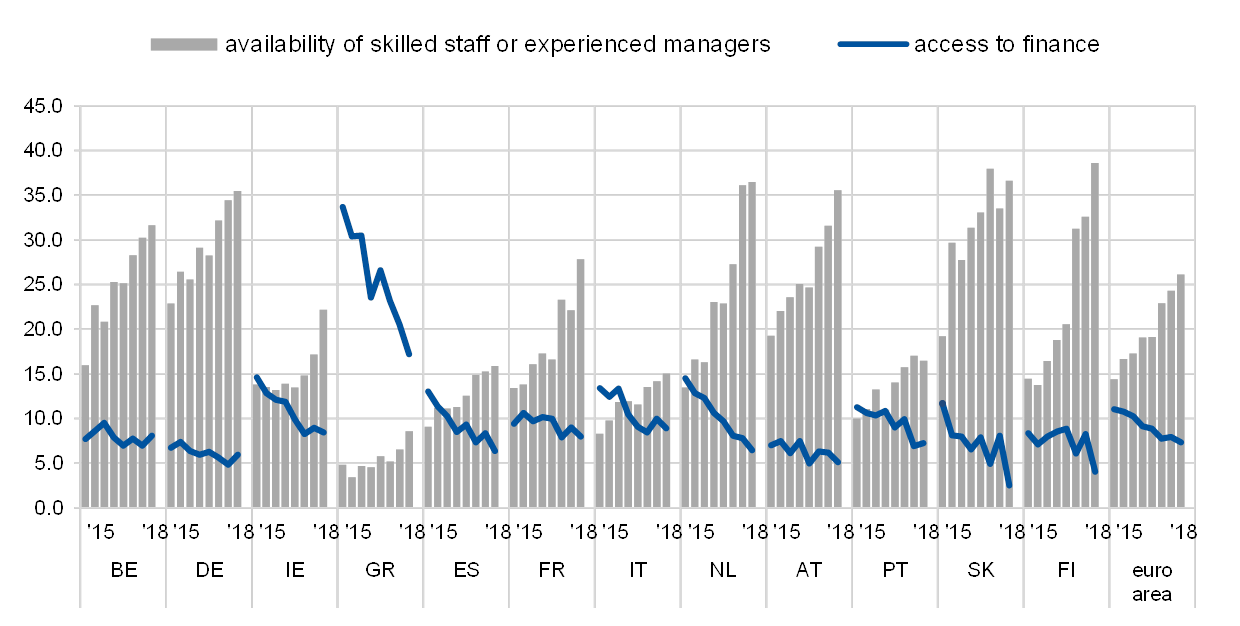
In most of the largest euro area countries, SMEs’ positive sentiment about nearly all factors affecting their access to external finance cooled further relative to the previous round of the survey (see Chart 19). In particular, SMEs in Italy (-7%, from 2%), France (-5%, from 9%) and Spain (-1%, from 24%) assessed the general economic outlook as a negative influence on the availability of external funding. In Germany, the perception was still favourable, but the net percentage was rather low (4%, down from 12%).
Change in factors with an impact on the availability of external financing to euro area SMEs
(over the preceding six months; net percentages of respondents)
Base: All SMEs; for the category “Willingness of banks to lend”, SMEs for which at least one bank financing instrument (credit line, bank overdraft, credit card overdraft, bank loan, subsidised bank loan) is relevant. Figures refer to rounds three (March-September 2010) to nineteen (April-September 2018) of the survey.Note: From round eleven (April-September 2014), the category “Willingness of banks to provide a loan” was reformulated slightly to “Willingness of banks to provide credit to your enterprise”.
Q11. For each of the following factors, would you say that they have improved, remained unchanged or deteriorated over the past six months?
On balance, SME’s in the other euro area countries also considered the willingness of banks to lend to have improved, but less so than in the previous round of the survey. This was also the case for most other factors affecting the availability of external financing, including the general economic outlook, which was generally assessed more cautiously than in the October 2017-March 2018 survey (see Chart 7a in Annex 1). Specifically, the willingness of banks to lend was seen as having declined most in Slovakia (11%, down from 25%), the Netherlands (12%, down from 20%) and Portugal (17%, down from 29%), with only Greece (11%, up from 3%) recording an increase. Regarding the impact of the general economic outlook, SMEs in most economies strongly curbed the optimism expressed about this factor in the previous round of the survey, while still acknowledging its overall positive contribution to the availability of external financing.
Similarly, firm-specific factors continued to be judged favourably overall, but less so than in the previous survey. Again, Greek SMEs continued to be most constrained by the factors impacting on access to external funding examined by the survey, but registered several improvements regarding the general economic outlook (-11%, from -27%), firms’ credit history (17%, from 12%), and firm-specific outlook (15%, from 2%).
4.2 Unchanged proportion of SMEs seeing financing obstacles
The share of SMEs reporting obstacles to obtaining a bank loan remained unchanged and considerably above the corresponding figure for large enterprises (see Chart 20, panel a). Among enterprises judging bank loans relevant for their funding, 7.7% (from 7.8%) of SMEs faced obstacles to getting a loan, compared to 4.5% (from 3.4%) of large enterprises. The difference was driven primarily by the proportion of SMEs discouraged from applying for a loan in the first place (4.6% of SMEs judging bank loans relevant for their funding against 2.0% of large enterprises) and to a lesser extent by the proportion of loan applications rejected (1.3% for SMEs, against 0.4% for large enterprises). By contrast, the share of firms considering the cost of a loan to be too high was similar for SMEs and large enterprises (0.3%, against 0%), while a slightly higher percentage of large companies reported receiving only a limited part of the loan amount requested (2.1%, against 1.5% for SMEs).
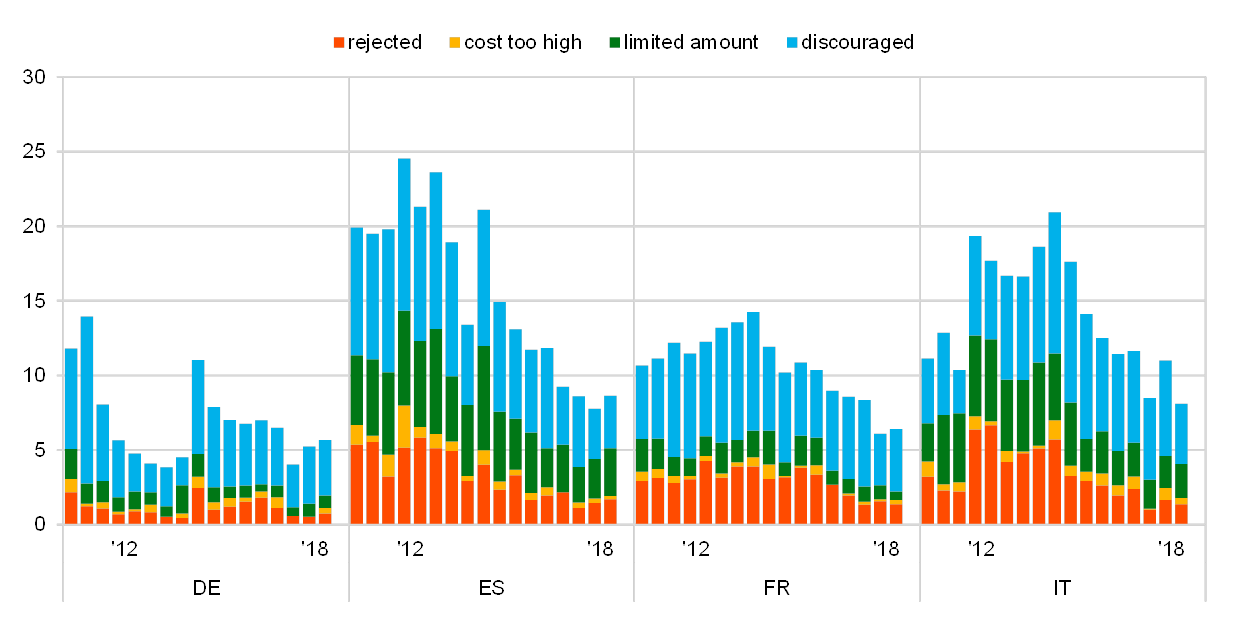
Across the largest euro area countries, the share of SMEs perceiving financing obstacles rose in Spain, Germany and France, but fell in Italy (see Chart 20, panel b). In France and Spain, increases in the percentage of SMEs facing financing obstacles to 6.4% (from 6.1%) and 8.6% (from 7.8%), respectively, were a consequence of SMEs being more discouraged from applying for a loan in France and of only getting limited amounts in Spain. In Germany, the increase in the share of SMEs reporting obstacles to obtaining bank loans to 5.7% (from 5.2%) was mainly the result of more firms feeling that cost of new loans was too high (0.4%, up from 0%). By contrast, in Italy, SMEs reported a decline of financing obstacles to 8.1% (from 11.0%), which was primarily driven by firms feeling less discouraged from applying (4.0%, down from 6.4%). Overall, cross-country differences continued to decrease, after peaks in the October 2011 to March 2012 and April to September 2015 rounds.
Obstacles to receiving a bank loan
Panel a: Euro area SMEs and large enterprises
(over the preceding six months; percentages of respondents)
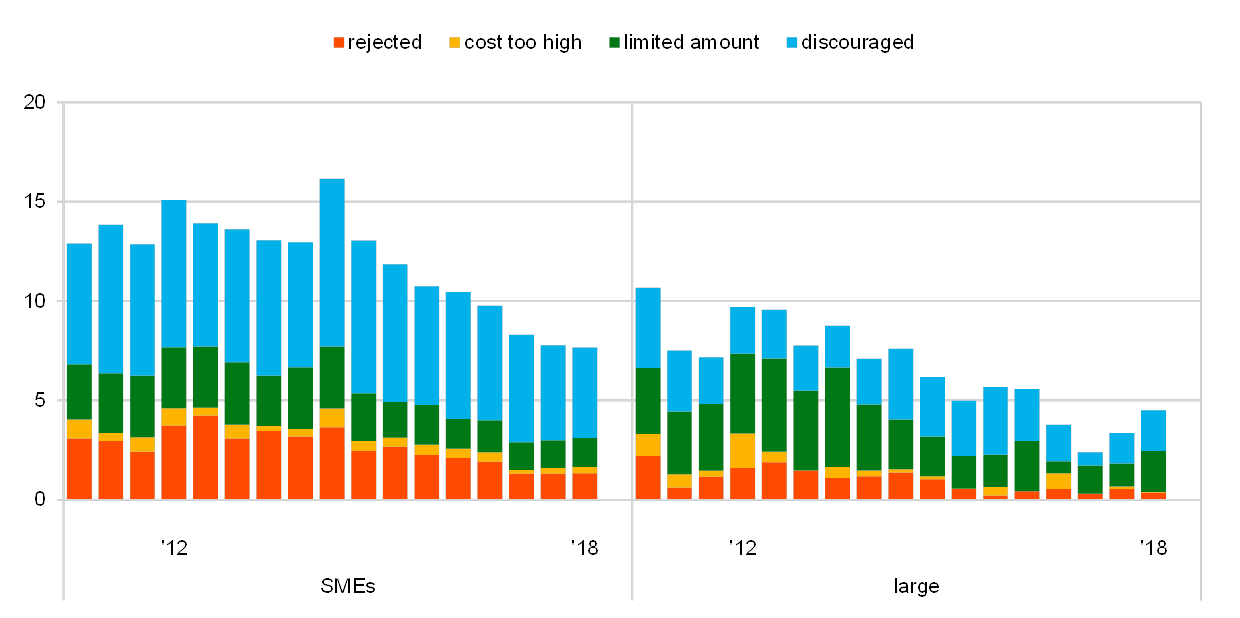
Base: Enterprises for which bank loans (including subsided bank loans) are relevant. Figures refer to rounds three (March-September 2010) to nineteen (April-September 2018) of the survey.Notes: Financing obstacles are defined here as the total of the percentages of enterprises reporting loan applications which were rejected, loan applications for which only a limited amount was granted, loan applications which resulted in an offer that was declined by the enterprises because the borrowing costs were too high, and enterprises which did not apply for a loan for fear of rejection (discouraged borrowers). The calculation of the indicator starts in 2010, when the question on applications for credit lines was first included in the questionnaire. The components of the financing obstacles indicator were affected by the amendments to the questionnaire in round eleven (filtering based on the relevance of the financing instrument and addition of the new category “My application is still pending”), and past data have been revised accordingly. The figures include the categories “My application is still pending” and “Don’t know”.
Panel b: SMEs across euro area countries
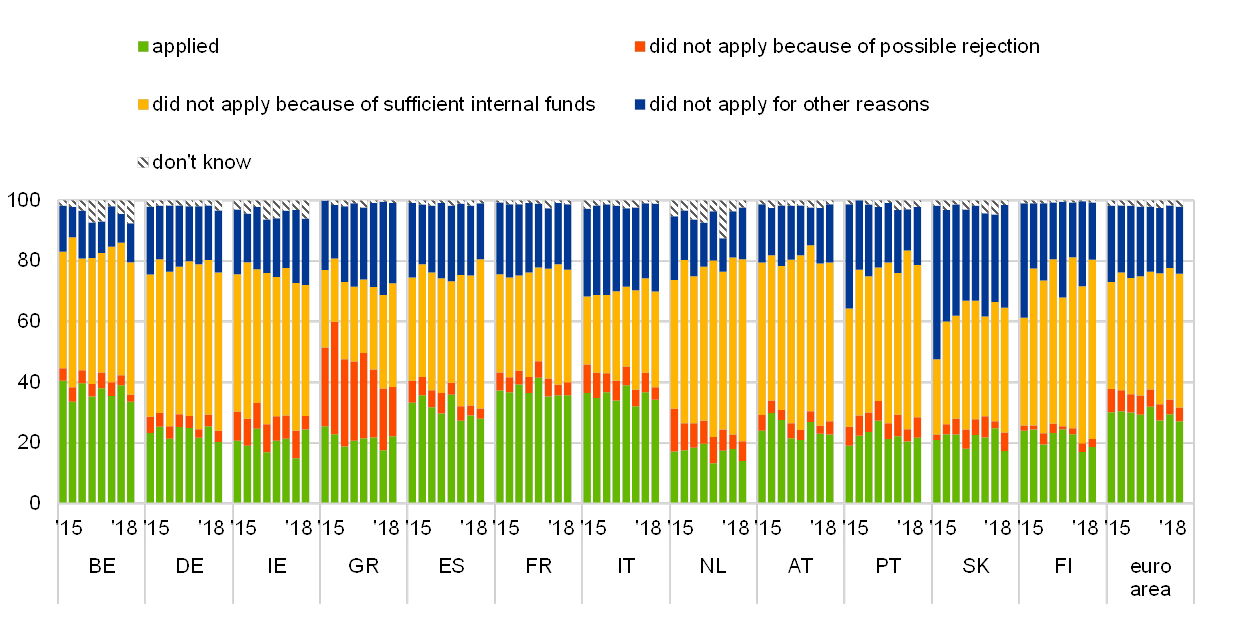
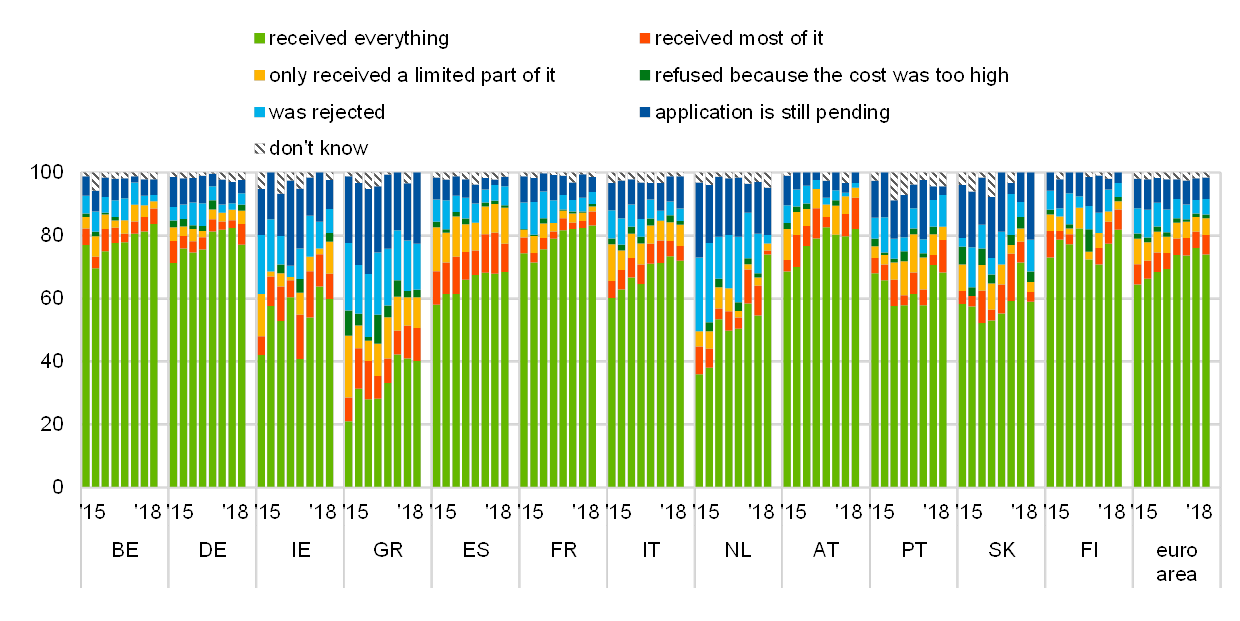
In line with past rounds of the survey, a comparatively small share of SMEs saw the necessity to apply for a bank loan, even when focussing only on firms that deemed such financing relevant for their business (see Chart 8a in Annex 1). At the level of the euro area, less than a third of SMEs applied for a loan, while 44% of SMEs did not apply because of sufficient availability of internal funds. Among firms submitting a loan application, 74% reported being successful in obtaining the full amount requested two percentage points less than in the previous round of the survey (see Chart 9a in Annex 1).
4.3 First signs of increasing interest rates together with rises in non-interest costs
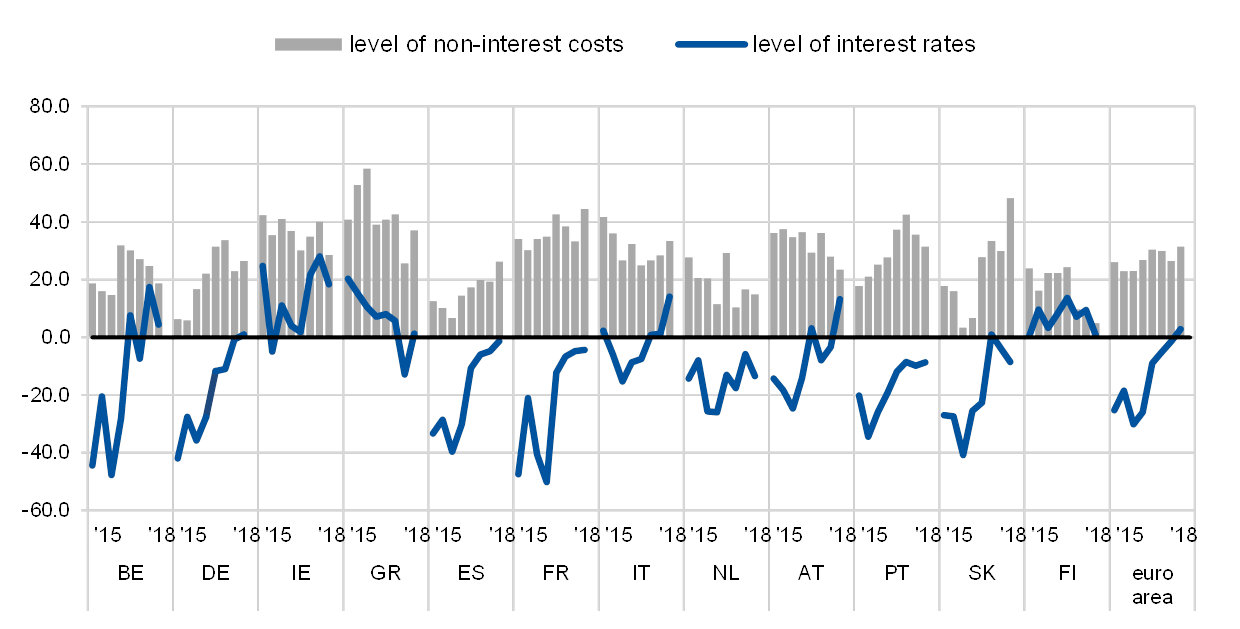
For the first time since 2014, a net percentage of SMEs reported rises in interest rates on bank loans, reaching 3% of SMEs (up from -1% in the previous round) (see Chart 21). SMEs also reported an increase in other costs of financing, such as charges, fees and commissions (31%, up from 26%). Other terms and conditions of bank loans were considered to have improved by a similar or somewhat higher net percentage of SMEs than in the previous round of the survey, including the available size of a loan or credit line (13%, from 11%), the available maturity (3%, from 2%), collateral requirements (12%, from 13%) and other requirements (16%, from 13%).
Change in terms and conditions of bank loans granted to euro area enterprises
(over the preceding six months; net percentages of enterprises that had applied for bank loans)
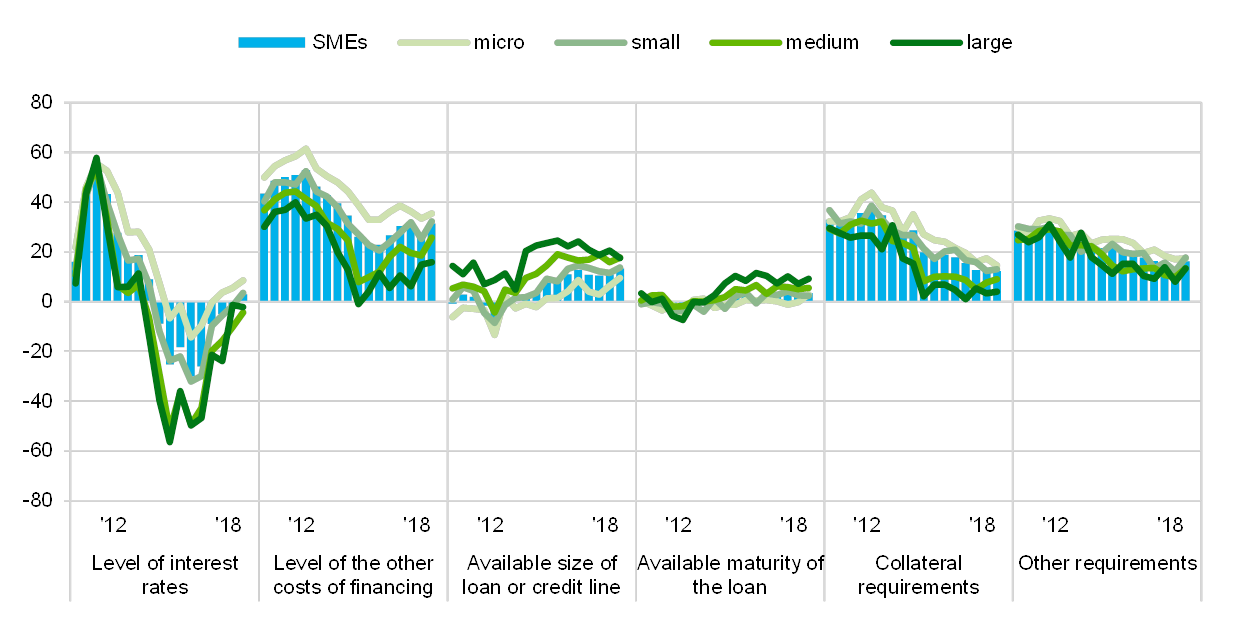
Base: Enterprises that had applied for bank loans (including subsidised bank loans), credit lines, or bank or credit card overdrafts. Figures refer to rounds three (March-September 2010) to nineteen (April-September 2018) of the survey.Note: See the notes to Chart 1.
Q10. Please indicate whether the following items increased, remained unchanged or decreased in the past six months.
Large enterprises still indicated a fall in interest rates, but increases in other costs of financing. A net percentage of large enterprises reported lower interest rates on loans granted to them (-2%, down from -1%). The corresponding figure for medium-sized firms was also negative (-4%). At the same time, a higher net share of large enterprises indicated rises in other costs of financing (16%, up from 15%), in the available maturity (9%, up from 7%), in collateral requirements (4%, up from 3%) and in other requirements (13%, up from 8%). In contrast to the experience of SMEs, fewer large enterprises reported an increase in the size of available loans or credit lines (17%, down from 21%).
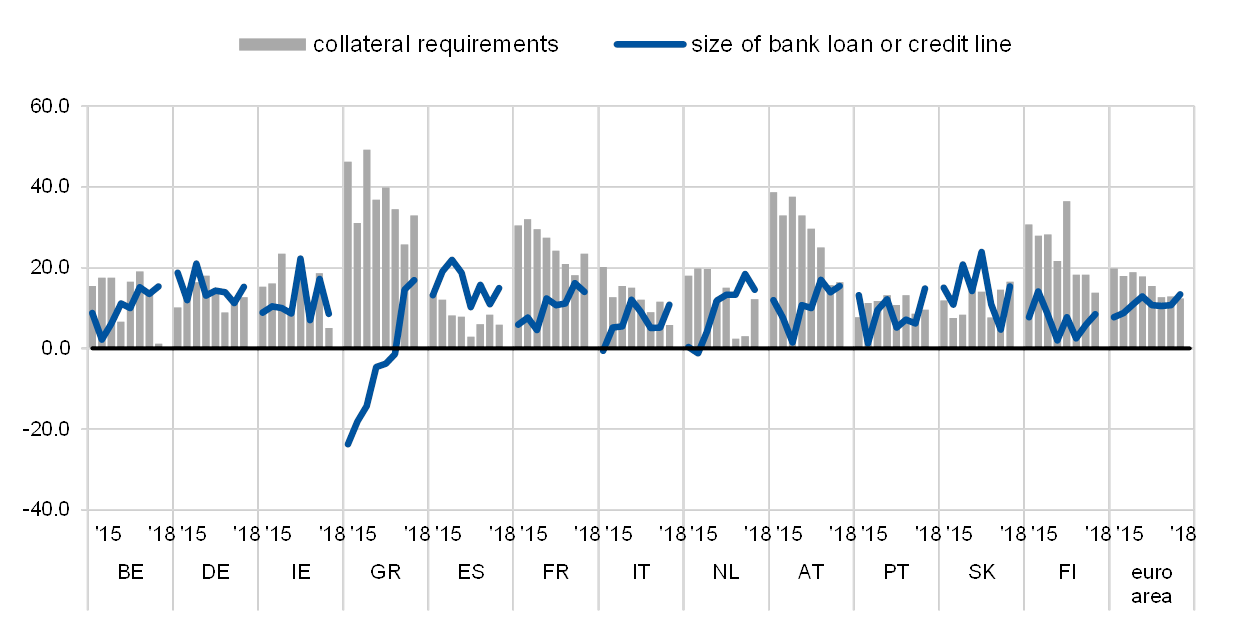
Developments in interest rates were mixed in the large euro area economies (see Chart 22). The net percentage of SMEs reporting increasing interest rates jumped notably in Italy (to 14% from 1%), while there was a small increase in the net percentage in Germany (to 1% from -1%). Changes were also modest in Spain (‑1%, from -5%) and France (-4%, from -5%). There were some signs of stronger growth in other cost of financing in all countries, but particularly in France (45%, up from 33%), which also had the highest net percentage of SMEs reporting increased collateral requirements (24%, from 18%).
Change in terms and conditions of bank loans granted to euro area SMEs
(over the preceding six months; net percentages of enterprises that had applied for bank loans)
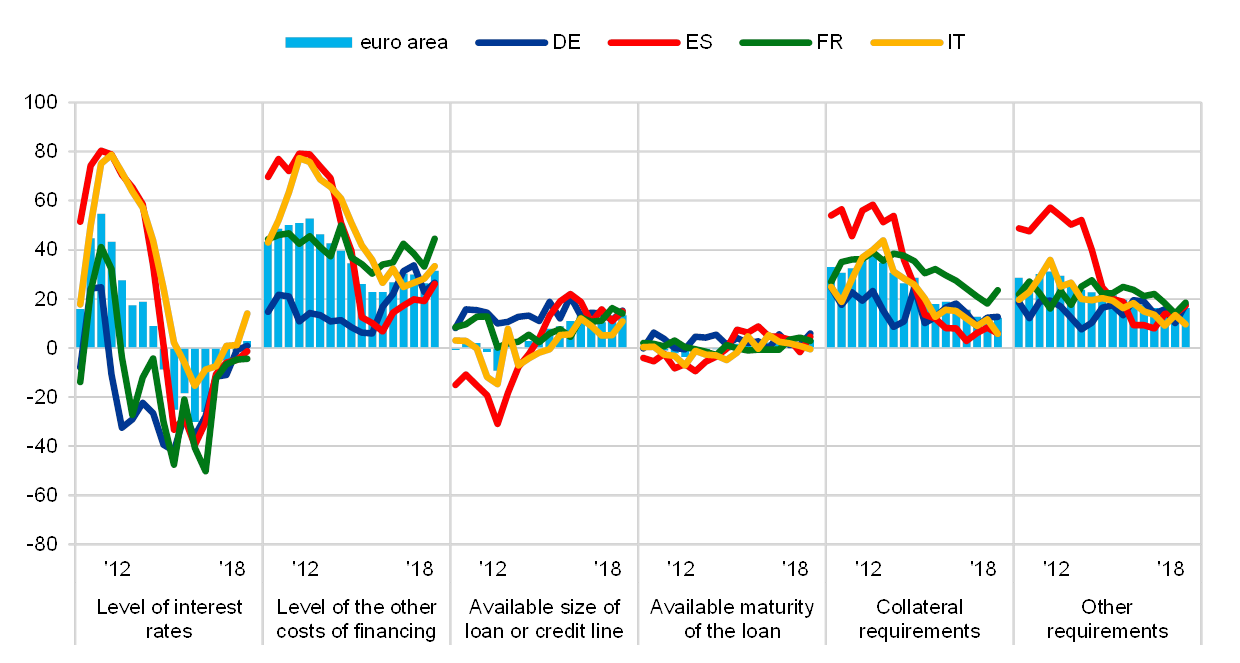
Base: SMEs that had applied for bank loans (including subsidised bank loans), credit lines, or bank or credit card overdrafts. Figures refer to rounds three (March-September 2010) to nineteen (April-September 2018) of the survey.Note: See the notes to Chart 1.
Q10. Please indicate whether the following items increased, remained unchanged or decreased in the past six months.
In the other euro area countries, a net percentage of SMEs in Ireland, Austria, Belgium, Finland and Greece reported higher interest rates, while the opposite held for the Netherlands, Portugal and Slovakia (see Chart 10a and Chart 11a in Annex 1). Concerning increases in other costs of financing (charges, fees and commissions), SMEs in most countries reported some moderation relative to the previous survey round, except in Greece, where the net percentage reporting increases rose to 37% (from 26%) and Slovakia (48%, up from 30%). As regards the size of bank loans, in most countries more SMEs reported increases than in the previous survey, except in Ireland and the Netherlands. SMEs also continued to report increases in the maturity of loans, but this was less marked in Ireland, the Netherlands, Greece, Portugal and Austria. Increased collateral requirements were reported most strongly in the Netherlands and Greece.
Interest rates charged by banks on credit lines and overdrafts to SMEs declined slightly in the recent survey (see Chart 23).[13] The median interest rate for SMEs dropped to 2.1% from 2.3%. By contrast, interest rates for large enterprises, unchanged at 1.2%, remain considerably below the borrowing costs for all types of SMEs, in particular when compared to micro firms (4%, unchanged).
Interest rate charged for a credit line or bank overdraft to euro area enterprises
(percentages)
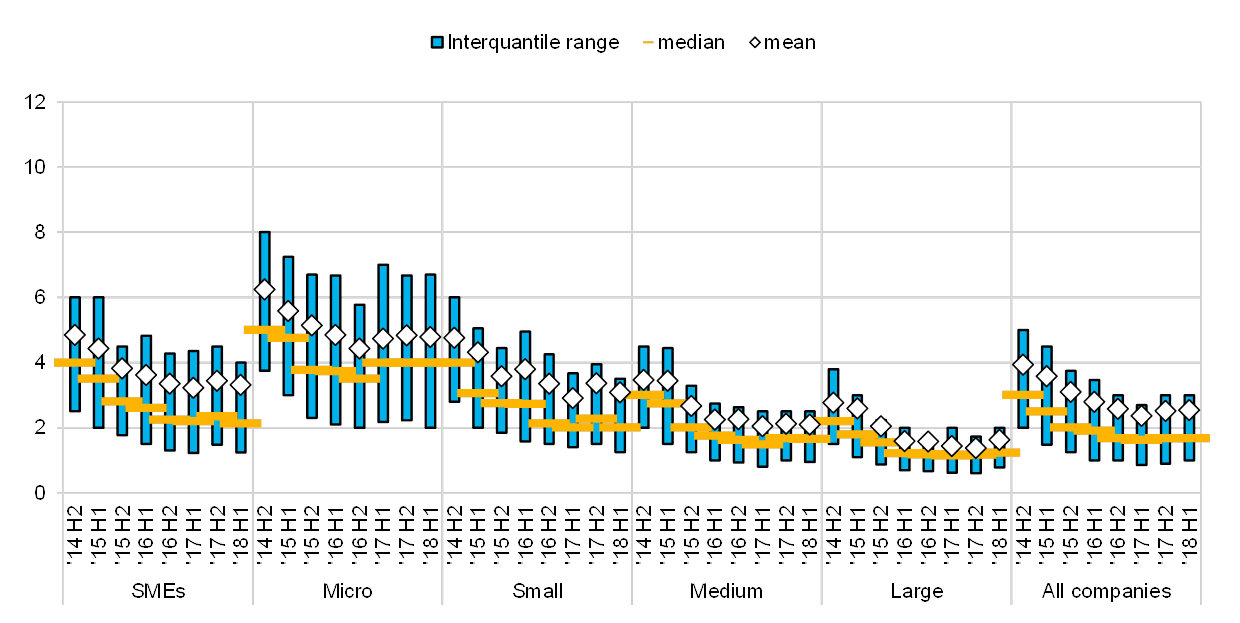
Base: Enterprises that had successfully applied for a credit line or bank overdraft or that did not apply because the cost was too high. Figures refer to rounds twelve (October 2014-March 2015) to nineteen (April-September 2018) of the survey. Notes: The interquartile range is defined as the difference between the 75th percentile and the 25th percentile. The figures are based on the new question introduced in round eleven (April-September 2014).
Q8B. What interest rate was charged for the credit line or bank overdraft for which you applied?
A decline in the interest rate of bank overdrafts and credit lines was recorded in most large euro area countries except France, where the reported median rates rose from 1.2% to 1.5% (see Chart 24).
Interest rate charged for a credit line or bank overdraft to euro area SMEs
(percentages)
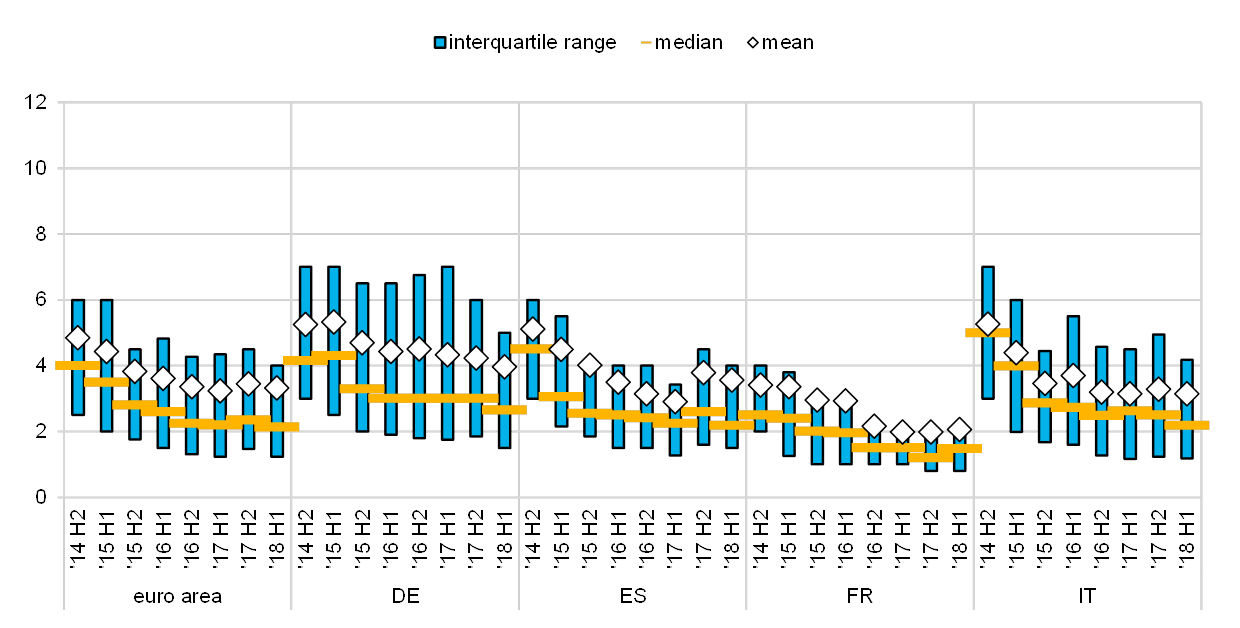
Base: SMEs that had successfully applied for a credit line or bank overdraft or that did not apply because the cost was too high. Figures refer to rounds twelve (October 2014-March 2015) to nineteen (April-September 2018) of the survey.Notes: The interquartile range is defined as the difference between the 75th percentile and the 25th percentile. The figures are based on the new question introduced in round eleven (April-September 2014).
Q8B. What interest rate was charged for the credit line or bank overdraft for which you applied?
About 47% of SMEs interviewed indicated that bank loans are not a relevant source of finance for them. In the great majority of these cases, the SMEs had no need for financing via a bank loan (76%; see Chart 25). An unchanged small percentage pointed to high interest rates or price as the primary reason for not using bank loans (7%). While in Slovakia (20%, up from 9%) and Portugal (20%, up from 15%), this percentage has risen strongly since the last round, followed by Ireland (5%, up from 2%), it was still declining in some of the remaining countries. In addition, a lack of available bank loans is also a notable factor for Greek SMEs (13%, up from 19%).
Reasons why bank loans are not a relevant source of financing for euro area SMEs
(over the preceding six months; percentages of respondents)

Base: SMEs for which bank loans are not a relevant source of financing. Figures refer to rounds twelve (October 2014-March 2015) to nineteen (April-September 2018) of the survey.Note: The figures are based on the new question introduced in round eleven (April-September 2014).
Q32. You mentioned that bank loans are not relevant for your enterprise. What is the main reason for this?
5 Expectations regarding access to finance
5.1 Expectations of SMEs about further improvements in access to external financing stay comparatively robust
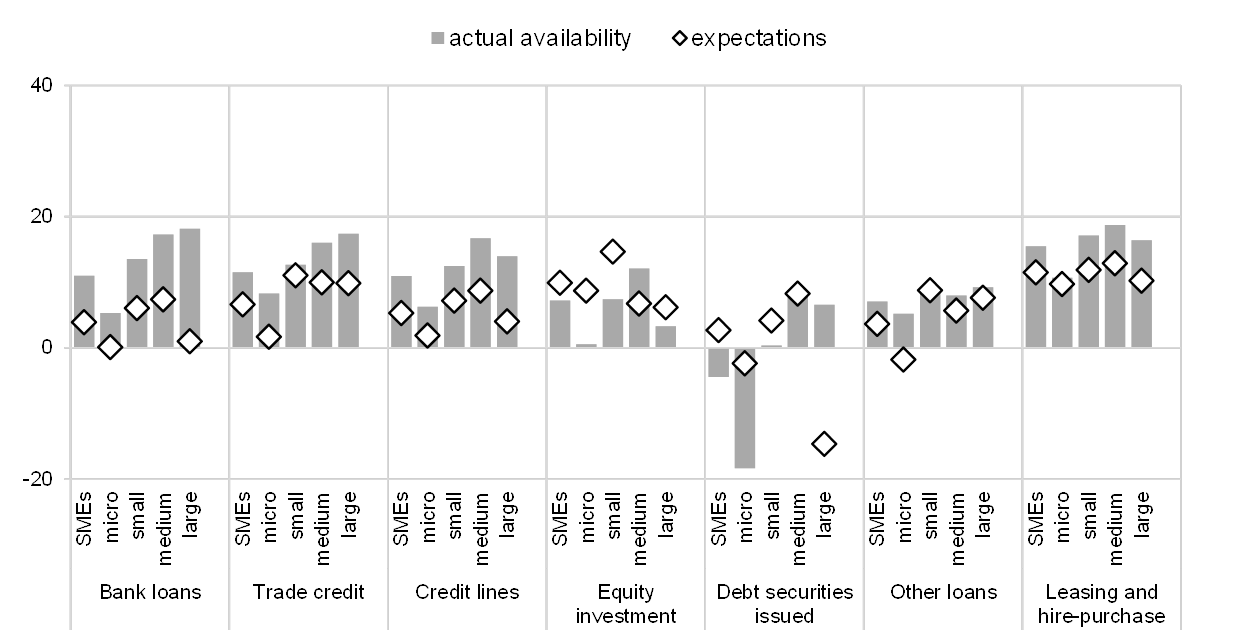
For the period from October 2018 to March 2019, SMEs are expecting improvements in the availability of external financing sources, but at a more moderate pace than in previous survey rounds (see Chart 26). Specifically, a net 4% of SMEs anticipate better access to bank loans (the most important source of external financing for SMEs), which is much lower than the net 11% that actually reported better access in the period from April to September 2018. Expectations are similar for access to most other external funding instruments, including trade credit (7% expected, against 12% realised), credit lines (5% against 11%), other loans (4% against 7%) and leasing and hire-purchase (11% against 16%). Though this round of the survey found a robust resizing of the availability of debt securities issued by SMEs (-4%), expectations remain on the positive side (3%). However, these figures need to be treated with some caution as the percentage of firms answering this question in the survey remains extremely low (only 2.9% of all SMEs considered this financing source potentially relevant).
Change in euro area enterprises’ expectations regarding the availability of financing
(over the preceding six months; net percentages of respondents)
Base: Enterprises for which the respective instrument is relevant. Figures refer to round nineteen (April-September 2018) of the survey.Note: See the notes to Chart 1 and Chart 11.
Q9. For each of the following types of financing, would you say that their availability has improved, remained unchanged or deteriorated for your enterprise over the past six months?Q23. Looking ahead, for each of the following types of financing available to your enterprise, please indicate whether you think their availability will improve, deteriorate or remain unchanged over the next six months.
Across different company sizes, the expectations of micro enterprises appeared the least optimistic, extending to all categories of external financing. In particular, micro firms seem to be considerably less sanguine than larger companies about the outlook for bank loans (with a net 0% of micro firms expecting improvements, against a net 5% reporting actual improvements in the current round) and trade credit (2% against 8%). Large enterprises, which appear to have benefited most so far from improvements in external financing, were also relatively cautious about further improvements. The net percentage of large firms expecting improvements was generally much lower than the net percentage of those reporting actual improvements for bank loans (1% against 18%), trade credit (10% against 17%) and other forms of external finance. This was also the case for debt securities (7% against -15%), although these results should be treated with great caution given that very few firms answered the question.
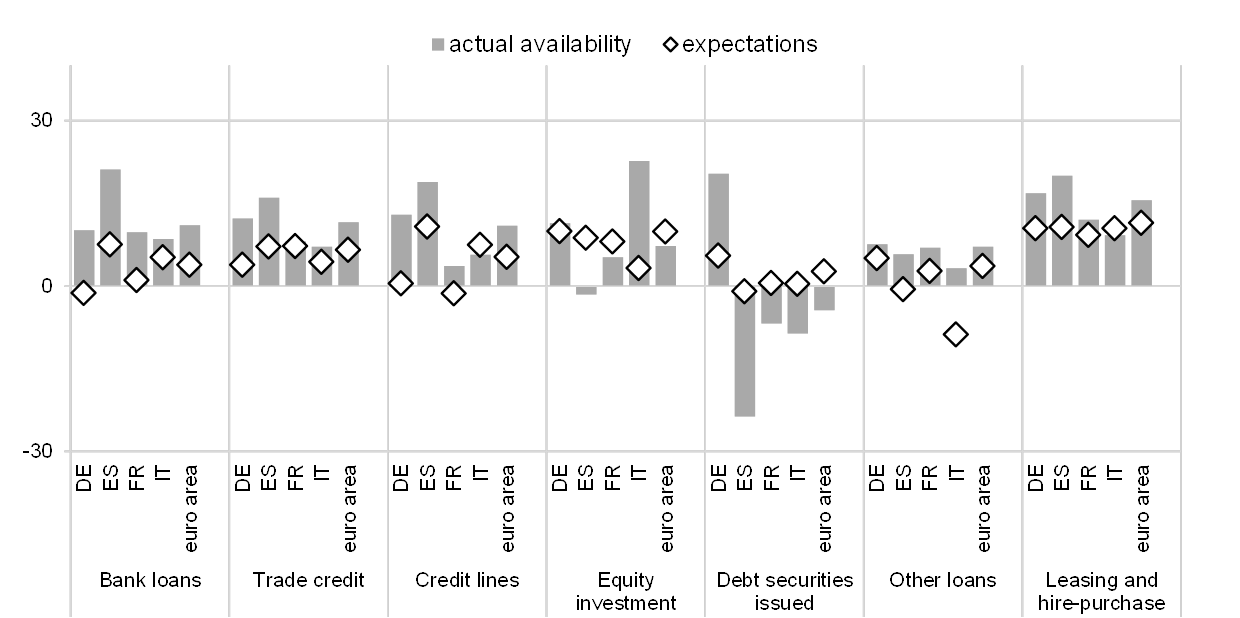
The decline in expectations about further improvements in access to external financing was widespread across the largest euro area countries (see Chart 27). On balance, German SMEs expect a reduction in the availability of bank loans in the next six months (-1% against 10% reporting increased actual availability), while SMEs in other countries are still expecting future increases, but with reduced optimism (see Chart 27).
Change in euro area SMEs’ expectations regarding the availability of financing
(over the preceding six months; net percentages of respondents)
Base: SMEs for which the respective instrument is relevant. Figures refer to round nineteen (April-September 2018) of the survey.Note: See the notes to Chart 1 and Chart 11.
Q9. For each of the following types of financing, would you say that their availability has improved, remained unchanged or deteriorated for your enterprise over the past six months?Q23. Looking ahead, for each of the following types of financing available to your enterprise, please indicate whether you think their availability will improve, deteriorate or remain unchanged over the next six months.
Annexes
Annex 1Overview of the survey replies – selected charts
Change in turnover and profits of SMEs across euro area countries
(over the preceding six months; net percentages of respondents)
Base: All SMEs. Figures refer to rounds twelve (October 2014-March 2015) to nineteen (April-September 2018) of the survey.Note: See the notes to Chart 1.
Q2. Have the following company indicators decreased, remained unchanged or increased over the past six months?
Change in debt-to-total-assets ratio and interest expenses of SMEs across euro area countries
(over the preceding six months; net percentages of respondents)
Base: All SMEs. Figures refer to rounds twelve (October 2014-March 2015) to nineteen (April-September 2018) of the survey.Note: See the notes to Chart 1.
Q2. Have the following company indicators decreased, remained unchanged or increased over the past six months?
Vulnerable and profitable SMEs across euro area countries
(over the preceding six months; percentages of respondents)
Base: All SMEs. Figures refer to rounds three (March-September 2010) to nineteen (April-September 2018) of the survey.Notes: For definitions, see footnote 8 of the report. In Slovakia, the survey was initially conducted every two years (H1 2009, H1 2011 and H1 2013). From 2014 onwards, Slovakia has been included in the sample in each survey round.
Q2. Have the following company indicators decreased, remained unchanged or increased over the past six months?
The most important problems faced by euro area SMEs across euro area countries
(over the preceding six months; percentages of respondents)
Base: All SMEs. Figures refer to rounds twelve (October 2014-March 2015) to nineteen (April-September 2018) of the survey.Note: See the notes to Chart 5.
Q0. How important have the following problems been for your enterprise in the past six months?
Change in the availability of and need for bank loans for SMEs across euro area countries
(over the preceding six months; net percentages of respondents)
Base: SMEs for which the respective instrument is relevant. Figures refer to rounds twelve (October 2014-March 2015) to nineteen (April-September 2018) of the survey.Note: See the notes to Chart 1 and Chart 11.
Q5. For each of the following types of external financing, please indicate if your needs increased, remained unchanged or decreased over the past six months.Q9. For each of the following types of financing, would you say that their availability has improved, remained unchanged or deteriorated for your enterprise over the past six months?
Change in the external financing gap perceived by SMEs across euro area countries
(over the preceding six months; weighted net balances)
Base: SMEs for which the respective instrument is relevant. “Not applicable” and “Don’t know” answers are excluded. Figures refer to rounds twelve (October 2014-March 2015) to nineteen (April-September 2018) of the survey.Notes: See notes to Chart 17. The financing gap indicator combines both financing needs and availability of bank loans, credit lines, trade credit, equity and debt securities at firm level. For each of the five financing instruments, the indicator of the perceived change in the financing gap takes the value of 1 (-1) if the need increases (decreases) and availability decreases (increases). If enterprises perceive only a one-sided increase (decrease) in the financing gap, the variable is assigned a value of 0.5 (-0.5). The composite indicator is the weighted average of the financing gap related to the five instruments. A positive value of the indicator suggests an increasing financing gap. Values are multiplied by 100 to obtain weighted net balances in percentages.
Q5. For each of the following types of external financing, please indicate if your needs increased, remained unchanged or decreased over the past six months.Q9. For each of the following types of financing, would you say that their availability has improved, remained unchanged or deteriorated for your enterprise over the past six months?
Change in factors with an impact on the availability of external financing for SMEs across euro area countries
(over the preceding six months; net percentages of respondents)
Base: All SMEs. For the category “Willingness of banks to lend”, these are SMEs for which at least one bank financing instrument (credit line, bank overdraft, credit card overdraft, bank loan, subsidised bank loan) is relevant. Figures refer to rounds twelve (October 2014-March 2015) to nineteen (April-September 2018) of the survey.Notes: See the notes to Chart 1 and Chart 18. From round eleven (April-September 2014), the category “Willingness of banks to provide a loan” was reformulated slightly to “Willingness of banks to provide credit to your enterprise”.
Q11. For each of the following factors, would you say that they have improved, remained unchanged or deteriorated over the past six months?
Applications for bank loans by SMEs across euro area countries
(over the preceding six months; percentages of respondents)
Base: SMEs for which bank loans (including subsided bank loans) are relevant. Figures refer to rounds twelve (October 2014-March 2015) to nineteen (April-September 2018) of the survey.Note: See the notes to Chart 11.
Q7A. Have you applied for the following types of financing in the past six months?
Outcome of applications for bank loans by SMEs across euro area countries
(over the preceding six months; percentages of respondents)
Base: SMEs that had applied for bank loans (including subsided bank loans). Figures refer to rounds twelve (October 2014-March 2015) to nineteen (April-September 2018) of the survey.Note: See the notes to Chart 11.
Q7B. If you applied and tried to negotiate for this type of financing over the past six months, what was the outcome?
Change in the cost of bank loans granted to SMEs across euro area countries
(over the preceding six months; net percentages of enterprises that had applied for bank loans)
Base: SMEs that had applied for bank loans (including subsidised bank loans), credit lines, or bank or credit card overdrafts. Figures refer to rounds twelve (October 2014-March 2015) to nineteen (April-September 2018) of the survey.Note: See the notes to Chart 1.
Q10. Please indicate whether the following items increased, remained unchanged or decreased in the past six months.
Change in non-price terms and conditions of bank loans granted to SMEs across euro area countries
(over the preceding six months; net percentages of enterprises that had applied for bank loans)
Base: SMEs that had applied for bank loans (including subsidised bank loans), credit lines, or bank or credit card overdrafts. Figures refer to rounds twelve (October 2014-March 2015) to nineteen (April-September 2018) of the survey.Note: See the notes to Chart 1.
Q10. Please indicate whether the following items increased, remained unchanged or decreased in the past six months.
Annex 2Descriptive statistics for the sample of enterprises
Breakdown of enterprises across economic activities
(unweighted percentages)

Base: Figures refer to round nineteen (April-September 2018) of the survey.
Breakdown of enterprises by age of the firm
(unweighted percentages)
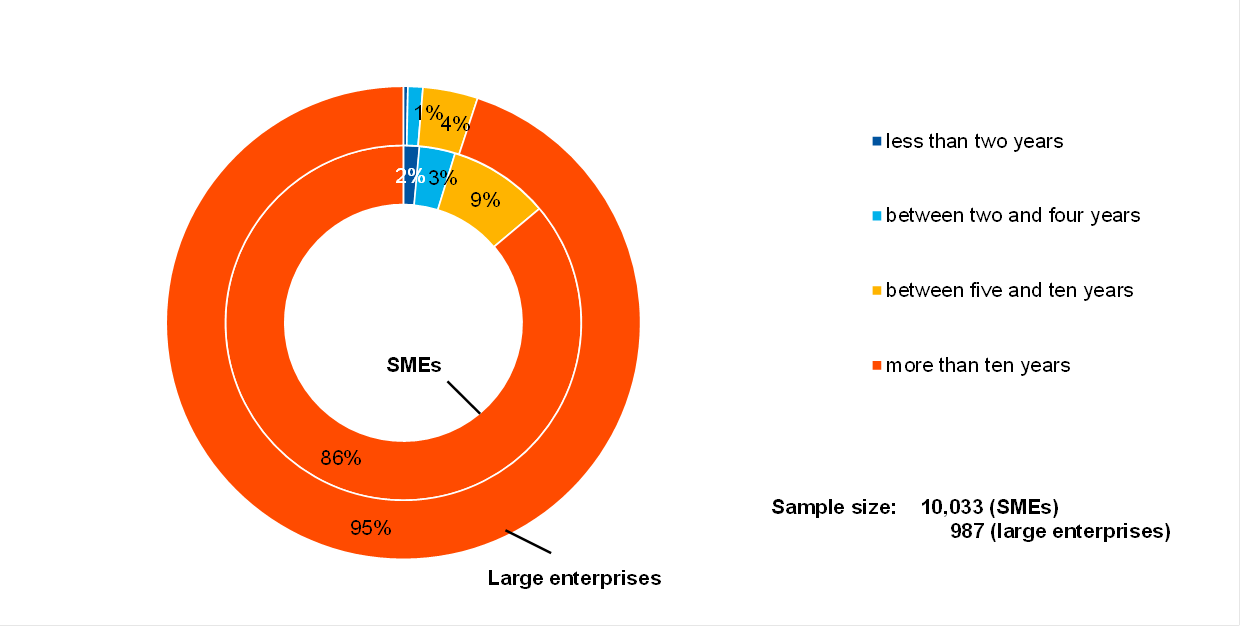
Base: Figures refer to round nineteen (April-September 2018) of the survey.
Breakdown of enterprises according to ownership
(unweighted percentages)
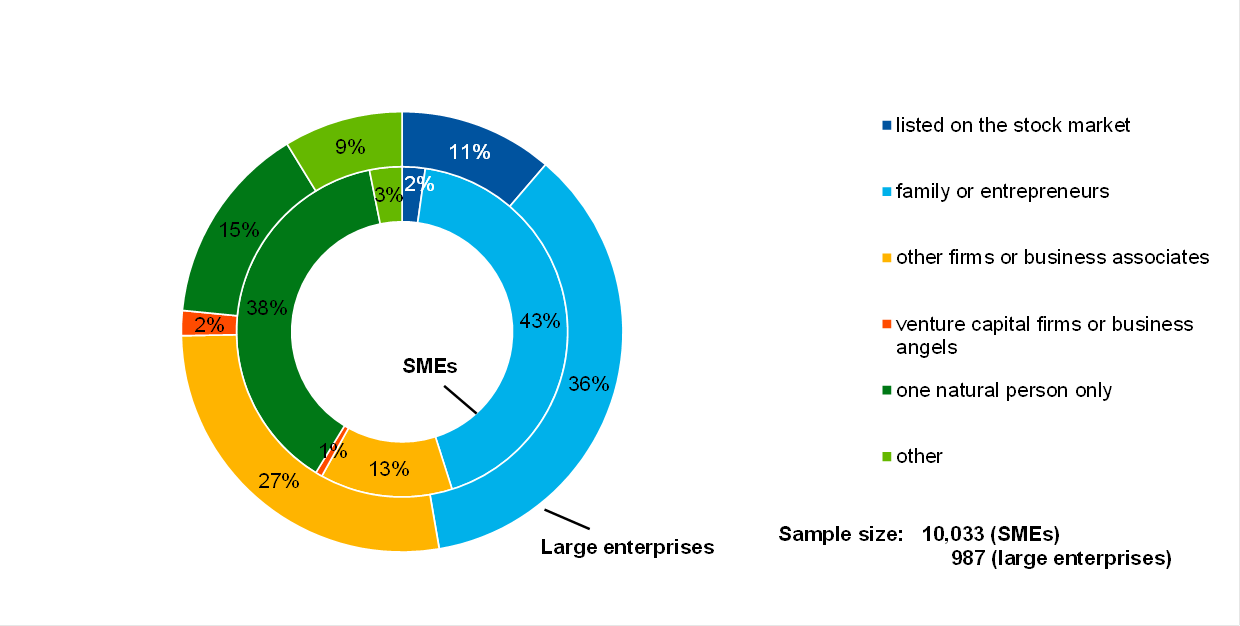
Base: Figures refer to round nineteen (April-September 2018) of the survey.
Breakdown of enterprises according to exports
(unweighted percentages)
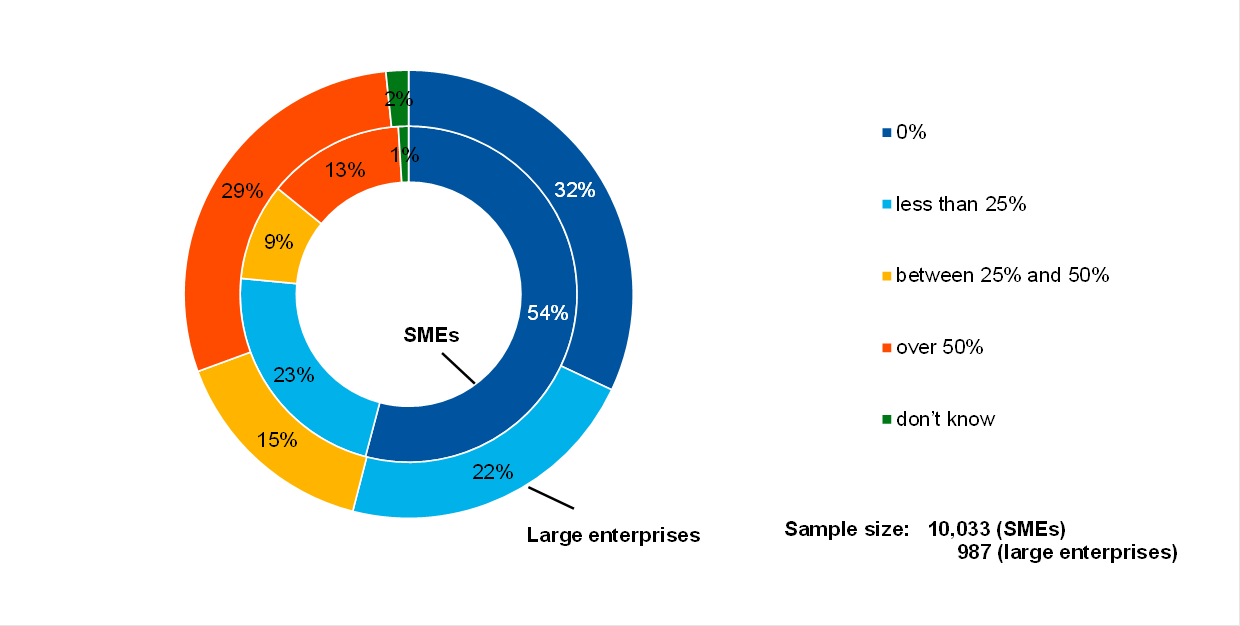
Base: Figures refer to round nineteen (April-September 2018) of the survey.
Annex 3Methodological information on the survey
This annex presents the main changes introduced in the latest round of the Survey on the Access to Finance of Enterprises (SAFE). For an overview of how the survey was set up, the general characteristics of the euro area enterprises that participated in the survey and the changes introduced to the methodology and the questionnaire over time, see the “Methodological information on the survey and user guide for the anonymised micro dataset” available on the ECB’s website.[14]
Since September 2014 the survey has been carried out by Panteia b.v. in cooperation with the fieldwork provider GDCC. To the best of our knowledge, no breaks in the series are attributable to any change of provider over the life cycle of the survey.
However, some changes in the questionnaire may have caused a break between the round covering the second half of 2013 and that covering the first half of 2014. This stems from the review of various components of the survey after ten survey rounds, covering the questionnaire, sample allocation, survey mode and weighting scheme (see Annex 4 in the corresponding report on the ECB’s website for details[15]).
With regard to the weighting scheme, up to the H1 2015 round, the calibration targets were updated with each survey round based on the latest available figures from Eurostat’s structural business statistics (SBS). Since then, with all the euro area countries participating in the survey, the weighting scheme has been updated once a year.[16]
In this survey round no major changes were made to the existing questions in the questionnaire.[17]
© European Central Bank, 2018
Postal address 60640 Frankfurt am Main, GermanyTelephone +49 69 1344 0Website www.ecb.europa.eu
All rights reserved. Reproduction for educational and non-commercial purposes is permitted provided that the source is acknowledged.The cut-off date for data included in this report was 27 November 2018.
PDF ISSN 1831-9998, QB-AP-18-003-EN-NHTML ISSN 1831-9998, QB-AP-18-003-EN-Q
- [1]See Annex 3 for details on methodological issues related to the survey set-up.
- [2]Net terms or net percentages are defined as the difference between the percentage of enterprises reporting that a given factor has increased and the percentage of those reporting that it has declined.
- [3]A negative financing gap indicates that the increase in the need for external financing is smaller than the improvement in the access to external funds.
- [4]The financing obstacles indicator is the sum of the percentages of SMEs reporting rejections of loan applications, loan applications for which only a limited amount was granted, and loan applications which resulted in an offer that was declined by the SME because the borrowing costs were too high, as well as the percentage of SMEs that did not apply for a loan for fear of rejection.
- [5]Net terms or net percentages are defined as the difference between the percentage of enterprises reporting that a given factor had increased and the percentage reporting that it had declined.
- [6]Micro enterprises are enterprises with 1-9 employees, small enterprises are those with 10-49 employees, medium-sized enterprises have 50-249 employees and large enterprises have 250 or more employees. The term “small and medium-sized enterprises” (SMEs) covers micro, small and medium-sized enterprises.
- [7]The reference period for the previous survey round was October 2017 to March 2018.
- [8]See the box entitled “Distressed and profitable firms: two new indicators on the financial position of enterprises”, Survey on the Access to Finance of Enterprises in the euro area – October 2017 to March 2018. Vulnerable firms are defined as those firms that have simultaneously reported lower turnover, decreasing profits, higher interest expenses and higher or unchanged debt-to-total assets. At the other end of the spectrum, profitable firms are those that simultaneously report higher turnover and profits, lower or no interest expenses and lower or no debt-to-total assets.
- [9]The formulation of the question allows the relevance of a specific financial instrument to be disentangled from its usage. See the SAFE questionnaire.
- [10]Vulnerable firms are defined as those firms that have simultaneously reported lower turnover, decreasing profits, higher interest expenses and a higher or unchanged debt-to-assets ratio. At the other end of the spectrum, profitable firms are those that simultaneously report higher turnover and profits, lower or no interest expenses and lower or no debt-to-assets ratio (see Section 2.1.)
- [11]See the note to Chart 11. Only survey respondents who report that a particular financing instrument is relevant for their enterprise are asked about their need for that source of financing.
- [12]See the notes to Chart 11. Only survey respondents that report that a particular financing instrument (i.e. bank loans, credit lines, trade credit, leasing and hire-purchase or other loans) is relevant for their enterprise are asked about the availability of these sources of financing.
- [13]From round eleven (April-September 2014), the question regarding the interest rate of the credit line or bank overdraft was added to the questionnaire. The weighted mean reported by euro area enterprises is around 27 basis points higher than the official monetary financial institutions’ interest rate statistics on bank overdrafts (average in the period from April to September 2018), while the median value is about 60 basis points lower. Some caveats apply when comparing the figures quoted in this report with the official bank interest rate statistics: (i) the bank statistics are weighted by the loan volumes, while the survey responses are weighted by the number of employees; and (ii) the bank statistics refer to the full financing granted in the period, while the survey includes all enterprises that had successfully applied for the credit line or bank overdraft or did not apply because the cost was too high.
- [14]“Survey on the access to finance of enterprises – Methodological information on the survey and user guide for the anonymised micro dataset”.
- [15]“Survey on the Access to Finance of Enterprises in the euro area – April 2014 to September 2014”.
- [16]For more details, see the section on weighting in “Survey on the access to finance of enterprises – Methodological information on the survey and user guide for the anonymised micro dataset”.
- [17]The questionnaire is available on the ECB’s website. It was translated into the respective languages for the purposes of the survey.
-
28 November 2018