
Ladies and Gentlemen [1],
I would like to thank the IMF for inviting me to this excellent workshop and to be part of such a distinguished panel.
I. Introduction
Almost 50 years ago Milton Friedman famously described the Phillips curve as a "will-o-the-wisp". When he first used this metaphor, he was isolated in the macroeconomist community. But in a matter of few years – and after a few bad inflation surprises that were hard to square with the solid and steady Phillips curve formalism that was embedded in many models of the time – his vision became less alien. Many of his colleagues started to admit that the Phillips curve was an extraordinarily frail platform for central banks to base monetary reflation experiments on.
Indeed, at that point, Friedman had been joined by the so-called Neo-Classicals to demonstrate that what might appear as a steady association between price pressures and economic slack could in fact represent a collection of disequilibrium points which could only be maintained by monetary policy perpetuating the disequilibrium through ever-more aggressive expansion. Arthur Okun, one of the founding fathers of post-war stabilisation theories, was more cutting in his assessment. On observing a scatterplot of Phillips curve observations over the stagflation decade of 1970-1980 – which defied theory as it showed a positive (not a negative) correlation between inflation and unemployment – he remarked that the curve resembled "an unidentified flying object."
I think it is safe to say that few economists at that time, at either end of the macro-theory spectrum, could have imagined that a destabilisation of the Phillips curve could occur, symmetrically, in both directions – that is, on a sustained decelerating as well as accelerating path. That today a no less influential observer and global policy actor than the IMF itself entertains this possibility makes it sufficiently important for us central bankers to consider. Therefore, I am grateful for this opportunity to clarify my own thinking on this topic, particularly in the context of the euro area.
Is sustained disinflation indeed a realistic possibility? I believe it is not – that is, unless at least one of the following three conditions holds:
the structural connection between inflation and unemployment vanishes, with the Phillips curve interpreted as the aggregate supply condition in the spirit of the New Keynesians. This would imply that inflation becomes unreactive to economic slack;
the financial transmission channel remains blocked, and at the zero lower bound monetary policy cannot maintain sufficient traction on real activity. In the context of the Phillips curve, the measure of economic slack becomes uncontrollable;
macroeconomic policymakers lose their commitment to their stabilisation mandates and renounce control over demand conditions. Consequently, inflation is left to move freely in the Phillips curve space, being driven only by pure sunspots.
To bring forward my conclusions, I do not see evidence to support the first two conditions in the euro area. In terms of (1), the inflation/unemployment connection remains intact – in fact, it has probably strengthened precisely in those economies where labour market slack has exerted a disproportionate influence on the weak euro area-wide inflation trends.
As for (2), the financial transmission channel has largely been restored. In the wake of the sovereign crisis, frictions in financial intermediation had increased on account of heightened risk aversion and driven a large wedge between the risk-free interest rate and the cost at which private borrowers could borrow. Credit standards tightened despite the ECB's policy orientation to loosen its stance. Over the last year, however, these wedges have largely disappeared and financing conditions have fallen in line with our policy intentions.
Turning to (3), there is certainly no lack of commitment on the part of the ECB. I believe that the ECB has demonstrated the necessary awareness when confronted with a downward shift in realised and anticipated inflation. Furthermore, it acted with the requisite force to address those concerns and to leave no doubt about its commitment to delivering price stability. Other economic policy makers, however, now need to meet the challenge with the same degree of determination. In particular, they should view the current loose credit conditions as a historical opportunity to launch policy initiatives that would be far more difficult to enact in a less supportive environment.
Let me elaborate on these thoughts in some more detail.
II. A flat Phillips curve
A key enabling condition for sustained disinflation is the presence of a totally flat Phillips curve. On first reading, this concept may sound somewhat counterintuitive. After all, a vast literature has adduced that a flat Phillips curve is proof that central banks have been, and will continue to be, successful at both macroeconomic and inflation stabilisation. Indeed, John Roberts has argued this point particularly forcefully and cites the influence of the Federal Reserve’s stabilisation policies on US inflation dynamics. [2]
But a negatively sloped Phillips curve – in the inflation/unemployment space – is a precondition for central banks to exercise monetary control in the first place. When the slope of the Phillips curve approaches zero, the inflation process becomes impervious to monetary policy interventions. The NAIRU which divides regimes of accelerating inflation from decelerating inflation loses significance. In other words, any level of unused capacity becomes consistent with any rate of inflation and the inflation target ceases to exert its gravitational pull on inflation expectations.
Indeed, why should expectations gravitate around the central bank’s target if the central bank itself cannot correct an inflation deviation by steering the level of economic slack to the appropriate level and, thereby, bring inflation back to target? As inflation expectations set the intercept that determines the height of the Philips curve in the inflation/unemployment space, in this hypothetical case, nothing can prevent the curve from sinking in an uncontrolled way. While it is a matter of dispute whether and where that sinking process would end, it would certainly pull inflation away from levels that are consistent with central banks' mandates and with macroeconomic stability.
Let me make an incidental remark here. The major historical episode of unanchored inflation expectations, at the start of the 1970s, which ultimately opened the door to a decade characterised by bouts of double-digit inflation, occurred precisely at a time when the Phillips curve was thought to have become flat and policymakers saw wage and price-setting as having become insensitive to economic slack. This perspective, which contrasted sharply with Milton Friedman's famous dictum that "inflation is always and everywhere a monetary phenomenon", led the Fed and other central banks to lend their support to measures such as wage and price controls rather than monetary solutions to address inflation. [3]
My own view is that I do not see signs of a disconnection between inflation and unemployment in the data for the euro area. There are three observations that lead me to this position.
First, various estimates of the euro area Phillips curve slope show that while the slope has varied over time, in recent years it has steepened (see Chart 1). There is no agreed upon functional form of the Phillips curve, and our confidence that estimates using clouds of points in an inflation/economic slack space can capture the structural elasticity attached to slack in the conceptual Phillips curve, is indeed quite limited. Nonetheless, using different measures of unused capacity to at least hedge against mis-specification risks, we obtain estimates which all indicate that there has been an increased responsiveness of inflation to economic slack in recent years.
If I interpret this evidence in a deep parametric way, I tentatively conclude that the slope of the Phillips curve is currently around 0.2. This implies that a 1 percentage point increase in economic slack would, on average, lower inflation excluding food and energy by about 0.2 of a percentage point. And in fact, this relationship measurably increases if one adjusts the headline rate of unemployment for those who have become detached from the labour market for a long time, and who are likely to exert only a mild amount of downward pressure on wage and price formation. [4] Robert Gordon documents a similar result for the US. [5]
As I mentioned above, there is some evidence that the Phillips curve has steepened in particular in some of the so-called euro area periphery countries, where lawmakers have actively reformed local labour market institutions and deficient demand has promoted a protracted period of wage moderation.
There are of course many caveats to interpreting this data: lining up a time sequence of dots in the inflation/unemployment or wage growth/unemployment space and using the slope of that line to draw conclusions for the Phillips curve elasticity is hazardous. Through time, an economy could be moving along a steady Phillips curve, or Phillips curve could be shifting in the space. And the shift could be due to a host of factors: a revision in inflation expectations for example, or a permanent or temporary change in wage and inflation mark-ups.
Incidentally, this latter factor – a temporary reallocation of wage negotiating power between employers and job-seekers – appears to be particularly relevant once the recovery has moved beyond its initial phase. Evidence suggests that the relationship between inflation and labour market slack can be weakened not only during a recession but also in the early phase of a recovery. While the decline in euro area wage growth during the recession was limited due to downward nominal wage rigidities, in the early phase of the recovery wage growth may remain subdued as a result of “pent-up wage restraint”. In other words, the wage adjustment which did not occur during the recession may cause employers to initially curtail wage increases as they do not see a need to attract suitably qualified employees by wage incentives. However, once this pent-up wage restraint has been absorbed, wages should begin to rise at a more rapid pace.
Discriminating across such null hypotheses is hard. But with these caveats in mind, a study by Banca d’Italia finds, for example, that the Phillips curve has undergone a structural break in both Spain and Italy, and for two reasons. First, nominal price rigidities have declined, possibly on account of the impact of structural reforms. Again, this result can be interpreted in a variety of ways, including the idea that a temporary destabilisation of inflation expectations at some point started to influence wage contracts and produced a parallel drift in the curve.
The second factor is a higher elasticity of consumer prices to the output gap. The underlying reason mentioned in the study is changes in the price setting behaviour of firms. This reflects the lower number of firms in the market in the aftermath of the deep recession and the reduction in strategic complementarities in price setting that this leaner retail sector brings about. This latter factor indeed comes very close to a New Keynesian type interpretation of the higher sensitivity of inflation to the underlying economic conditions, where different degrees of strategic complementarities in price setting can indeed be viewed as influencing the coefficient attached to slack (or, rather, the marginal cost of production) in the Phillips curve condition. This evidence could tentatively support the contention that what is observed in the data is indeed a structural shift. [6]
It is important to remember that a steep(er) Phillips curve is a curse for inflation stability on the way down, when cyclical unemployment is on the rise. But it is a blessing when unemployment is being re-absorbed, as the revival in business activity places more intense upward pressures on prices and thus helps nudge inflation back toward its target level more rapidly.
The second reason why I do not see signs of a disconnection between inflation and unemployment in the euro area is that – echoing a point also raised by Robert Gordon – the inflation process is occasionally subject to short-term spells of inertial drift, when supply side shocks hit repeatedly and cause serial downward inflation surprises. Five years ago this phenomenon was invoked to explain the "missing deflation" in the post-Lehman world of mass worker dismissals, when realised inflation turned out consistently higher and stickier than forward looking macro models were predicting on the basis of the observed levels of unused capacity. Today, the delayed adjustment of the same inertial process is probably producing a symmetric case of "missing reflation". In other words, a sequence of negative commodity price surprises may be dampening the reflationary effect of the economic recovery.
Still, the possibility that inflation may occasionally be driven by spells of backward-looking dynamics does not mean that downward drifts – in both observed and expected inflation – should necessarily be looked through by the monetary authorities, as self-correcting and hence policy irrelevant. In fact, I will advocate the opposite view later when I turn to the role of monetary policy. What I want to say here is the following: provided the appropriate policy response has been put in place to ward off serious risks of nominal de-anchoring, any outbreak of adaptive expectations will be transient. When the adaptive expectation rule of both households and firms starts to perform badly in the face of strengthening business conditions, they will switch back to expecting price stability in line with central banks' numerical mandates.
The third factor behind my assertion is that the flow of incoming survey data indicates a turnaround in inflationary pressures in line with the cyclical upturn, as evidenced for example by the latest PMI data. Both output and input prices as well as European Commission survey data on selling prices have rebounded since the turn of the year. Looking ahead, the weaker euro exchange rate as well as the continued closing of the output gap will be key drivers in supporting the upward inflationary trajectory for euro area inflation back towards our aim of below but close to 2%.
III. Re-integration of financial transmission
Another possible condition for a situation of sustained disinflation is that monetary policy losses traction over the economy in the presence of disrupted transmission mechanisms. In the euro area our monetary policy response has indeed focused on two tracks: engineering an appropriately expansionary stance, while simultaneously repairing the monetary policy transmission mechanism so that this stance reaches euro area firms and households.
The first track has seen us progressively cut rates, resulting in the ECB being one of only a handful of central banks whose short-term rates have gone into negative territory. The power that negative rates have had in propagating our policy stimulus has been striking, for two reasons.
First, because a negative interest rate policy can to a certain extent be seen as a substitute for quantitative interventions. Bringing the overnight interest rate to a negative level already in June last year de facto meant that we started generating effects – again to a certain extent – that one expects to see under quantitative policies, eight months before we expanded our purchase programmes on a large scale. And second, because a negative interest rate policy is indeed a complement to a quantitative programme. Let me explain both points in some more detail.
When the short-term interest rate falls to zero, the yield curve tends to steepen. This phenomenon is a mechanical consequence of agents revising their interest rate expectations at the zero lower bound. Long-term interest rates are to a large extent driven by expectations of the future evolution of the short-term interest rate. If agents – looking forward – can only expect the short-term interest rate to rise in the future from a zero level, because they think zero is the lower bound, then the long-term interest rate will be determined on the basis of a probability distribution that is skewed toward positive numbers. This is what causes the term structure to steepen.
Now, if agents can be convinced that the lower bound for the short-term interest rate is not zero but can be made negative, then this problem is likely to become less severe. In fact, over the summer and the autumn we have seen our long-term interest rates starting to react to our negative interest rate policy in much the same direction as long-term interest rates have reacted to QE in other countries and, subsequently, in the euro area.
We also expect the negative rate to complement – and in fact empower – the expanded asset purchase programme that we decided in January. A negative rate on bank reserves is an inducement for banks selling securities to the Eurosystem, or receiving an inflow of reserves and deposits as a consequence of central bank purchases, to lend these money balances on and avoid the tax that is paid on them otherwise. In other words, we expect an increase in the velocity of circulation of cash reserves – another way to describe an acceleration in the portfolio rebalancing effect that is a key component in the transmission of asset purchases to the real economy.
Turning to the second track of our policy – the repair of the monetary policy transmission mechanism – the flow of data indicates that our credit easing measures taken last summer are improving the pass-through of our accommodative stance to the real economy. The nominal cost of bank borrowing for euro area NFCs has declined sharply, with some convergence across countries (see Chart 2). The March 2015 Bank Lending Survey also shows that euro area banks have continued with their net easing of loans to NFCs with a further decline in the disparity across countries.
These improvements in net easing were mainly driven by the improved cost of funding – across all main market instruments – and balance sheet conditions. In contrast with the past, the last six months have shown that banks are now passing along their cheaper funding conditions to their customers. Our credit easing measures have supported this process by generating competitive pressures, which in turn makes banks’ lending behaviour more responsive to their funding situation.
As lending rates have declined in tandem with market rates, the demand for loans has also continued to pick-up. Improvements in the net demand for loans to NFCs persisted into the first quarter of this year across almost all euro area countries. This indicates that, by reducing the interest rate charged on the marginal loan, a bank makes the investment project of a firm which requires the marginal loan profitable. It follows from this that the more lending rates are reduced, the greater the number of investments that will break even and consequently, the more investors will ask for loans. Looking ahead, the indications bode well for future economic activity, as euro area banks expect both a further easing of credit standards and a continued increase of net NFC loan demand.
In sum, the monetary impulse is being passed along the entire credit pipeline, including via banks.
IV. Policy reaction functions
When all the structural preconditions are in place for central banks to influence short-term real activity and limit excessive fluctuations in the rate of inflation from targets – namely a negative Phillips curve coefficient and a viable transmission mechanism – a sustained period of disinflation, if this is possible at all, can only emerge if monetary policy facilitates it. However, present day central banks have little scope to show forbearance when price stability is at risk. Tolerating inflation destabilisation is not an option for them. Modern central banks have two strong antidotes at their disposal to avoid this.
First, their robust monetary policy frameworks prescribe the delivery of price stability within a policy-relevant horizon. I stress this qualification as it is a key element. To be sure, the time horizon for central banks to normalise inflation cannot be preset, by statute, unconditionally. Indeed, in a vast part of the world where central banks are assigned numerical objectives for price stability the stabilisation horizon is not defined in rigid calendar-time form, but is left rather flexible for central banks to determine according to the nature of shocks that cause inflation to deviate from target.
At the same time, a central bank which allows itself too much discretion over the time horizon when inflation should return to its target would de facto be claiming authority over redefining its monetary policy objective. This would be manifestly inappropriate, probably illegitimate. Central banks know that if they lack a verifiable commitment to control inflation over a horizon for which the public retains some visibility, this can result in inflation expectations becoming "unanchored". To go back to a point I made earlier, it is in this spirit that a central bank may choose to react vigorously to supply-side shocks so that it can restore the public's faith in the effectiveness of monetary policy.
Second, and as a corollary, present day central banks do not indulge in the self-absolving notion that monetary policy has reached its limits and that further actions would be fruitless. Historically this sort of pessimism about the potency of monetary policy has led to policy paralysis. To make matters worse, this idea was often combined in central banking circles with the conviction that those authorities with control over income, structural and fiscal policies should be principally responsible for reviving the economy and countering deflation risks. In both the 1930s and 1970s as well as in the early 2000s in Japan, these counterproductive beliefs led to policy inaction which ultimately resulted in enormous harm being inflicted on their economies. Today's central banks have learned the lesson from these episodes and do not wait for others to move first.
The ECB’s actions reflect this learning. Many observers expected that the EU environment of diffuse macroeconomic authority would lead to strategic paralysis. Instead, the ECB has risen to its responsibility of ensuring control over inflation in the medium term, and has responded vigorously to any risks of inflation expectations becoming unanchored.
As a result, our expanded asset purchase programme has had three tangible effects. It has prompted a reassessment of inflation prospects as priced in inflation protection contracts: the steady decline of breakeven and inflation swap forwards which occurred in the recent past have not only halted, but have reversed at all horizons. The implemented measures have also flattened the nominal term structure for safe as well as riskier fixed income securities at the longest maturities. And as a consequence of this, they have led to a drop in real rates across the entire spectrum of term contracts.
V. The importance of other stakeholders
Nonetheless, it is clear that all stakeholders must also play their part in ensuring a swift and sustained recovery. The current environment where the real interest rate is below the real GDP growth rate is one that is, as I already intimated, very supportive and ripe for undertaking investment. But it is also not without risks.
Chart 3 contrasts estimates of the long-term real GDP growth rate with long-term real forward rates for the euro area. We see that since May last year the real forward curve has been declining consistently. It is now below a range of estimates for real potential growth rates and, in fact, below the zero line throughout the maturities. This chart admits two stylised interpretations.
In the first interpretation, the movements of the forward real curve are just a mirror image of the compression in term premia achieved via our expanded asset purchase programme. The fact that the forward real curve has continued its descent observed since 2014 may be the result of the term premium compression, given the anticipation (first) and actual execution (then) of central bank purchases of securities held in price-inelastic portfolios. Indeed, the term premium is part of the real remuneration that investors demand in order to hold on to their investments.
In the second interpretation, long-term forward real rates are a measure of an equilibrium “norm”, rather than a reflection of a monetary-policy induced compression of term premia. Another way to look at the outer maturities along the real forward curve is to interpret these rates as a market measure of the equilibrium real rate. That is, they reflect the markets’ view of the real cost of borrowing that can be sustained by an economy that is neither overheating nor decelerating. Indeed, barring preferred habitat and extreme price inelasticities on the side of potential sellers, at those maturities all shocks should have dissipated, and the economy should be expected to have returned to a sustainable path.
This interpretation is less benign than the first one I advanced. If one interprets long-term real forward rates as a measure of the equilibrium rate, the comparison of these persistently negative rates with the growth rate of potential suggests that the economy may be dynamically inefficient and expected to remain so for a very long time.
What conclusions can one draw for policies (and I intentionally use the plural)?
If the first interpretation is correct and one interprets long-term real rates as influenced by term premia and monetary policy, then – by bringing the real cost of long-term borrowing below potential growth – monetary policy can lower the “return bar” at which investment projects break-even and become profitable. Provided investment reacts to this very strong price incentive, the imbalance will be rectified at some point, and real rates will catch up with (a higher) potential rate over time. [7]
If the second interpretation is correct, we are in the fortunate position that the policy conclusions are not so different. The necessary policies that are required to capitalise on the low interest rate environment are the same policies that can repair dynamic inefficiency. In essence, no matter how you read the Chart 3 – or if indeed a combination of interpretations is correct – the safest template for policy action involves largely the same combination of policy strategies.
While monetary policy is attempting to shadow the equilibrium real rate, which has been reduced in the aftermath of the financial crisis, the counterpart economic policy authorities should concentrate on lifting potential. What is needed is to boost growth via increased investment, as investment not only creates current demand but future supply. Public investment on infrastructure, if sufficient fiscal space exists, as well as on education and training can promote a new wave of innovations and put more of the labour force to work. At the same time, removing barriers that restrict the reallocation of workers across firms while enhancing the effectiveness of national competition authorities to drive out rent seeking behaviour would reduce market functioning impediments and, thereby, increase the profitability of investment. The European capital union would greatly facilitate firms wishing to undertake cross-border investment opportunities.
Ultimately, a higher potential will create the conditions for a rising equilibrium rate and will pave the way for monetary policy normalisation.
V. Conclusion
Let me conclude.
Euro area inflation declined substantially over the past year, but as I have just outlined, all the indications are there to support the view that inflation will gradually return to our definition of price stability of below but close to 2%.
While the debate over the Phillips curve is likely continue for decades and beyond, there can be no doubt that monetary policy is playing a key role in helping to make this return of inflation to our objective possible. However, it is now up to governments to seize on this opportunity to ensure that the cyclical recovery becomes permanent.
Annex
Chart 1: Time varying estimates of different specifications of the Phillips Curve
Inflation: HICP excluding energy and food
Slack measure: Output gap

Inflation: GDP Deflator
Slack measure: Output gap

Inflation: HICP excluding energy and food
Slack measure: Unemployment gap
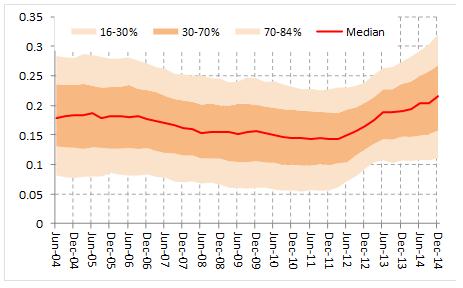
Inflation: GDP deflator
Slack measure: Unemployment gap
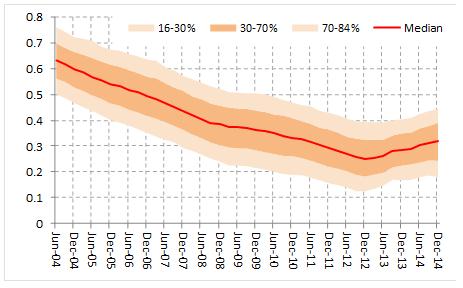
Sources: Eurostat and ECB staff calculations
Note: The Phillips curve relates the inflation measure to its first two lags and the first lag of the slack measure. The coefficients are assumed to evolve following a random walk process; the variance of the errors area also assumed to evolve over time. The available short term unemployment series was shorter than the full sample, so the unemployment gap was used in this framework to proxy the labour market slack. The choice of priors is not optimized. The unemployment gap is inverted.
Chart 2: Cost of borrowing for NFC’s new loans
Composite indicator (percentages per annum)
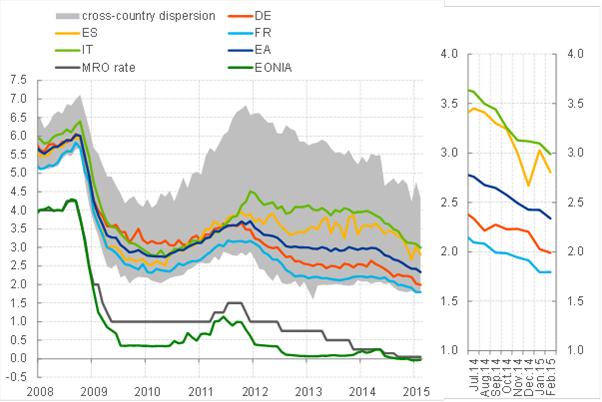
Source: ECB MFI interest rate statistics.
Notes: The indicator for the total cost of borrowing is calculated by aggregating short and long-term rates using a 24-month moving average of new business volumes. The cross-country dispersion displays the min and max range over a fixed sample of 12 euro area countries after excluding the extreme values. The last observation is February 2015.
Chart 3: Market-implied path of 1-year real rate in the euro area (% p.a.)

Sources: Reuters and ECB calculations with other sources indicated in the legend.
Note: last observation is 26th March 2015
-
[1]I would like to thank John Hutchinson and Elena Bobeica for their contributions to this speech.
-
[2]Roberts, J., Monetary Policy and Inflation Dynamics, International Journal of Central Banking, International Journal of Central Banking, vol. 2(3), September, 2006.
-
[3]See Christina Romer and David Romer, (2012).
-
[4]See ECB Monthly Bulletin, July, 2014.
-
[5]Gordon, R., “The Philips Curve is Alive and well and the NAIRU During the slow recovery”, NBER Working Paper, No 19390, August 2013.
-
[6]Riggi, M. and Venditti, F., Surprise! Euro area inflation has fallen, Banca D’Italia Occasional Papers, September 2014.
-
[7]Of course, one should not overlook the fact that, even in this benign case, there are risks. In a world where the real interest rate is below the growth rate of the economy a self-perpetuating asset price inflation dynamic can become a reality. Borrowing to purchase assets that are limited or rigid in supply – for example real estate - may become a more attractive investment due to the expectation of increasing prices than investing in reproducible capital with a lower return. Indeed it is in such a setting, combined with some additional very strong assumptions, that a sustainable “rational bubble” as depicted by Tirole emerges.