
Productivity in the euro area and monetary policy
Speech by Jean-Claude Trichet, President of the ECBSpecial lecture 22nd Annual Congress of the European Economic AssociationBudapest, 27 August 2007
Introduction
I would like to start with a thank you to the organisers and to the President of the European Economic Association for inviting me to participate in this conference. It is a privilege for me to be here today, to discuss the recent productivity developments in the euro area and their implications for monetary policy. I know that you represent la crème de la crème of the profession. As an open-minded practitioner in front of so many distinguished scholars, I am looking forward to learning a lot from your comments on my talk.
The slowdown in productivity growth in recent years represents one of the most important economic developments in the euro area, a matter for concern for economic policy in general, but also an important feature of the environment in which monetary policy operates. I am going to begin my talk with an illustration of key elements of the European developments since the mid-1990s, which are disappointing especially when viewed against the benchmark of the strong U.S. performance over the last ten years. Various hypotheses have been put forward to explain the missing productivity acceleration in Europe, in spite of the similar diffusion of new technologies, especially Information and Communication Technologies, on both sides of the Atlantic. I will discuss some of these tentative explanations. Next, I will review the most recent productivity developments in the euro area, which in the eyes of some might signal the possibility of an inversion of trend. Nevertheless, the future remains shrouded in uncertainty and future developments are ultimately what matters for monetary policy. In the last part of my talk I will discuss the challenges that monetary policy faces in this context and the important role that other economic policies must play.
Productivity growth: past trends
The facts
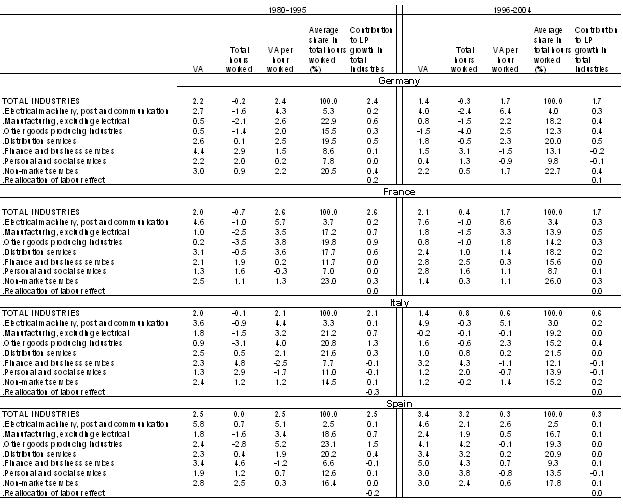
When comparing European and U.S. labour productivity growth over the post-WWII period, measured by real GDP per hour worked, three phases can be identified (Figure 1).
In the first phase, immediately following the War, productivity growth was strong in both economic areas, but especially so in Europe where it remained on average almost 3 percentage points above the 2.4 percent level in the U.S.. Thanks to this prolonged period of catching-up growth, the large negative productivity gap separating the European economies from the U.S. immediately after the War was substantially eroded in a couple of decades.
This period of strong growth in both output and productivity was interrupted in the early 1970s after the occurrence of – and according to some because of – the first oil shock. Once again, however, the slowdown was a common trend across the Atlantic, and Europe continued to perform better on average, with labour productivity growth rates of almost 3 percent over the period from 1974 to 1994, compared to just over 1 percent in the U.S.. As a result, the catching-up process continued and the productivity gap was almost closed in the first half of the 1990s, according to available estimates.
Over the past decade, however, euro area productivity growth has been disappointing. From an average of 2.7% in the 1974-1994 period, it declined to just 1.3 percent in the years from 1995 until 2006. At the same time, the rate of productivity growth in the U.S. increased strongly, from 1.4% to 2.1%, boosting significantly overall economic growth in the same period.
By construction, labour productivity growth is the difference between the rates of growth of output and the labour input. Euro area real output growth remained approximately constant at around 2.2% between the 1974-1994 and the 1995-2006 periods, while U.S. output growth rose from 2.9% to 3.3%. In light of the unchanged real output growth, the decline in euro area average labour productivity growth is mainly due to a switch in the growth rate of total hours worked from –0.4% in the 1974-1994 period to +0.9% in the years from 1995 to 2006. This contrasts with a decrease in the growth rate of U.S. total hours worked from 1.6% in the former period down to 0.9% in the latter. Faster output growth and slower labour input growth have jointly contributed to increase measured labour productivity growth in the U.S..
These recent developments are in stark contrast to the rest of the post-WWII experience. First, they represent a break in the process of European catching-up and a resumed widening of the productivity gap with the U.S.. Second, the broad tendencies across the Atlantic are no longer aligned, so we cannot explain them with the occurrence of a worldwide adverse shock, such as oil in the 1970s. The roots of the European productivity slowdown must be found within Europe.
I will discuss three main hypotheses. The first one is that European firms are not sufficiently present in high-tech sectors. The second one is that firms in all sectors have not exploited the benefits of the new technologies to their full extent. The third one is that the aggregate euro area picture is misleading, because important differences exist across countries.
Before going into further details, however, I would like to underline the difficulties of measuring productivity developments exactly and of comparing them across countries. Most of the data I will discuss for the euro area have recently been made available in the so-called EU KLEMS Growth and Productivity Accounts database, which was published on 15 March 2007. This database includes the first results of a two-year collaborative effort by researchers based at 16 institutions across the EU to produce long and internally consistent time series for output growth, employment, capital formation and total factor productivity, or TFP, at a disaggregated industry level. This database, together with others developed under the leadership of the Groningen Growth and Development Centre, provides extremely valuable information for assessing structural trends in real output and labour productivity growth.
Nevertheless, the database remains subject to a number of caveats, as suggested by the fact that it has not yet been clearly endorsed by national statistical institutes. More specifically, international comparability across some dimensions remains difficult, for example concerning measures of hours worked in the total economy. These difficulties are magnified when discussing TFP, whose measurement is uncertain due to data limitations which concern all factors of production, but are particularly severe for the capital input. Measurement difficulties should be kept at the back of our mind when drawing conclusions from the data.
First remark : Europe has less innovative firms
Given that the U.S. productivity performance has been ultimately linked to rapid technological progress and the role of new information and communication technologies, the first hypothesis to entertain as an explanation of the disappointing European performance is that firms in the old continent have been lagging in the development of new technologies. In other words, the U.S.-Europe difference in productivity should be found mainly in the ICT-producing sectors, which have been driven by technological improvements at breakneck pace in the U.S., and characterised by less innovative firms in Europe.
This hypothesis has some intuitive appeal. After all, industry giants such as Microsoft and Google are in the U.S.. U.S. firms such as Apple are often viewed as epitomising innovation, [1] and the U.S. hosts some of the world’s best brains in its top universities. There is also evidence that, in spite of its small share in total production, the IT-producing sector in the U.S. did contribute to a non-negligible extent to the post-1995 increase in aggregate labour productivity growth, due to its double digit productivity growth rates. [2]
On a more general note, there are other signs of a worse innovation performance of average EU countries compared to the U.S.. The European Commission, under the Lisbon Strategy, has been monitoring the innovation performance of the EU Member States, compared to other countries, for a number of years. Innovation performance is summarised in a composite indicator, called Summary Innovation Index, which includes inputs ranging from the structural conditions required for innovation and investment in R&D activities, to measures of results achieved in terms of successful know-how. The latest report does indicate Danish, Finnish, German and Swedish firms as world innovation leaders, with both high and fast-growing scores in terms of the Summary Innovation Index. [3] The performance of U.S. firms is slightly below the leaders and at par with other European countries including France and Belgium. That being said, on average EU countries do lag behind both the U.S. and Japan. And this is true also in terms of a number of other crucial indicators. [4] For example, Japanese expenditure in R&D in 2004 was, in percent of GDP, twice as big as in the EU; in 2003, the share of population with tertiary education was 38 percent in the U.S., compared to 23 percent in the EU and 30 percent in the Scandinavian countries; venture capital investments, again as percentage of GDP, were in the U.S. in 2002 more than three times larger than in Europe in 2005; finally, both the U.S. and Japan show a vastly superior performance in terms of number of patents granted compared to the EU.
Nevertheless, differences in the ICT- producing sectors appear to be insufficient to explain the bulk of the cross-Atlantic gap in aggregate productivity growth. There is a view, which I will turn to next, that ICT- using sectors have also played a fundamental role in determining productivity improvements in the US.
Second remark: U.S. firms are better able to exploit new technology
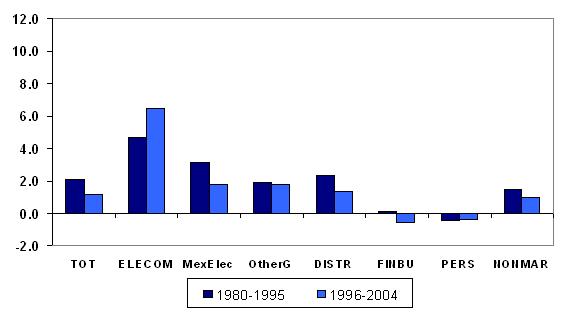
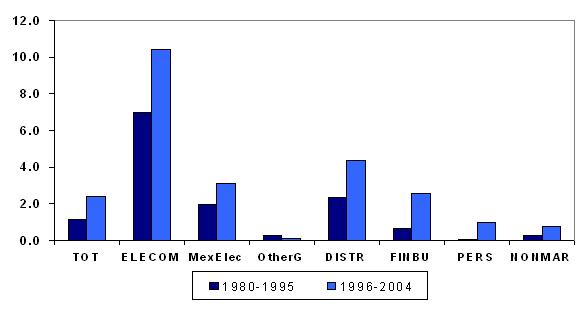
Over the years from 1996 to 2004, the labour productivity differential between the euro area and the U.S. has characterised above all the standard, non-ICT-producing manufacturing sector, and especially market services, including distribution, financial and business services (Figure 2-3). These are also the sectors driving the decline in labour productivity growth in comparison with the 1980-1995 period.
In the U.S. case, the increase in labour productivity growth over the 1996-2004 period was more broad-based. With a few exceptions, most U.S. sectors show labour productivity growth rates that are very significant, above 2% per year, and higher than in the 1980-1995 period.
This evidence is broadly in line with the hypothesis that information and communication technologies have the largest impact on productivity growth indirectly, namely by sparkling further innovations in managerial processes, procedures and organizational structures, and by facilitating complementary innovations. For example, ICT reduces communication costs and allows for more flexible and decentralized organizational structures. However, the full benefits of the availability of new technologies can only be reaped if computers are adopted as part of mutually reinforcing organizational changes. [5] One of the slogans of the organisational reengineering wave of the U.S. in the 1990s was: “Don’t Automate, Obliterate”, to convey the need for breaking away from old business processes, rather than just trying to speed them up. [6]
These effects are particularly difficult to measure at the aggregate level, but some studies have suggested that the contribution from the use of information technology capital – including computer hardware, software and communication equipment – accounts for almost 50 percent of U.S. labour productivity growth in the second half of the 1990’s. [7] This contribution is associated with both increased real investments and declines in their quality-adjusted prices.
The crucial role of ICT-using sectors is also confirmed by the analysis of TFP, which in theory represents a pure measure of disembodied technological progress associated with the use of all factor inputs. Table 1 reports a decomposition of euro area and U.S. value added [8] growth for the market economy concept. [9] The key factor behind the increase in real output growth over the 1996-2004 period, compared to the years from 1980 to 1995, is in fact TFP growth. In the 1980-1995 period, euro area annual TFP growth, at 0.4%, was not markedly below the 0.7% level in the U.S.. The gap became much larger in the 1996-2004 period, when euro area TFP growth increased only marginally to 0.5%, while U.S. TFP growth rose dramatically to 1.6%. The euro area sectors in which TFP growth has declined most, between the 1980-1995 and 1996-2004 periods, are manufacturing (excluding electrical industry), distribution services, and financial and business services. The ICT-producing sector is one of the few in which TFP growth exhibited a better performance in 1996-2004 compared with 1980-1995.
Third remark: It is important to analyse cross-country differences
The euro area is a large economic area made of many different countries. One may therefore conjecture that the aggregate figures I have discussed so far conceal important cross-country differences, which should be taken into account for a correct interpretation of the facts.
Once again, the EU-Klems project provides valuable information in this respect (Table 2). At least with reference to the largest four euro area economies, namely Germany, France, Italy and Spain, one can gauge to what extent developments in individual countries have contributed to the labour productivity slowdown in the euro area as a whole.
Labour productivity growth for the total economy slowed down significantly in all four of these euro area economies over the 1996-2004 period compared to the years from 1980 to 1995. Over the 1996-2004 period, annual labour productivity growth ranged from a maximum of 1.7% in Germany and France to a minimum of 0.3% in Spain, but it remained in all cases significantly below the 2.4% level in the U.S.. This downward trend has been particularly marked in Italy and Spain, where labour productivity grew significantly below the euro area average. When looking at the two components of labour productivity growth - real gross value added and total hours worked - the figures reveal additional cross-country differences. In Germany, the productivity slowdown has been driven by a significant reduction in real output growth, while in France it mainly reflects a rise in labour input growth. In Italy, the productivity downturn has been driven by both a significant drop in real gross value added growth and a strong increase in labour input growth. In Spain, the slower pace in labour productivity growth has been dominated by a stronger increase in labour input growth than in real output growth.
By and large, while different EU countries have had somewhat different experiences, the overall pattern is common. This conclusion remains valid looking at a sectoral breakdown. For example, the labour productivity differential in favour of the U.S. has been larger in market services than in manufacturing, even if in the case of France the deceleration was rather modest, with annual labour productivity growth in manufacturing over 1996-2004 even slightly exceeding that observed in the U.S. (3.3% in France compared to 3.1% in the U.S.). The tendency towards a labour productivity slowdown in distribution services and financial and business services is also common, although the deceleration was mild in the former sector in the case of Germany – still exhibiting a labour productivity growth rate above 2% in 1996-2004 period. The ICT-producing industries in Germany, France and Italy failed to exhibit a decline in labour productivity growth over the years from 1996 to 2004 compared with 1980-1995 period, but a slowdown did occur in Spain.
Similar observations can be made for national developments in TFP, whose deceleration between the 1980-1995 and 1996-2004 periods was broad-based across the four largest euro area economies, even if more noticeable in Italy and Spain, where TFP growth turned negative in recent years.
Possible interpretations
Overall, many causes probably contribute to explain the disappointing labour productivity growth performance in euro area economies in comparison to the U.S.. A gap is visible in the ICT- producing sectors, where U.S. productivity growth has increased at an especially fast pace. However, the particularly poor labour productivity and TFP growth performances of some ICT- using sectors, such as distribution services, and financial and business services, appear to play a crucial role in determining aggregate outcomes.
Given the broad diffusion of ICT hardware and software in Europe, this evidence suggests that the presence of structural rigidities prevents, or slows down the process of exploitation of all the advantages of the new technologies in the lagging industries. Conversely, the more flexible structural characteristics of the U.S. economy – a more flexible labour market, a higher degree of competition in product markets and lower barriers to entry for new firms as well as a more efficient capital market – have proved to be better suited for the challenges and opportunities of technological innovation.
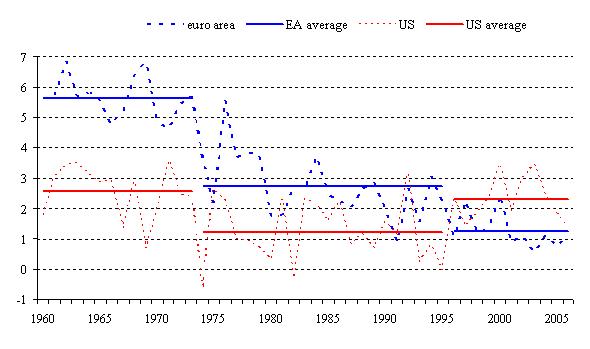
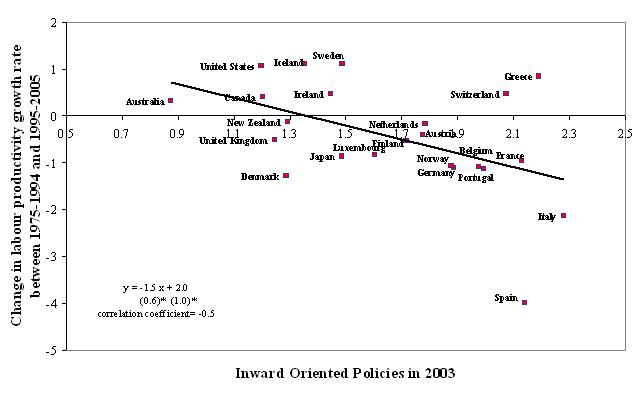
This intuition has been confirmed by a few studies of sectoral developments using a set of indicators that measure differences in the regulatory restrictions of non-manufacturing sectors of OECD countries. [10] By and large, these studies find that highly regulated environments tend to be associated with lower investment and productivity growth. [11] A simple way to illustrate the link is to relate differences between rates of growth of productivity pre and post 1995 in various countries to an index of regulatory reforms. An obvious choice is to focus on the OECD’s “inward oriented” index of product market regulation, which includes information on the degrees of “state control” and “barriers to entrepreneurship,” but abstracts from “barriers to trade and investment” (Figure 4). This simple, aggregate analysis is nevertheless suggestive of the association between an anti-competitive regulatory environment and poor labour productivity growth. More sophisticated studies based on these data point out that the negative impact of regulation on productivity growth comes through distortionary effects on investment and innovation, rather than merely through the administrative costs it may entail.
We can therefore conclude that the degree of market regulation plays an important role to explain the euro area performance. However, there are indications that it does not provide a complete explanation. For example, it is not immediately consistent with evidence that firms placed in the same regulatory environment have superior productivity performance, when U.S.-owned. [12] More importantly, the evidence of a negative influence of regulation on productivity growth may appear to be inconsistent with a number of basic facts: a more regulated environment did not prevent the superior European productivity growth performance prior to the mid-1990s; the recent trend in Europe has been towards deregulation; some of the countries which do not register an outstanding productivity performance, such as the UK, have reached a stage of deregulation comparable to that of the United States.
I believe that these apparent inconsistencies can be reconciled if we realise that the recent productivity decline is a peculiar result of the coexistence of regulation and technological innovation. While regulation has probably become less stringent in more recent years, it has become more costly for firms in an era of rapid technological progress driven by ICT. Studies have found a strong negative correlation between anti-competitive regulation and the contribution of ICT-using services to productivity growth. [13] The effect could come through larger barriers to entry, which reduce competition and the incentive of incumbents to innovate. [14]
Regulation may also have interacted with the tax system. An influential view on the poor European performance builds on the observation I made at the beginning of my talk, that the productivity slowdown is mostly associated with a sharp increase in the growth rate of hours, for an unchanged growth rate of output. The rise in hours worked since 1995, and its previous decline, have been relate to gradual increases in labour taxes until 1995, and to reductions over the more recent period. According to this view, lower taxes on labour and the introduction of labour market reforms since the mid-1990s have provided incentives for firms to hire a larger number of lower skilled workers. [15] This hypothesis would also help explain the faster labour productivity growth in the European Union until 1995 in spite of the high regulatory environment.
Despite the large number of papers published in recent years, more research efforts are needed to better understand the sources of the European productivity performance in the past decade. These difficulties are magnified when trying to gauge future trends.
Productivity growth: current trends
In conjunction with the cyclical recovery, euro area labour productivity growth per person employed has been gradually increasing since 2005. From a trough of 0.2% year on year in the first quarter of 2005, it slowly climbed to 1.2% in the third quarter of 2006, then to 1.7% in the first quarter of 2007. A notable feature of these recent developments is that the increase in productivity growth occurred at the same time as an increase in employment, which contrasts with the average experience of the 1995-2006 decade and might, in the eyes of some, be a first sign of structural improvement.
At the sectoral level, the recent, favourable labour productivity performance has been mainly driven by positive cyclical developments in industry excluding construction. In this sector, labour productivity growth has steadily increased since 2004, reaching 4.1% year on year in the first quarter of 2007. In contrast, annual labour productivity growth in services has not improved as much, even if it also rose slightly.
These encouraging signs must be weighted against the fact that data based on productivity per hours worked show a less spectacular improvement in 2006. Since only yearly data on hours are available for the euro area, we will need time to understand whether changes in working time distort the interpretation of quarterly data on productivity per employed person.
The problem at this point in time is to determine whether the recent improvements in productivity growth do, or do not, represent the beginning of an inversion of the declining trend observed of the last decade. Let me just note, incidentally, that once again these developments are taking place out of phase compared to the U.S., where the growth rate of labour productivity in the non-farm business sector has since 2004 been slowing down from the exceptionally rapid pace of the previous decade. In spite of its deceleration, however, labour productivity seems to have continued to benefit importantly from investment in new technologies, even if the contribution from capital deepening has been smaller in recent years than it was during the capital investment boom of the late 1990s. This is one of the reasons suggesting that the recent U.S. slowdown in labour productivity may be, at least partly, a cyclical response to the moderation in the pace of economic activity in 2006, rather than a meaningful downshift in the longer-run trend.
Recent developments: structural or cyclical?
Identifying changes in trend productivity growth is always difficult in the midst of an expansion, because productivity growth is well-known to be subject to cyclical variations: it tends to be below its longer-term trend when the economy is contracting and above that trend when the economy is in the early stages of an expansion.
This property can be described more concretely with reference to the euro area experience during the cyclical upswing of year 2000. After years of sluggish performance compared to the U.S., many conjectured that the euro area economy would also experience a revival in trend productivity growth. These conjectures led international institutions to revise upwards their estimates of potential output growth in the euro area.
With hindsight, that assessment was overoptimistic. The revisions in the first available projections for the years 1999 to 2004, typically published one to two years ahead by the OECD and the European Commission and one to five years ahead by the IMF, were always negative and on average equal to between -0.3% and -0.4%. Moreover, for 1999 to 2002, the ranges of first available projections published by the Commission, the IMF and the OECD do not overlap with the ranges of the latest estimates by the same international organisations (Figure 5).
From the viewpoint of this recent experience, it is only natural to be cautious about the future. After all, we attribute a lot of the discrepancy between the European and U.S. performance in labour productivity growth to different rates of growth of TFP, namely of an unobservable factor whose evolution over time is particularly difficult to forecast. Are the structural reforms carried out in past years sufficient to at least stop the European productivity decline, if not to foster a technological revival? Have European firms learned to exploit the potential of the ICT-revolution to its full extent?
At the same time, one should not extrapolate the recent past indefinitely and fail pray of the view that the European countries are ultimately doomed, because definitely unable to cope with the challenges of globalisation and technological innovation. After all, the U.S. productivity revival appeared late in the cycle, years after the beginning of the expansion of the 1990s. The overall expansion did not appear to conform to previous cyclical norms. The rate of growth of GDP and investment in non-residential structures increased very slowly in the initial years of the 1990s compared to previous, prolonged expansions, in the 1960s and 1980s. Investment in information technology also took a while to accelerate, even if it then reached levels far above those of other European countries. [16]
In practice, we base the real-time assessment of trend versus cyclical components in productivity growth on a wide set of indicators, including time-series techniques, which attempt to filter from the data the unobservable time-varying trend in productivity growth, and other relevant information.
All methods tend to suggest that the recent pick-up in productivity growth is probably not erratic. It has proved to extend also to the services sector, which had remained particularly sluggish in the past. Survey measures also appear to be supportive of the hypothesis of a somewhat improved outlook for future productivity growth, even if their results have turned less optimistic over 2006. [17]
At the same time, the recent rate of growth of labour productivity is not exceptionally high compared to previous cycles. Similar growth rates were observed during cyclical peaks in 1997-98 and in 2000. Recent estimates of TFP-growth are also not particularly buoyant and the contribution to labour productivity growth from capital deepening has been non-negligible over the 2004-2006 period. This pick-up in investment activity is often interpreted as a sign in favour of the view that the improvement in labour productivity growth is associated with cyclical developments.
According to time-series estimates, the trend component of the rate of growth of output per hour stabilised in the last few years, after a steady decline from the high levels of the seventies. There are, however, no clear signs of improvement in the trend, and one needs to bear in mind that these measures are surrounded by considerable statistical uncertainty.
At this stage, all taken into account, my provisional assessment would be that the most recent pick up in labour productivity remains of a cyclical nature and that it is too early to judge whether, on top of this cyclical improvement, we are starting to observe a structural change that will be sustained over many years to come. That is not to say that I exclude this possibility: the creation of the single market for goods and services, the implementation of financial integration, the completion of the reforms that are part of the Lisbon agenda and the pursuit of the reengineering of production processes associated with ICT investments and globalisation should all foster labour productivity and total factor productivity in the euro area. They should! But we do not have evidence yet that substantiates this hypothesis.
Policy implications
I have so far discussed possible determinants of past trends in euro area productivity growth and the outlook for future productivity developments. Yet, to what extent are these developments relevant for monetary policy?
At the European Central Bank we can provide a very clear answer. Our mandate is to maintain price stability over the medium term and we have clarified that price stability is to be interpreted as a rate of increase in the Harmonised Index of Consumer Prices for the euro area below but close to 2 percent. Hence, developments in productivity growth are relevant for the monetary policy of the ECB to the extent that they have an influence on medium term deviations from price stability in the HICP for the euro area.
What are the potential risks to price stability in the medium term coming from productivity developments? Some would give very simple and straightforward replies. One view would suggest that the simple quantity equation tells us that trend money growth should be adjusted so as to accompany the changes in output growth, whether up or down, triggered by the change in productivity developments. All other things equal, the monetary policy stance should be, according to this view, looser if there is an increase in trend productivity growth and tighter in the reverse case.
Another view would stress that standard growth theories tell us unambiguously that, in the long run, equilibrium real interest rates move proportionally to trend productivity growth. Assuming that long run inflation expectations are firmly anchored, changes in equilibrium real rates should spill over one-to-one into changes in the equilibrium nominal interest rate. Other things equal, the policy interest rate will eventually move up, if there is an increase in trend productivity growth, and down in the reverse case.
A naïve interpretation of the suggestions for policy action stemming from these two views would come to the conclusion that they are somewhat contradictory. Let us see how we should reason as a policy maker in practice.
Monetary policy implications of a known change in productivity growth
As is often the case in economics, matters become particularly complex when we move to analyse higher frequencies. In the short run, whether productivity developments exert positive or negative pressure on inflation will depend on their net effect on aggregate demand and aggregate supply.
A productivity slowdown will in fact tend to produce two competing effects. The first effect, which can be denoted as supply effect, derives from the lower potential output growth associated with the productivity slowdown. For a given level of aggregate demand, the fall in potential output will tend to be such that actual output exceeds potential, leading to a positive output gap and upward pressure on inflation.
The second effect of the productivity slowdown is to reduce individuals’ wealth, due to the impact of lower productivity on expected future income and on profitable investment opportunities. For given potential output growth, the wealth effect would give rise to excess aggregate supply, thereby leading to downward pressure on inflation.
Whether inflation tends to increase or fall in response to a productivity slowdown will therefore depend on which of these two effects dominates. In theory, there is no general result. The net effect will depend on specific features of the productivity shock and of its transmission throughout the economy.
The supply effect will tend to dominate when aggregate demand adjusts more slowly. For example, this may happen when productivity shocks are perceived to be short-lived. In this case, wealth, and aggregate demand, would react little, given the knowledge that the shock will quickly be reabsorbed. At least in case of positive productivity developments, the wealth effect should also be small if households are credit constrained, thus unable to use their expected future wealth as collateral to bring forward consumption.
In practice, the supply effect has often been emphasised in the U.S. policy debate in the 1990s, with the implication that monetary policy could afford to be more expansionary given the increased trend rate of productivity growth. The argument has typically been made using a Phillips curve relationship, where an increased trend output growth – or a fall in the NAIRU – would lead to significantly lower inflationary pressures. [18] According to this view, the Federal Reserve realised that potential output growth increased over the 1990s and, despite a booming economy and record-low unemployment, tightened monetary policy less than would be implied by the gap between actual output growth and previous estimates of potential growth. For the euro area, where productivity developments have been disappointing, this view would imply that the policy stance should be tighter than it would be in the absence of the productivity slowdown.
The wealth effect will dominate instead when aggregate demand adjusts quickly. This may be the case, for example, when productivity developments are perceived to be very persistent, or permanent. A perceived “gloom and doom” scenario of permanently lower productivity growth would probably generate an immediate and strong wealth effect, including a stock market decline, which may exceed the fall in aggregate supply and lead to negative pressure on inflation. Similarly, the wealth effect will tend to prevail when technological innovations – for example the invention of the microchip – lead to widespread beliefs of large future productivity improvements, but the improvements are slow to diffuse through the production processes.
Monetary policy implications of uncertainty on trend productivity growth
The monetary policy implications of productivity developments are therefore far from obvious. Opposite policy implications can be drawn depending on the perceived nature of the shocks and on other features of the economic environment through which they are transmitted. Any economic model aiming to provide useful guidance for policy should therefore include at least two, and probably three, ingredients.
First, it must acknowledge that productivity growth can be driven by shocks with various degrees of persistence. This is a simple way to capture the evidence I reviewed in the first part of my talk. In practice, there is a continuum of possibilities from purely transitory, to transitory but persistent, until truly permanent changes in the rate of productivity growth. The key empirical feature, however, is that transitory shocks tend to explain most of short-term dynamics of labour productivity growth, which is very volatile on a quarterly basis. Persistent, or perhaps permanent shocks, occur more rarely and appear to be smaller.
Second, perceptions as to the persistent nature of productivity shocks must be allowed to change over time. It is difficult to understand in real time the nature of any observed productivity development and it is only normal to revise one’s opinions as new information arrives. The drop in U.S. stock market prices in 2001-2002 may have been partly the result of a correction of private agents’ opinion on the strength of the economy. Similarly, economic and market analysts regularly revise their assessment of trend productivity and output growth as new data become available. A simple way to capture these effects can be to assume that underlying productivity shocks are unobservable, so that economic agents must assess over time the persistent nature of observed developments. [19]
The third desirable ingredient is that economic agents must be forward looking to a certain degree, so that perceived future productivity developments must be allowed to impact on their current decisions.
Based on research conducted at the ECB and elsewhere, a few conclusions emerge from these analyses. [20] First, given that the variance of persistent productivity shocks was in the past small, relative to the variance of temporary shocks, the safest bet in interpreting current developments is to assume that they are most probably driven by temporary shocks. It would be in case new information points persistently in the same direction, that the assumption should be revised in favour of the persistent shock hypothesis. If the true underlying developments are in fact permanent since the beginning, we must be aware that this can lead to very persistent discrepancies between actual and perceived trends in productivity.
Given that revisions of our perceptions of productivity developments are unavoidable and frequent, policy should react gradually to perceived developments. To the extent that shocks will normally be perceived as temporary by all economic agents, one might expect the wealth effect to be small, and the supply effect to prevail. Over time, however, as new data releases may lead to changes in perceptions of the nature of shocks, individual behaviour and policy can be readjusted accordingly. These results highlight the importance of detailed analyses to understand the determinants of observed productivity developments, and to gauge how long a productivity slowdown would last.
At the same time, policy should take for granted that trend productivity growth is particularly prone to measurement errors and adopt an approach which is robust to mismeasurement. One of the proposed explanations of the so-called U.S. Great inflation of the 1970s relies exactly on the hypothesis that a major misperception of the economy’s productive capacity occurred at the time. [21] An improved ability to deal with output gap misperceptions can be used to provide an alternative interpretation of the U.S. experience in the 1990s.
In any case, the possibility of large measurement errors for real economy data calls for a significant degree of measure in the policy response. When measurement errors occur, too strong a policy response to mismeasured economic activity can induce undesirable fluctuations in the economy. A strong focus on price stability is robust to these measurement errors and reduces the extent to which they are allowed to spill over into excess volatility of the policy interest rate. This implies, in particular, that monetary policy should be gradually, but persistently adapted when inflation dynamics tend to become inconsistent with the definition of price stability.
Finally, I would very strongly stress that it is of paramount importance for a central bank to ensure that inflation expectations remain well-anchored. Financial markets and the public at large must have a good understanding of the systematic and conditional conduct of monetary policy, so that expectations about future price developments and the path of policy rates remain in line with the central bank’s mandate. For these reasons, the ECB has striven to be as transparent as possible, communicating clearly, and by a variety of means, its definition of price stability, its two-pillar monetary policy strategy, its assessment of the economic situation, and its view of the outlook for price stability and associated risks.
Implications for structural policies
So far, I have discussed the implication of trend productivity growth for monetary policy, but I would like to close with special emphasis on the implications of monetary policy on trend productivity growth. Here we have a very simple result, as robust as one can hope to find in economics. Monetary policy has to do with nominal variables and productivity is an ultimately real phenomenon. Monetary policy has no effect on trend productivity growth. Structural policies must take the responsibility to create conditions conducive to better productivity performance in the euro area.
Despite significant progress in some areas, structural reforms have not made enough progress in easing market regulation. Some of the labour market measures adopted over the last decade or so are in part responsible for the success in raising participation rates, thereby contributing to the higher labour input and real output growth observed. This notwithstanding, the implementation of structural reforms has been until now too slow, thereby calling for further efforts – as advocated in the renewed Lisbon strategy – in order to facilitate the reallocation of resources to their most productive uses while fostering labour productivity growth and technological advance.
It is clear that major structural reforms are not easy to achieve, but there is today a unique opportunity for Europe and the euro area to take advantage of the present favourable growth developments. I have discussed elsewhere some of the key priorities for reform in three main areas [22] and I would like to briefly recall them here.
The first is to get more people into work. Low participation rates in Europe are probably triggered by the legal and regulatory environment, tax systems and social institutions. Necessary measures to increase labour utilisation or labour supply include the reform of tax and benefit systems in order to increase incentives to work. At the same time, high unemployment rates in the euro area and in particular unacceptable high youth unemployment rates suggest the need to spur not only labour supply but also labour demand. There is a need to reduce labour market rigidities which restrict wage differentiation and flexibility. Adjustments should be made to employment legislation where it impedes the hiring of younger and older workers in particular.
The second priority for reform is to increase competition further. Some progress has been made in this regard. For example, several network industries, like telecommunications, are now fully or largely open to competition. A lot remains to be done, however: the extension and deepening of the EU internal market remains a priority in particular as regards further financial market integration, the pursuit of effective competition in the energy market and the implementation of the Services Directive. Let me also briefly mention labour mobility, which is still limited in the euro area. Labour mobility is an essential element of the Internal Market and an important component of adjustment mechanism in a context of monetary union. Any barriers to cross-border labour mobility should be removed. Following the principle of “an open market economy with free competition” is pivotal to fostering long-term economic growth.
Finally, to fully exploit productivity potential, the labour and product market reforms I just mentioned need to be accompanied by policies that support innovation and technological changes. These include, inter alia, the unlocking of business potential by creating an entrepreneurial-friendly economic environment, measures to support innovation through higher investment in research and development (R&D) and policies aimed at improving human capital.
In this context, the academic world has an important role to play. To make these measures most effective, they need to be accompanied by efforts to improve the labour force’s level of education and expertise. Meeting the challenges of innovation and its diffusion as well as ensuring the labour force’s employability and flexibility, requires that human capital is continuously adjusted to labour market needs through improved education and training, as well as lifelong learning.
The last decades have already brought about an enormous increase in the level of educational attainment. So far, however, investment in human capital in Europe is still clearly inadequate for a “knowledge-intensive” economy. In 2003, the U.S. annual expenditure on higher education institutions represented 2.9% of GDP, while in the euro area it only represented 1.2%. [23] The gap is mainly a result of greater private funding. European universities could be allowed and encouraged to seek complementary private sources of funding and legal, and other barriers to public-private partnerships between universities and businesses should be removed. Many European countries also need more incentives for innovative research and an active and regular quest for synergies with the private sector. A more effective education system, as estimated by some research of the European Commission, might bring about a significant contribution to the annual EU GDP growth rate. [24]
Concluding remarks
What makes trend productivity developments particularly difficult to factor in is the fact that they are extremely hard to gauge in real time and subject to recurring changes. Twenty years ago, the Journal of Economic Perspectives published the proceedings of a symposium on “The slowdown in productivity growth”. [25] The main focus was on the poor U.S. performance in the 1970s and 1980s. Who could have at that time expected that a very significant, positive jump in trend productivity would be observed seven years later?
A lot of good research is suggesting that we are not wrong in thinking that what happened in the US is due to the generalisation of the full reengineering process associated with new technologies – and not necessarily only ICT – in the context of a highly flexible economy. If indeed this is true, then there are good reasons to think that the progressive completion of the European single market for goods and services and the active implementation of European structural reforms aiming at more flexibility in all markets will eventually permit the euro area and the European Union to experience a kind of productivity jump similar to the US one ten years ago.
If the President of the European Economic Association is kind enough to invite again the President of the ECB in the future, I consider it likely that the time will come when the speech of the ECB President will concentrate in explaining the consequences of the upward jump in total factor productivity and labour productivity in Europe. I regret not being able to do that right now, but I am confident that it will happen, provided the reforms that are overdue are actively implemented.
Annex
Table 1: Gross value added growth and contributions, 1980-2004
(annual average percentage growth rates)
A. Euro area (*)
| VA | L | K | KIT | KNIT | TFP | |
| (1) =(2)+(5)+(8) | (2) | (5) =(6)+(7) | (6) | (7) | (8) | |
| 1980-1995 MARKET ECONOMY | 1.6 | 0.1 | 1.1 | 0.4 | 0.7 | 0.4 |
| Electrical machinery, post and communication | 3.6 | -0.4 | 1.5 | 0.6 | 0.9 | 2.5 |
| Manufacturing, excluding electrical | 1.2 | -1.0 | 0.8 | 0.2 | 0.7 | 1.4 |
| Other goods producing industries | -0.6 | -1.2 | 0.9 | 0.2 | 0.6 | -0.3 |
| Distribution Services | 2.5 | 0.5 | 0.9 | 0.3 | 0.6 | 1.1 |
| Finance and business services | 3.3 | 2.4 | 1.7 | 0.7 | 1.0 | -0.8 |
| Personal and social services | 1.5 | 1.8 | 0.8 | 0.2 | 0.6 | -1.3 |
| 1995-2004 MARKET ECONOMY | 2.0 | 0.4 | 1.1 | 0.5 | 0.7 | 0.5 |
| Electrical machinery, post and communication | 5.5 | -0.7 | 1.2 | 0.6 | 0.6 | 4.9 |
| Manufacturing, excluding electrical | 1.2 | -0.3 | 0.6 | 0.2 | 0.4 | 0.8 |
| Other goods producing industries | 1.2 | -0.3 | 0.7 | 0.1 | 0.6 | 0.7 |
| Distribution Services | 2.1 | 0.5 | 1.1 | 0.4 | 0.7 | 0.6 |
| Finance and business services | 2.8 | 1.7 | 2.2 | 1.2 | 1.0 | -1.0 |
| Personal and social services | 1.6 | 1.2 | 0.9 | 0.2 | 0.7 | -0.6 |
B. United States
| VA | L | K | KIT | KNIT | TFP | |
| (1) =(2)+(5)+(8) | (2) | (5) =(6)+(7) | (6) | (7) | (8) | |
| 1980-1995 MARKET ECONOMY | 3.0 | 1.2 | 1.1 | 0.5 | 0.6 | 0.7 |
| Electrical machinery, post and communication | 6.6 | 0.1 | 1.9 | 1.0 | 0.9 | 4.6 |
| Manufacturing, excluding electrical | 1.7 | 0.1 | 0.6 | 0.3 | 0.3 | 0.9 |
| Other goods producing industries | 0.7 | 0.7 | 0.7 | 0.2 | 0.5 | -0.7 |
| Distribution services | 3.9 | 1.3 | 1.2 | 0.6 | 0.6 | 1.3 |
| Finance and business services | 4.4 | 2.9 | 1.8 | 1.0 | 0.9 | -0.3 |
| Personal and social services | 2.8 | 2.5 | 0.5 | 0.2 | 0.3 | -0.2 |
| 1996-2004 MARKET ECONOMY | 3.7 | 0.7 | 1.4 | 0.8 | 0.6 | 1.6 |
| Electrical machinery, post and communication | 8.9 | -0.3 | 2.5 | 1.5 | 0.9 | 6.8 |
| Manufacturing, excluding electrical | 0.7 | -1.1 | 0.7 | 0.4 | 0.3 | 1.1 |
| Other goods producing industries | 1.6 | 1.0 | 0.9 | 0.2 | 0.6 | -0.3 |
| Distribution services | 4.7 | 0.5 | 1.4 | 1.0 | 0.4 | 2.8 |
| Finance and business services | 4.9 | 2.0 | 2.0 | 1.2 | 0.7 | 0.9 |
| Personal and social services | 2.6 | 1.7 | 1.0 | 0.4 | 0.6 | 0.0 |
Source: EU KLEMS database.
*)Excludes Greece, Ireland, Luxembourg, Portugal and Slovenia.
Key: VA = Real gross value added growth; L = Contribution of labour input growth; K = Contribution of capital input growth; KIT = Contribution of ICT capital; KNIT = Contribution of non-ICT capital; TFP = Contribution of Total Factor Productivity growth.
Table 2. Sectoral Labour Productivity Growth in the 4 Largest Euro Area Economies, 1980-2004
(annual average percentage growth rates)
Source: EU KLEMS database.
Key: VA = Real gross value added growth; LP = Labour productivity growth.
Figure 1: Productivity Growth and Productivity Averages for the U.S. and the euro area.
Source: "The Conference Board and Groningen Growth and Development Centre, Total Economy Database, January 2007.
Note: Data for the euro area are based on GGDC data for output (total GDP, in millions of 2005 U.S.D, converted at “GK” purchasing power parities) and total hours worked for all member countries from 1968 onwards, while from 1960 to 1967 the data are for all member countries excluding Austria.
Figure 2: Labour Productivity Growth in the Euro Area(*) 1980-2004
(average annual percentage growth rates)
Source: EU KLEMS database.
*) Excludes Slovenia.
Key: TOT = total economy; ELECOM = electrical machinery, post and communications sector (representing the ICT-producing industries); MexElec = Manufacturing, excluding electrical industry; OtherG = other industrial production (i.e., mining and quarrying; electricity, gas and water supply; construction; agriculture, hunting, forestry and fishing); DISTR=wholesale and retail trade; sale, maintenance and repair of motor vehicles; retail sales of fuel; FINBU=finance and business service sectors, except real estate (includes financial intermediation); PERS=personal services (including hotels and restaurants; other community, social and personal services, employees of private households); NONMAR=non-market services (public administration, education and health) and real estate activities.
Figure 3: Labour Productivity Growth in the U.S., 1980-2004
(average annual percentage growth rates)
Source: EU KLEMS database.
Key: TOT = total economy; ELECOM = electrical machinery, post and communications sector (representing the ICT-producing industries); MexElec = Manufacturing, excluding electrical industry; OtherG = other industrial production (i.e., mining and quarrying; electricity, gas and water supply; construction; agriculture, hunting, forestry and fishing); DISTR=wholesale and retail trade; sale, maintenance and repair of motor vehicles; retail sales of fuel; FINBU=finance and business service sectors, except real estate (includes financial intermediation); PERS=personal services (including hotels and restaurants; other community, social and personal services, employees of private households); NONMAR=non-market services (public administration, education and health) and real estate activities.
Figure 4: labour productivity growth and regulatory restrictions
Source: "The Conference Board and Groningen Growth and Development Centre, Total Economy Database, January 2007, and OECD.
Note: the equation displays the coefficients of a regression of the change in labour productivity growth on the inward-oriented policy index with standard errors in parentheses.
Figure 5: Revisions in estimates of euro area potential output
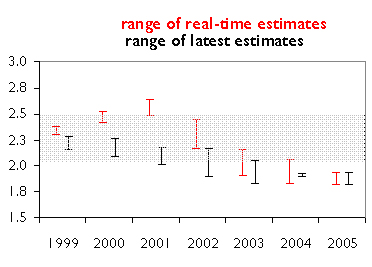
Source: European Commission, IMF, OECD and ECB calculations.
Note: For the EC, calculations are based on trend growth projections and estimates.
-
[1] See The Economist, 7th June 2007.
-
[2] Various authors have emphasised to different degrees the role of the IT-producing sector in the U.S. productivity revival. See e.g. R.J. Gordon (2000), “Does the new economy measure up to the great inventions of the past?”, Journal of Economic Perspectives 14, p. 49-74; S.D. Oliner and D.E. Sichel (2000), “The resurgence of growth in the late 1990s: is information technology the story?”, Journal of Economic Perspectives 14, p. 3-22; K. Stiroh (2002), “Information technology and the U.S. productivity revival: what to the industry data say?”, American Economic Review 92, pp. 1559-1576.
-
[3] European innovation scoreboard 2006, available from http://www.proinno-europe.eu/inno-metrics.html.
-
[4] The innovation scoreboard figures refer to the EU-25 composition.
-
[5] P. Milgrom and J. Roberts (1990), “The economics of modern manufacturing: technology, strategy and organization,” American Economic Review 80, pp. 511-528.
-
[6] M. Hammer (1990), “Reengineering work: don’t automate, obliterate,” Harvard Business Review, July-August, pp.104-112.
-
[7] S.D. Oliner and D.E. Sichel (2000), Op. cit..
-
[8] The notion of real value added differs from real GDP because the latter includes the contribution of taxes less subsidies on products.
-
[9] The market economy is defined as total economy excluding health, education and government sectors.
-
[10] P. Conway and G. Nicoletti (2006), “Product market regulation in non-manufacturing sectors in OECD countries: measurement and highlights,” OECD Economics Department Working Paper 530. The authors are designed to “measure to what extent competition and firm choices are restricted in industries and areas where there are no a priori reasons for government interference, or where regulatory goals could plausibly be achieved by less coercive means.”
-
[11] For example, A. Alesina, S. Ardagna, G. Nicoletti and F. Schiantarelli (2005), “Regulation and investment,” Journal of the European Economic Association 3, pp. 791-825, find that regulatory reforms have had a significant positive impact on capital accumulation in the transport, communication and utilities sectors, especially in the long run. G. Nicoletti and S. Scarpetta (2003), “Regulation, productivity and growth,” Economic Policy, April, find that various measures of anticompetitive product market regulations significantly reduce TFP-growth at the industry level.
-
[12] N. Bloom, R. Sadun and J. Van Reenen (2007), “Americans do I.T. better: U.S. multinationals and the productivity miracle,” NBER Working Paper No. 13085.
-
[13] G. Nicoletti and S. Scarpetta (2005), “Regulation and economic performance: product market reforms and productivity in the OECD,” OECD Economics Department Working Paper No. 460.
-
[14] E.g. P. Aghion, N. Bloom, R. Blundell, R. Griffith and P. Howitt (2005), “Competition and innovation: an inverted U relationship,” Quarterly Journal of Economics 120, pp. 701-28.
-
[15] I. Dew-Becker and R. J. Gordon (2006), “The slowdown in European productivity growth: A tale of tigers, tortoises and textbook labor economics”, presented at NBER Summer Institute Macroeconomics and Productivity Workshop.
-
[16] A. Colecchia and P. Schreyer (2002), “ICT investment and economic growth in the 1990s: is the United States a unique case? A comparative study of nine OECD countries,” Review of Economic Dynamics 5, pp. 408-442.
-
[17] The survey based PMI indicator of productivity growth from the Purchasing Managers’ Survey (PMI) in the euro area private sector provides timely information about the direction of productivity growth in the euro area, i.e. whether productivity is increasing or decreasing, but not on the precise quantitative productivity growth rate.
-
[18] R.J. Gordon and I. Dew-Becker (2005), “Where Did the Productivity Growth Go? Inflation Dynamics and the Distribution of Income,” Brooking Papers on Economic Activity, no. 2. pp 67-127.
-
[19] R.M. Edge, T. Laubach and J. Williams (2007), “Learning and shifts in long-run productivity growth,” Journal of Monetary Economics, forthcoming.
-
[20] G. Amisano and O. Tristani (2007), “Uncertain productivity developments and the natural rate of interest”, mimeo, European Central Bank; R. Edge, T. Laubach and J. Williams (2003), “Monetary policy and the effects of a shift in the growth rate of technology”, mimeo, Federal Reserve Bank of San Francisco.
-
[21] A. Orphanides (2003), “The quest for prosperity without inflation”, Journal of Monetary Economics 50, 633-663.
-
[22] J.-C. Trichet (2007), “The need for structural reforms in Europe,” Jean Monnet Lecture to the Lisbon Council, Brussel, 4 June.
-
[23] OECD (2006), Education at a Glance.
-
[24] European Commission (2003), The EU economy: 2003 review, Chapter 3: Education, training and growth.
-
[25] Journal of Economic Perspectives 1988, Volume 2, Number 4.
Banc Ceannais Eorpach
Stiúrthóireacht Cumarsáide
- Sonnemannstrasse 20
- 60314 Frankfurt am Main, an Ghearmáin
- +49 69 1344 7455
- media@ecb.europa.eu
Ceadaítear atáirgeadh ar choinníoll go n-admhaítear an fhoinse.
An Oifig Preasa