


Published as part of the ECB Economic Bulletin, Issue 7/2022.
This box discusses the structural and cyclical factors behind the notable drop in euro area motor vehicle output since mid-2018 and the recent marked increase in car prices. Euro area motor vehicle output fell by 30.4% between June 2018 and August 2022, of which around 10% occurred before the start of the pandemic and 20% after. This pattern, which is common across the largest euro area countries, was not observed for other major international car producers such as South Korea, the United States and Japan, which recorded rather stable production levels before 2020 and a quicker recovery from the pandemic (Chart A). This box explains that this drop in motor vehicle output and the rise in car prices can be attributed to a combination of factors associated with the more stringent emissions tests implemented in the EU in 2018, the new EU regulation on carbon dioxide (CO2) emissions, the transition towards greener cars, supply chain disruptions, the rise in energy costs and, more recently, the uncertainty caused by the war in Ukraine.[1] The last three factors affected euro area automotive production more severely than foreign production, owing to the relatively higher participation of the euro area car sector in global supply chains, the greater dependence of the euro area on Russian energy supplies and the higher uncertainty generated by the euro area’s proximity to the war.
Chart A
Industrial production of motor vehicles across economies
(index: January 2018 = 100)

Sources: Eurostat, Federal Reserve System, Japanese Ministry of Economy, Trade and Industry and Statistics Korea.
Note: The latest observations are for August 2022.
The decline in motor vehicle activity began in mid-2018, driven by a drop in demand for cars with a combustion engine. The more stringent emissions tests implemented in the EU in 2018 and the EU agreement on CO2 emissions targets reached in December 2018 generated an incentive in favour of hybrid and electric cars at the expense of cars with combustion engines. Before the pandemic euro area car producers had intensified their efforts to increase local production and sales of hybrid and electric cars. However, the relatively higher prices of these models contained demand and the required changes in factories entailed production shortfalls. At the same time, expectations of tighter regulations on car emissions probably led to car purchases being postponed as consumers shifted their preferences towards hybrid and electric cars, weakening demand for motor vehicles.[2] A structural vector autoregression model confirms that the drop in motor vehicle output between 2018 and 2019 was driven mainly by a fall in demand for cars and non-energy related supply shocks, such as transport costs and the effects of directives and regulations on supply (Chart B, panel a).
Car production collapsed at the start of the pandemic. The lockdowns caused motor vehicle output to fall in the second quarter of 2020. Production recovered in the second half of 2020, but at the end of that year it was still 3.5% below pre-pandemic levels and 10-15% below the output recorded before the introduction of the EU emissions regulations in 2018.
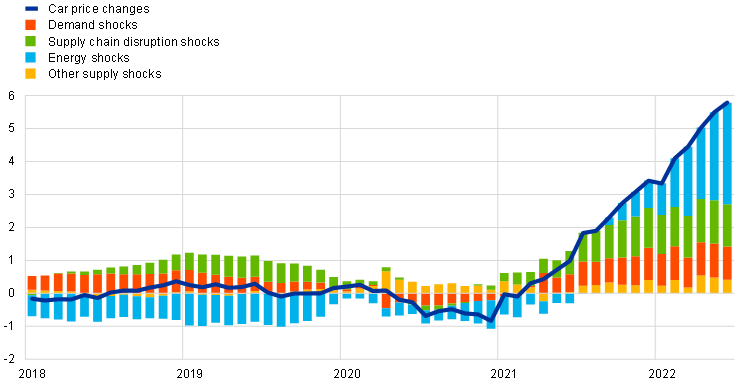
Chart B
Car output and changes in car prices – contribution of shocks
a) Motor vehicle production
(percentage deviation from trend)

b) Car prices
(year-on-year percentage point deviation from trend)
Sources: Eurostat, S&P Global and ECB staff calculations.
Notes: The model includes motor vehicle industrial production, car prices, Purchasing Managers’ Index (PMI) suppliers’ delivery times and energy prices. Shocks are identified using sign and narrative restrictions. Sign restrictions at impact: demand shocks imply car prices (+), motor vehicle production (+), and PMI suppliers’ delivery times (-); supply chain disruption shocks imply car prices (+), motor vehicle production (-) and PMI suppliers’ delivery times (-); energy shocks imply car prices (+), motor vehicle production (-) and energy prices (+); other supply shocks imply car prices (+) and motor vehicle production (-). Sign restrictions alone are not sufficient to identify the three different supply shocks. Narrative restrictions are included to obtain a full orthogonal system: the largest contribution to the forecast errors for PMI suppliers’ delivery times in April 2020 is attributed to supply chain disruption shocks, and the energy prices in September and October 2021 are attributed to energy shocks. For visualisation purposes the y-axis of the chart in panel a) does not fully display the developments in April 2020. For this period, demand shocks contributed most to the fall in industrial production, given the harsh lockdowns. Supply chain disruption shocks also contributed significantly, while energy shocks had a minimal negative contribution. Lower (higher) values for PMI suppliers’ delivery times imply longer (shorter) delivery times. The sample period covers the period from January 1999 to June 2022. The latest observations are for June 2022.
Since the beginning of 2021 motor vehicle output has been hit by supply chain disruptions and energy shocks, which have offset the positive demand effects from the reopening of the economy. In 2021 and 2022 motor vehicle output in the euro area was strongly affected by disruptions in global supply chains (Chart B, panel a), particularly the shortages of specific semiconductors and the logistical difficulties in the transport sector.[3] Historically high values for material and equipment shortages were recorded in 2021 and 2022.[4] A shortage of chips and other components needed to assemble new vehicles implied a reduction in supply, explaining most of the drop in car production from mid-2021. Euro area car producers were more severely affected by supply chain disruptions than their foreign competitors, owing to the relatively higher participation of the euro area car sector in global supply chains. Moreover, supply disruptions and lockdown measures were more severe in the euro area than in other regions.[5] Since the summer of 2021 the extraordinary increase in energy costs has also contributed to the decline in motor vehicle output (Chart B, panel a).[6] More recently, the uncertainty associated with the war in Ukraine has also been depressing demand for durable goods such as motor vehicles, as shown by the European Commission’s business and consumer survey.[7]
Car prices increased markedly as a result of supply chain disruptions, high energy costs and, to a smaller extent, a rise in demand. Since the second half of 2021 fewer new cars have reached the market on time, mainly owing to the lack of chips. This has caused consumers to turn to the second-hand car market.[8] Supply constraints and increasing consumer demand linked to the reopening of the economy have resulted in unusually large price increases in both the new and the second-hand car segments since mid-2021.[9] Subsequently, the higher costs resulting from the increase in energy prices were also passed on to consumers, with increases in car prices accelerating to 8.7% in August 2022. Without these supply chain disruptions and energy shocks, the changes in car prices would have amounted to less than half of those recorded (Chart B, panel b). Aggregate demand also contributed to the rise in car prices, albeit to a lesser extent.
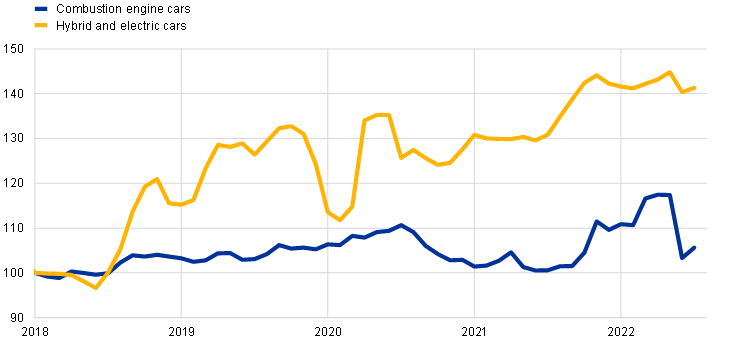
Supply disruptions and energy price shocks have played a key role in explaining the significant losses in euro area export volumes and export market shares over the past few years. The drop in euro area motor vehicle production is also reflected in euro area exports to the rest of the world (Chart C), which in July 2022 stood at 73% of their January 2018 levels.[10] The fall in exports has been particularly pronounced since mid-2021. Euro area export market share in volume terms has fallen substantially in 2021 and 2022 owing to euro area exporters being particularly hard hit by supply bottlenecks. However, euro area car makers maintained their market share in value terms (Chart D, panel a), suggesting a relatively strong increase in the prices charged by euro area exporters, which is reportedly associated with a reorientation of production towards more expensive models (Chart D, panel b).[11] This is notably on account of a compositional shift towards hybrid and electric cars, whose unit export value is higher than that of combustion engine cars.[12]
Chart C
Extra-euro area exports of cars
(volumes; index: January 2018 = 100)

Sources: Eurostat and ECB calculations.
Note: The latest observations are for July 2022.
Chart D
Euro area export market shares and export unit values in the car sector
a) Export market shares for all cars
(index: Q1 2018 = 100; three-month moving average)

b) Export unit values
(index: Q1 2018 = 100; three-month moving average)
Sources: Trade Data Monitor and ECB calculations.
Notes: Export market shares of euro area producers in world trade excluding the euro area (proxied by 83 partners). Export unit values refer to extra-euro area exports of cars. The latest observations are for July 2022.
Registrations of combustion engine cars have been dropping as green vehicles gain prominence. Similarly to output, on the demand side passenger car registrations have also exhibited a negative trend since mid-2018 (Chart E). This drop has been particularly sharp for combustion engine vehicles, with registration levels in the second quarter of 2022 58.4% lower than at the beginning of 2018. At the same time, demand for electric vehicles has been rising at a rapid pace. In the second quarter of 2022, 42.2% of all passenger car registrations were for either hybrid or fully electric vehicles, compared with 5.0% in mid-2018. This increase is broad-based across euro area countries and is particularly large in Finland, the Netherlands, Germany and Italy. While market shares of hybrid and electric cars skyrocketed after the outbreak of the pandemic, a notable rise in the share of these vehicles had already been observed in the third quarter of 2018, following the introduction of the EU legislation on emissions, and in the fourth quarter of 2019, before the start of the pandemic.
For euro area exporters, the green transition is key to their efforts to retain market share. As the production of hybrid and electric vehicles picked up, euro area producers also increased the volume exported outside the euro area, notably during the pandemic recovery period (Chart C), and charged higher prices for these cars than for cars with a combustion engine (Chart D, panel b).[13] The strong increase in hybrid and electric vehicle exports and the gains in export market shares for these vehicles helped cushion some of the euro area’s overall losses in export market shares. Euro area export market shares for hybrid and electric cars in value terms increased substantially, from about 27% of extra-euro area export market shares in January 2018 to 45% in July 2022. However, other global competitors may soon challenge the euro area’s relative technological advantage in the production of electric cars.
Chart E
Share of hybrid and electric vehicles and registration of vehicles by fuel type
(left-hand scale: percentages; index: Q1 2018 = 100; right-hand scale: annualised percentage point increases)

Sources: European Automobile Manufacturers’ Association and ECB staff calculations.
Notes: Data are based on a four-quarter moving average of non-seasonally adjusted data. The latest observations are for the second quarter of 2022.
A robust increase in motor vehicle output from the current low levels might be expected as the green transition progresses and supply bottlenecks and energy shocks ease. The new equilibrium will depend on consumer preferences, the importance of other means of transport and the ongoing shift of vehicle production to locations outside the euro area, which is likely to reflect pressures to compete internationally. However, the transition to a new equilibrium will only be gradual, as green mobility still requires significant infrastructure investment in the EU. As electric vehicles require fewer parts, fewer workers for assembly and more software-engineers, labour demand will gradually become geared towards fewer workers and a different skill set. Since the third quarter of 2021 there has been a significant fall in employment in the automotive manufacturing industry. This will need to be monitored closely to determine whether it is related to the factors mentioned, namely the successive reduction in automotive production over past few years and the less labour-intensive production process, or to idiosyncratic factors that will reverse over time.
Since September 2018 all new cars must be certified according to the Worldwide Harmonised Light Vehicle Test Procedure. This laboratory test is used to measure fuel consumption and CO2 emissions from passenger cars, as well as their pollutant emissions. For the regulation on CO2 emissions, see Regulation (EU) 2019/631 of the European Parliament and of the Council of 17 April 2019 setting CO2 emission performance standards for new passenger cars and for new light commercial vehicles, and repealing Regulations (EC) No 443/2009 and (EU) No 510/2011 (OJ L 111, 25.4.2019, p. 13).
Car registrations fell for three consecutive quarters from the fourth quarter of 2018, after more than two years of consecutive positive quarterly growth rates.
An exogenous increase in demand lengthens suppliers’ delivery times. However, the higher demand for hybrid and electric cars might imply an even higher elasticity, as the production of these vehicles requires a larger number of semiconductors.
For an analysis of supply bottlenecks in euro area manufacturing, see the box entitled “Sources of supply chain disruptions and their impact on euro area manufacturing”, Economic Bulletin, Issue 8, ECB, 2021.
See the box entitled “The impact of supply bottlenecks on trade”, Economic Bulletin, Issue 6, ECB, 2021.
Owing to its use of energy-intensive parts, the car sector ranks relatively highly among manufacturing sectors for its energy use. For an analysis of the energy intensity and dependence of the motor vehicle industry and other manufacturing segments, see the box entitled “Natural gas dependence and risks to activity in the euro area”, Economic Bulletin, Issue 1, ECB, 2022.
For an analysis of the macroeconomic implications of the uncertainty generated by the war in Ukraine, see the box entitled “The impact of the Russian invasion of Ukraine on euro area activity via the uncertainty channel”, Economic Bulletin, Issue 4, ECB, 2022.
Motor vehicle inflation reached 6.9% in August 2022, while second-hand motor vehicle inflation was 12.8%.
Another key factor putting pressure on prices in the second-hand car market is the postponement of new car purchases in view of the transition towards greener electric vehicles. While this reduces demand for new cars, the unprecedented increase in overall demand following the reopening of the economy still puts upward pressure on prices for new cars.
The sharp pick-up in export volumes in June can be explained almost entirely by a strong increase in off-road car exports (including for military purposes) from Slovakia to Ukraine (accounting for 78% of total extra-euro area car exports) following the lifting of duties and taxes on car imports to Ukraine.
The recent depreciation of the euro in effective terms and vis-à-vis the US dollar may have contributed to some extent to higher export prices in euro terms (and, in turn, to higher export market shares) – provided that some exchange rate pass-through took place – for the share of car export prices fixed in the destination’s currency or in US dollars, but not for car export prices fixed in euro (see Chen, N., Chung, W., and Novy, D., “Vehicle Currency Pricing and Exchange Rate Pass-Through”, Journal of the European Economic Association, Vol. 20, No 1, 2022, pp. 312-351). In 2021 slightly below one-half of extra-EU exports were invoiced in euro. In addition, for export market shares in value terms, the amount of the denominator (i.e. the value of imports of all destination markets expressed in euro) should increase as the euro depreciates, leading to a decline in export market shares.
Since the start of 2021 the unit value of hybrid and electric cars has been around 70% higher than that of combustion engine cars.
Electric and hybrid vehicles have contributed up to 50% of export unit values since the start of 2022, despite accounting for less than 30% of euro area car export volumes.