
- STATISTICAL RELEASE
Euro area economic and financial developments by institutional sector: fourth quarter of 2020
29 April 2021
- Euro area net saving decreased to €508 billion in four quarters to fourth quarter of 2020, from €549 billion one quarter earlier
- Household debt-to-income ratio increased to 96.3% in fourth quarter of 2020 from 93.8% one year earlier
- Non-financial corporations' debt-to-GDP ratio (consolidated measure) at 84.0% in fourth quarter of 2020, up from 76.8% one year earlier
Total euro area economy
Euro area net saving decreased to €508 billion (5.6% of euro area net disposable income) in 2020 compared with €549 billion in the four quarters to the previous quarter. Euro area net non-financial investment decreased to €274 billion (3.0% of net disposable income), due to decreased investment by non-financial corporations, and to a lesser extent households, while net investment by financial corporations and government slightly increased.
Euro area net lending to the rest of the world increased to €243 billion (from €225 billion previously) reflecting net non-financial investment declining more than net saving. Net lending of non-financial corporations increased from €62 billion to €134 billion (1.5% of net disposable income), that of financial corporations rose from €84 billion to €109 billion (1.2% of net disposable income) and net lending by households increased from €684 billion to €821 billion (9.1% of net disposable income). The increase in net lending by the total private sector was largely offset by an increase in net borrowing by the government sector (-9.1% of net disposable income, after -6.6% previously).
Chart 1. Euro area saving, investment and net lending to the rest of the world
(EUR billions, four-quarter sums)
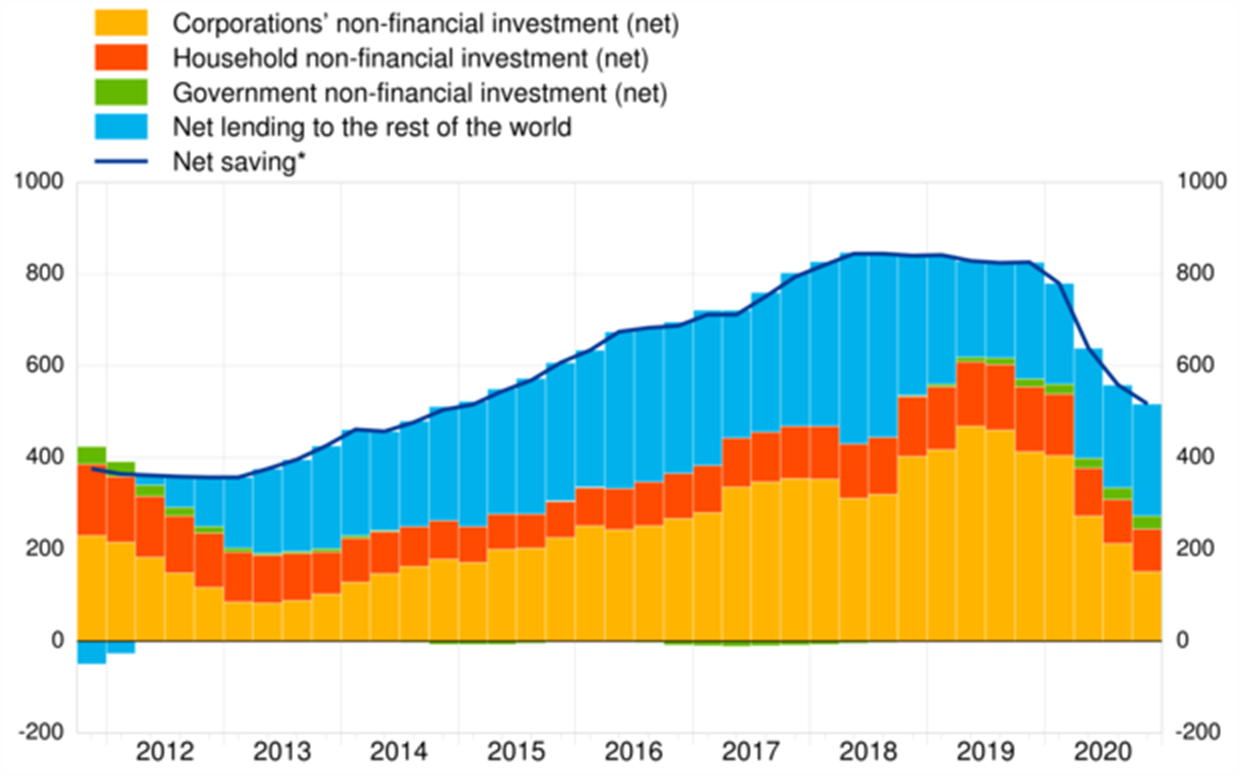
* Net saving minus net capital transfers to the rest of the world (equals change in net worth due to transactions).
Households
The annual growth rate of household financial investment increased to 4.1% in the fourth quarter of 2020, from 3.6% in the previous quarter. Investment in currency and deposits as well as in life insurance and pension schemes were the main contributors to this acceleration, while investment in shares and other equity grew at a broadly unchanged rate.
Households were net buyers of listed shares issued by all resident sectors and the rest of the world. Net purchases of listed shares issued by non-financial corporations grew at a broadly unchanged rate (5.6%), while net purchases of listed shares issued by the rest of the world accelerated (18.3% from 13.6% previously). Households continued to sell debt securities (in net terms) issued by all resident sectors and the rest of the world (see Table 1 below and Table 2.2. in the Annex).
Table 1. Financial investment and financing of households, main items
(annual growth rates)
Financial transactions |
|||||
2019 Q4 |
2020 Q1 |
2020 Q2 |
2020 Q3 |
2020 Q4 |
|
Financial investment* |
2.6 |
2.5 |
3.2 |
3.6 |
4.1 |
Currency and deposits |
5.1 |
5.2 |
6.4 |
6.9 |
7.9 |
Debt securities |
-10.8 |
-13.1 |
-10.8 |
-6.1 |
-7.6 |
Shares and other equity |
0.3 |
1.0 |
1.9 |
2.3 |
2.2 |
Life insurance and pension schemes |
2.7 |
2.0 |
1.7 |
1.4 |
1.8 |
Financing** |
4.1 |
3.5 |
3.2 |
3.2 |
2.9 |
Loans |
3.6 |
3.3 |
3.0 |
3.1 |
3.1 |
* Items not shown include: loans granted, prepayments of insurance premiums and reserves for outstanding claims and other accounts receivable.
** Items not shown include: financial derivatives’ net liabilities, pension schemes and other accounts payable.
Chart 2 below shows the stock of selected financial assets held by households (in dark blue) vis-à-vis counterpart sectors.[1] At the end of 2020, households’ financial assets with a counterpart sector breakdown were mostly liabilities of financial intermediaries such as MFIs (38% of households’ financial assets), insurance corporations (27%), pension funds (13%) and investment funds (12%). Direct holdings of financial assets issued by non-financial corporations (6%), government (1%) and the rest of the world (2%), e.g. in the form of listed shares and debt securities, represented much lower proportions of households’ financial assets.
Chart 2. Households’ financial assets by counterpart sector; selected financial instruments*
(2020 end of period stocks)

* Financial instruments for which the counterpart sector breakdown is available: deposits, loans, debt securities, listed shares and investment fund shares/units, as well as insurance, pension and standardised guarantee schemes (F.6). The counterpart sector breakdown for F.6 is estimated (See methodological note: Extension of the who-to-whom presentation to insurance and pension assets).
The household debt-to-income ratio[2] increased to 96.3% in the fourth quarter of 2020 from 93.8% in the fourth quarter of 2019, as disposable income grew slower than the outstanding amount of loans to households. The household debt-to-GDP ratio rose to 62.7% in the fourth quarter of 2020 from 57.8% in the fourth quarter of 2019 (see Chart 3), as debt increased and GDP declined.
Chart 3. Debt ratios of households and non-financial corporations
(debt as a percentage of GDP)
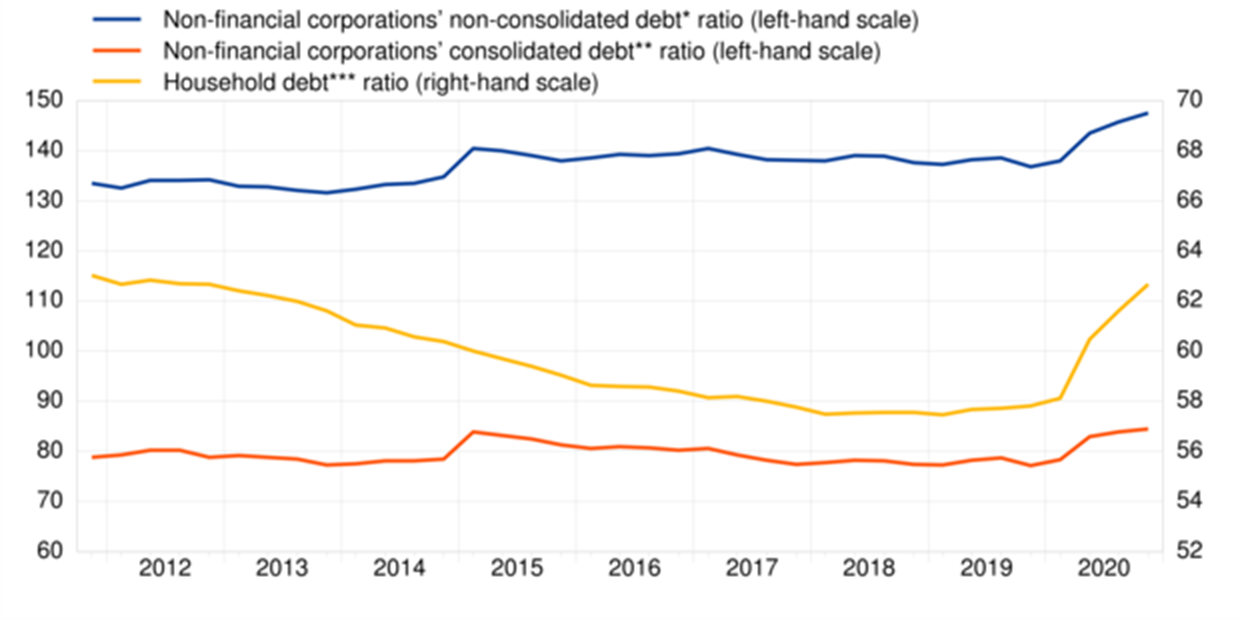
* Outstanding amount of loans, debt securities, trade credits and pension scheme liabilities.
** Outstanding amount of loans and debt securities, excluding debt positions between non-financial corporations.
*** Outstanding amount of loan liabilities.
Non-financial corporations
In the fourth quarter of 2020, the annual growth of financing of non-financial corporations stood at an unchanged rate of 1.9% compared with the previous quarter. Financing by loans from financial corporations other than MFIs accelerated, while financing by intercompany loans, debt securities, shares and other equity decelerated. Loans from MFIs remained broadly unchanged. Trade credits declined, though at a lower rate (see Table 2 below and Table 3.2 in the Annex).
Non-financial corporations' debt-to-GDP ratio (consolidated measure) increased to 84.0% in the fourth quarter of 2020, from 76.8% in the fourth quarter of 2019; the non-consolidated, wider debt measure increased to 147.6% from 136.8% (see Chart 3). The increases in these ratios were due to an increase in the debt of NFCs and a decline in GDP over this period.
Table 2. Financial investment and financing of non-financial corporations, main items
(annual growth rates)
Financial transactions |
|||||
2019 Q4 |
2020 Q1 |
2020 Q2 |
2020 Q3 |
2020 Q4 |
|
Financing* |
1.9 |
2.1 |
1.8 |
1.9 |
1.9 |
Debt securities |
6.1 |
4.3 |
10.4 |
9.8 |
9.5 |
Loans |
2.0 |
3.4 |
3.3 |
3.0 |
3.4 |
Shares and other equity |
1.4 |
1.2 |
1.1 |
1.3 |
1.0 |
Trade credits and advances |
2.0 |
1.0 |
-4.9 |
-2.8 |
-0.5 |
Financial investment** |
2.3 |
2.3 |
2.5 |
2.9 |
3.1 |
Currency and deposits |
5.8 |
9.7 |
18.3 |
20.1 |
18.7 |
Debt securities |
-8.9 |
-2.3 |
9.2 |
6.8 |
7.9 |
Loans |
1.6 |
0.5 |
-0.3 |
0.0 |
0.2 |
Shares and other equity |
2.1 |
2.1 |
2.1 |
2.1 |
1.7 |
* Items not shown include: pension schemes, other accounts payable, financial derivatives’ net liabilities and deposits.
** Items not shown include: other accounts receivable and prepayments of insurance premiums and reserves for outstanding claims.
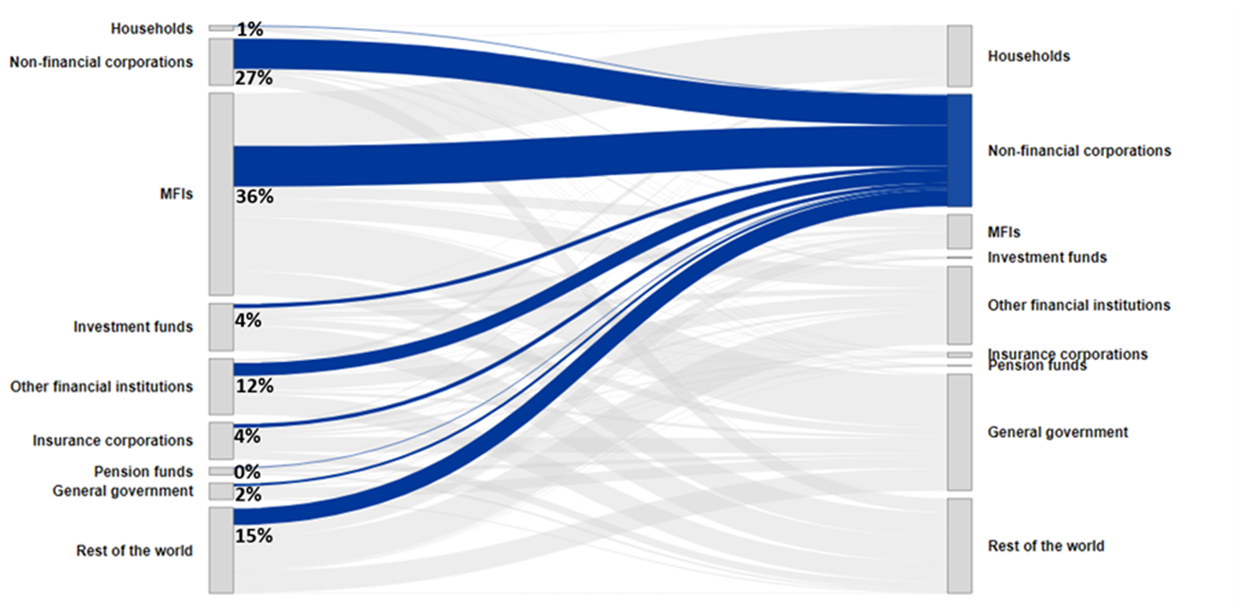
Chart 4 below shows the non-financial corporations’ debt (in dark blue) vis-à-vis counterpart sectors. At the end of 2020, the non-financial corporations’ debt in the form of loans and debt securities was held primarily by MFIs (36%), other non-financial corporations (27%), the rest of the world (15%) and other financial institutions (12%).
Chart 4. The main components of NFC debt (loans and debt securities) by counterpart sector
(2020 end of period stocks)
For queries, please use the Statistical information request form.
Notes
- These data come from a second release of quarterly euro area sector accounts from the European Central Bank (ECB) and Eurostat, the statistical office of the European Union. This release incorporates revisions and completed data for all sectors compared with the first quarterly release on "Euro area households and non-financial corporations" of 9 April 2021.
- The debt-to-GDP (or debt-to-income) ratios are calculated as the outstanding amount of debt in the reference quarter divided by the sum of GDP (or income) in the four quarters to the reference quarter. The ratio of non-financial transactions (e.g. savings) as a percentage of income or GDP is calculated as sum of the four quarters to the reference quarter for both numerator and denominator.
- The annual growth rate of non-financial transactions and of outstanding assets and liabilities (stocks) is calculated as the percentage change between the value for a given quarter and that value recorded four quarters earlier. The annual growth rates used for financial transactions refer to the total value of transactions during the year in relation to the outstanding stock a year before.
- The next release of the Household Sector Report containing results for the euro area and all EU countries is scheduled for 11 May 2021.
- Hyperlinks in the main body of the statistical release lead to data that may change with subsequent releases as a result of revisions. Figures shown in annex tables are a snapshot of the data as at the time of the current release.
- The production of quarterly financial accounts (QFA) may have been affected by the COVID-19 crisis. More information on the potential impact on QFA can be found here.
- This excludes financial instruments for which the counterpart sector breakdown is not available such as unlisted shares, other equity, and other accounts payable.
- Calculated as loans divided by gross disposable income adjusted for the change in pension entitlements.