
- PRESS RELEASE
- 10 January 2020
Euro area quarterly balance of payments and international investment position: third quarter of 2019
- The current account of the euro area showed a surplus of €338 billion (2.9% of euro area GDP) in the four quarters to the third quarter of 2019, down from €377 billion (3.3% of euro area GDP) a year earlier.
- As regards geographic counterpartsthe largest bilateral surpluses were recorded vis-à-vis the United Kingdom (€156 billion, which is the same as a year earlier) and the United States (€148 billion, up from €123 billion), and the largest deficit was recorded vis-à-vis China (€67 billion, marginally down from €68 billion).
- The international investment position of the euro area showed net liabilities of €126 billion (around 1% of euro area GDP) at the end of the third quarter of 2019, compared with net liabilities of €280 billion at the end of the previous quarter.
Current account
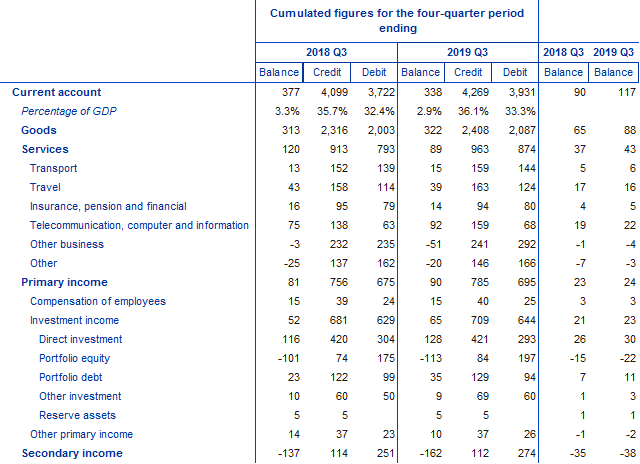
The current account of the euro area showed a surplus of €338 billion (2.9% of euro area GDP) in the four quarters to the third quarter of 2019, compared with a surplus of €377 billion (3.3% of euro area GDP) a year earlier (see Table 1). The decrease in the current account surplus reflected a lower surplus for services (down from €120 billion to €89 billion) and a higher deficit for secondary income (up from €137 billion to €162 billion). These developments were partly offset by increases in the surpluses for goods (from €313 billion to €322 billion) and primary income (from €81 billion to €90 billion).
The lower surplus in services resulted mainly from an increase in the deficit for other business services (from €3 billion to €51 billion), triggered by higher imports. This was partially compensated by an increase in the surplus for telecommunication, computer and information services (from €75 billion to €92 billion), which was driven by higher exports.
The increase in the primary income surplus was driven by developments in the investment income balance (up from €52 billion to €65 billion), which mainly reflected an increase in the direct investment income surplus (from €116 billion to €128 billion). On the other hand, a larger surplus for portfolio debt income (up from €23 billion to €35 billion) was offset by a larger deficit for portfolio equity income (from €101 billion to €113 billion).
Current account of the euro area
(EUR billions, unless otherwise indicated; transactions during the period; non-working day and non-seasonally adjusted)
Source: ECBNote: “Equity” comprises equity and investment fund shares. Discrepancies between totals and their components may arise from rounding.
Data on the geographic counterparts of the euro area current account (see Chart 1) show that in the four quarters to the third quarter of 2019 the euro area recorded the largest surpluses vis-à-vis the United Kingdom (€156 billion, which is the same as a year earlier), the United States (€148 billion, up from €123 billion), a residual group of other countries (€122 billion, up from €119 billion) and Switzerland (€50 billion, up from €48 billion). The largest bilateral deficits in the euro area current account were recorded vis-à-vis China (€67 billion, marginally down from €68 billion) and offshore centres (in this case the balance moved from a surplus of €1 billion to a deficit of €42 billion in the period under review).
The most significant geographic change in the goods balance in the four quarters to the third quarter of 2019 compared with the previous year was the increase in the goods surplus vis-à-vis the United States (from €151 billion to €171 billion). In services, the deficit vis-à-vis offshore centres increased from €50 billion to €88 billion. Moreover, the primary income balance vis-à-vis the United States moved from a deficit of €9 billion to a surplus of €2 billion, while in secondary income the increase in the deficit was mostly explained by transactions vis-à-vis Other EU countries (up from €79 billion to €100 billion).
Geographical breakdown of the euro area current account balance
(Four-quarter moving sums in EUR billions; non-seasonally adjusted)
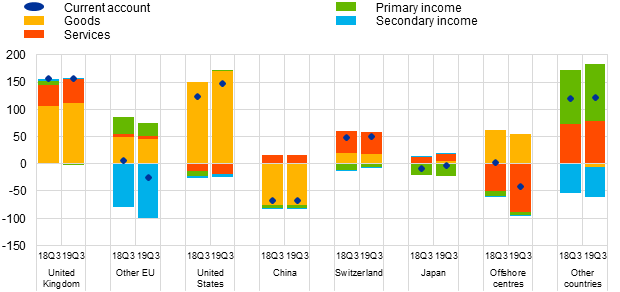
Source: ECB.Note: “Other EU” comprises EU Member States and EU institutions outside the euro area excluding the United Kingdom.
International investment position
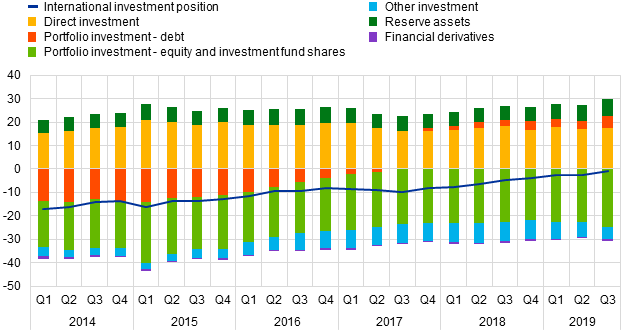
At the end of the third quarter of 2019 the international investment position of the euro area recorded net liabilities of €126 billion vis-à-vis the rest of the world (around 1% of euro area GDP), compared with net liabilities of €280 billion in the previous quarter (see Chart 2 and Table 2).
Net international investment position of the euro area
(Net outstanding amounts at the end of the period as a percentage of four-quarter moving sums of GDP)
Source: ECB.
This improvement of €154 billion mainly reflected higher net assets for direct investment (€2,061 billion, up from €1,983 billion), portfolio debt (€621 billion, up from €431 billion) and reserve assets (€827 billion, up from €771 billion), as well as lower net liabilities for other investment (€632 billion, down from €724 billion). These developments were only partially offset by higher net liabilities for portfolio equity (€2,914 billion, up from €2,666 billion).
International investment position of the euro area
(EUR billions, unless otherwise indicated; amounts outstanding at the end of the period, flows during the period; non-working day and non-seasonally adjusted)
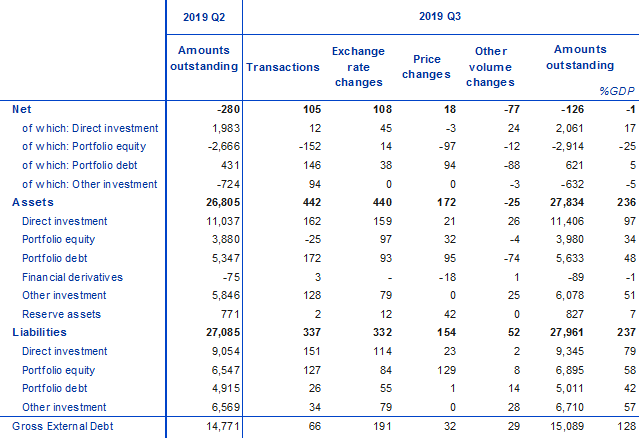
Source: ECB.Notes: “Equity” comprises equity and investment fund shares. Net financial derivatives are reported under assets. Discrepancies between totals and their components may arise from rounding.
The improvement in the euro area’s net international investment position in the third quarter of 2019 was driven by transactions and positive net exchange rate revaluations and, to a lesser extent, by positive net price changes, which were partly offset by negative net other volume changes (see Chart 3).
Net assets for direct investment increased primarily due to positive net exchange rate revaluations, other volume changes and net transactions (see Table 2). Larger net assets for portfolio debt resulted mainly from net transactions and positive net revaluations due to both exchange rates and (other) price changes, which were partly offset by negative net other volume changes, arising particularly on the asset side. Net liabilities for other investment declined mainly due to positive net transactions, while the increase in reserve assets resulted largely from positive net price changes.
The increase in net liabilities for portfolio equity was driven by negative net transactions and price changes.
At the end of the third quarter of 2019 the gross external debt of the euro area amounted to €15.1 trillion (around 128% of euro area GDP), which represents an increase of €318 billion compared with the previous quarter.
Changes in the net international investment position of the euro area
(EUR billions; flows during the period)
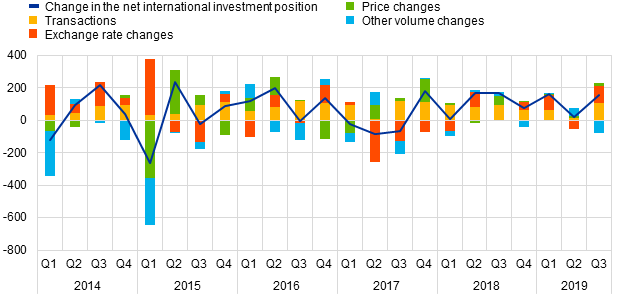
Source: ECB.Note: “Other volume changes” mainly reflects reclassifications and data enhancements.
Data revisions
This press release incorporates revisions to the data for all the reference periods between the first quarter of 2018 and the second quarter of 2019. The revisions to direct investment and portfolio investment were particularly sizeable and reflect revised national contributions to the euro area aggregates, in particular as a result of incorporating newly available information.
Next press releases
- Monthly balance of payments: 17 January 2020 (reference data up to November 2019)
- Quarterly balance of payments and international investment position: 7 April 2020 (reference data up to the fourth quarter of 2019)
For media queries, please contact Philippe Rispal, tel.: +49 69 1344 5482.
Notes
- All data are neither seasonally nor working day-adjusted. Ratios to GDP (including in the charts) refer to four-quarter sums of non-seasonally and non-working day-adjusted GDP figures.
- Hyperlinks in the press release refer to data that may change with subsequent releases as a result of revisions.
Banc Ceannais Eorpach
Stiúrthóireacht Cumarsáide
- Sonnemannstrasse 20
- 60314 Frankfurt am Main, an Ghearmáin
- +49 69 1344 7455
- media@ecb.europa.eu
Ceadaítear atáirgeadh ar choinníoll go n-admhaítear an fhoinse.
An Oifig Preasa