
The ECB Survey of Professional Forecasters - Second quarter of 2020
Summary
The results of Q2 2020 ECB Survey of Professional Forecasters (SPF) have to be seen in the context of the outbreak of the coronavirus (COVID-19) pandemic and subsequent mitigation measures.[1] Expectations for euro area inflation, growth and unemployment were all changed sharply. HICP inflation expectations stand at 0.4%, 1.2% and 1.4% for 2020, 2021 and 2022, respectively. Compared with the previous (Q1 2020) round, these are revised down by 0.8, 0.2 and 0.1 percentage points respectively. These revisions mainly reflect a combination of a changed profile for oil price assumptions and the weaker economic outlook. Respondents reported increased overall uncertainty surrounding the outlook for inflation and considered that the balance of risks was largely to the downside. However, longer-term inflation expectations (for 2024) remained at 1.7%. Real GDP growth expectations for 2020 were revised down by 6.6 percentage points to -5.5%. Although real GDP growth is expected to recover somewhat in 2021 (+4.3%) and normalise gradually thereafter, even by the longer-term horizon (2024), the level of GDP has been revised down from the previous round by approximately 3%. Uncertainty has increased considerably across all horizons and the balance of risks is generally reported as being to the downside. Respondents expect a sharp increase in the unemployment rate in 2020 with a steady but gradual decline thereafter.
Table 1
Results of the SPF in comparison with other expectations and projections
(annual percentage changes, unless otherwise indicated)
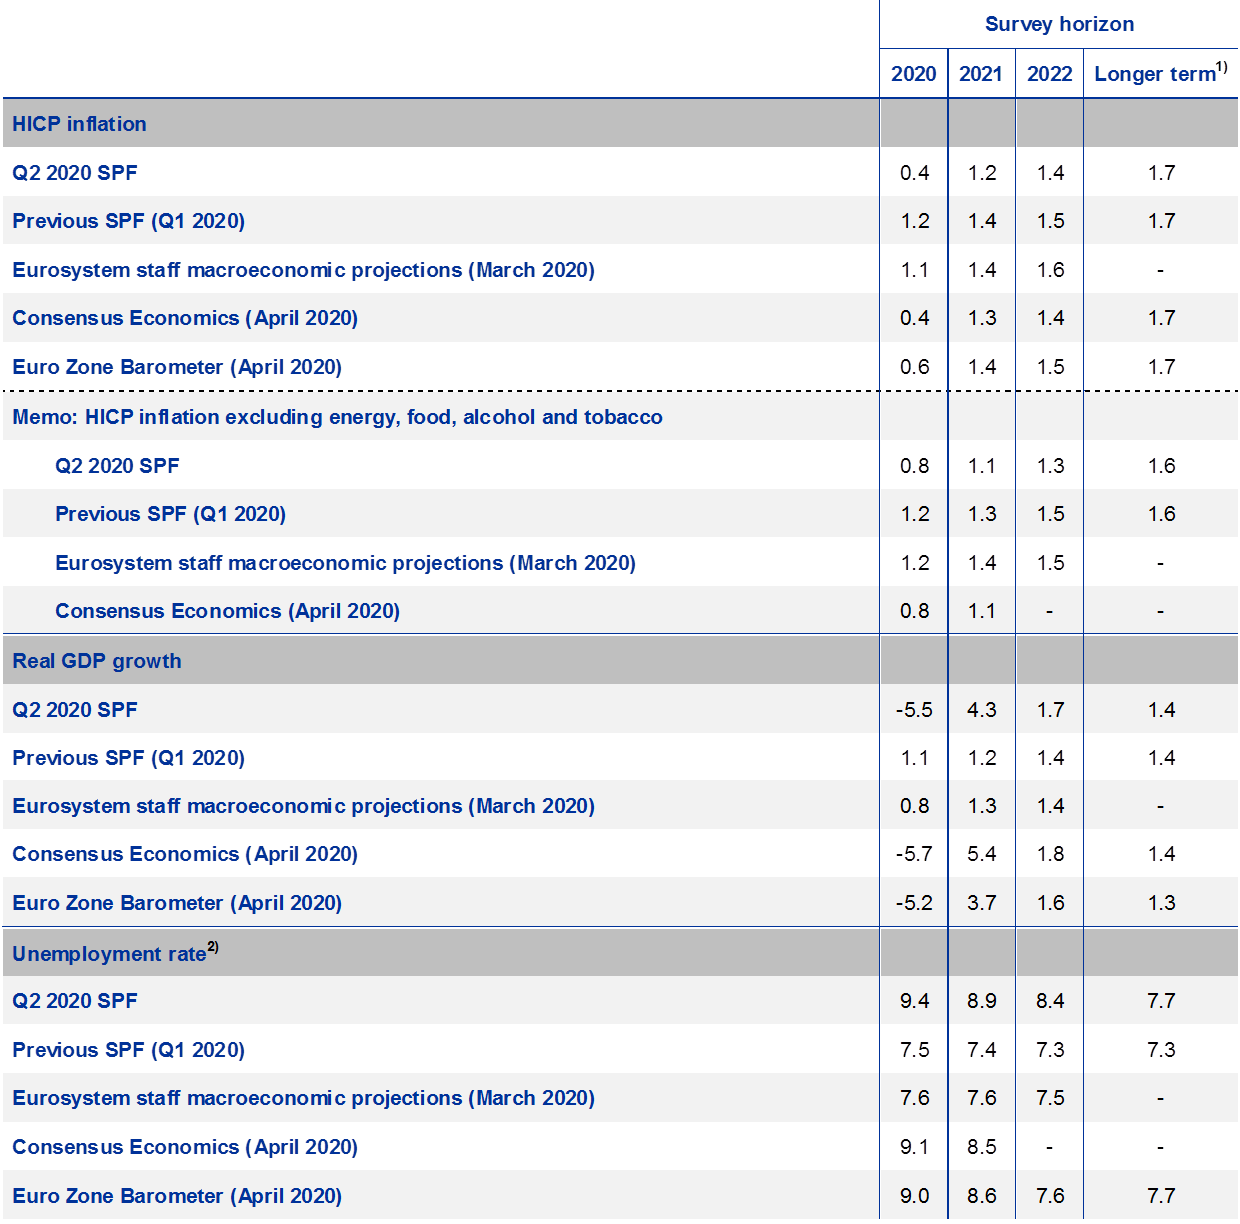
1) Longer-term expectations refer to 2024.
2) As a percentage of the labour force.
1 The coronavirus – respondents’ assumptions, baselines and risks surrounding its economic impact
When answering a special question on the economic impact of the coronavirus,[2] it appeared that, on average, respondents expected strict restrictions to remain in place until end-April with only a gradual relaxation thereafter. They believed a large degree of normality is not likely to return until the third quarter (and even then specific restrictions are likely to continue). A sharp drop in activity in March and April is the average baseline expectation. While some pickup in activity is expected from May onward, respondents considered this would likely be gradual and pre-virus levels of activity are not likely to be reached until 2022 (a flat and elongated ‘tick-mark’ profile rather than a ‘V’ or ‘L’).[3] The forecasts imply that the level of activity in 2024 will still be around 3% lower than was forecast before the virus. Although respondents see both down and upside risks to activity, they considered them to be to the downside on balance, particularly should further ‘waves’ of lockdowns be required. Regarding the impact on inflation, they deemed that the demand effects are likely to outweigh the supply-side effects. In more detail:
- Regarding key coronavirus-related assumptions (e.g. lockdown duration, shape of path to normality, etc.), although there was variety regarding the specific details, there was relatively wide agreement that strict restrictions are likely to remain in place until at least end-April before being eased over the remainder of the second quarter (May and June). Most respondents also indicated that any normalisation will likely be gradual and that normality (even to an approximation) will probably not be reached until the third quarter. Some also indicated that they expected specific restrictions to continue (e.g. for international travel and particular sectors – for example, restaurants and bars, public events, etc.) for a longer period of time. Some considered that the timeline of restrictions in China might provide some indication as to the likely evolution in Europe. It was also noted that individual countries within Europe will likely differ in terms of their timelines for normalisation, reflecting the fact that they differed in terms of the start of the spread and in terms of the timeline and intensity of the diffusion of the virus.
- Most respondents expect a very sharp drop in economic activity toward the end of Q1 and into Q2. While most expect an increase during the course of Q2 and into Q3, this increase is generally not expected to counteract the initial decline. The most appropriate description for the forecast profile of the overall GDP level is probably a ‘tick-mark’ – i.e. a sharp downward movement at the end of Q1 and at the beginning of Q2, with a flat and elongated recovery that takes quite some time to get back to pre-virus levels (see Chart 1). In fact, according to the SPF, during the whole forecasting horizon (which ends in 2024), the level of real GDP will remain below the level expected in the January SPF survey round.
Chart 1
Forecast profile of real GDP level
(2019 = 100)
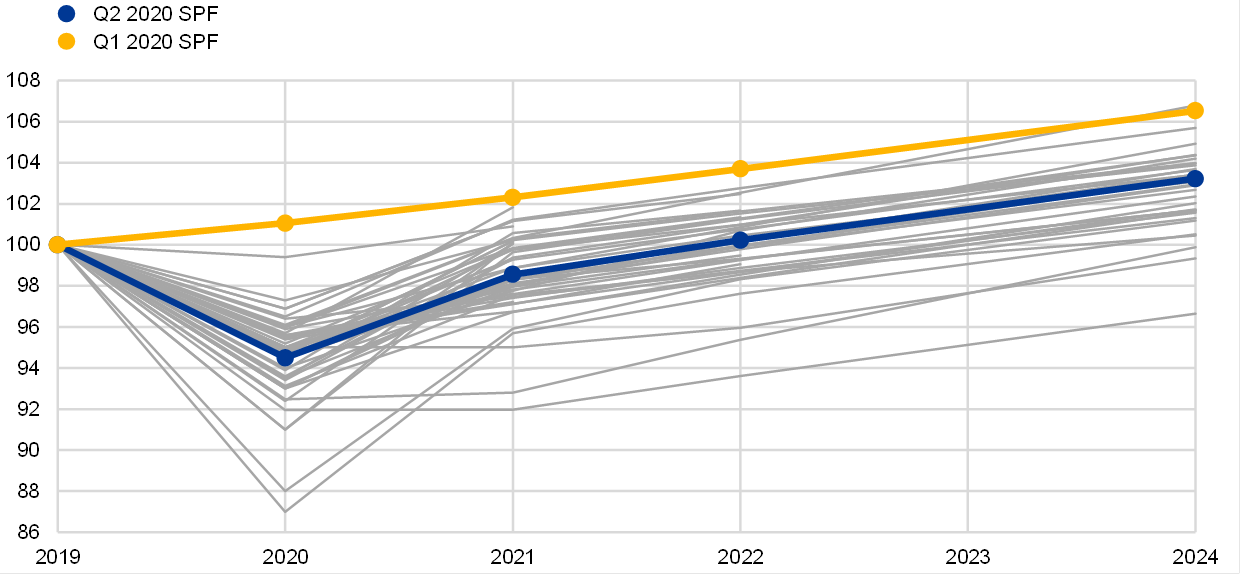
Note: Grey lines denote individual forecaster profiles
- Regarding the time required to get closer to pre-virus levels of economic activity, respondents generally noted that, although activity would likely pick up strongly once the lockdowns end, most considered it would take some time to get back to normal. Compared with the Q1 2020 round, the aggregate GDP growth projections for 2020 have been revised down by 6.6 percentage points and those for 2021 and 2022 have been revised up by 3.1 and 0.3 percentage points. In terms of GDP levels, on average respondents expected that GDP would not return to its 2019 level until 2022 and that, by 2024, the level of GDP would still be more than 3% lower than implied in the Q1 2020 round. It was also noted that the time required for a return to normality will depend on the sector. Some sectors, e.g. manufacturing and construction, might be able to return to close to normal by Q3 or Q4 2020, whereas others, e.g. tourism and services, might not return to normal until after a vaccine has been successfully developed and rolled-out.
- Regarding risks to real GDP growth, most saw them as being to the downside. This related to the impact of the shutdown measures themselves, to the possibility that this impact might be more prolonged than is currently assumed, and to the risk that a return of the virus might necessitate further lockdowns (and the associated impact this might have on confidence amid the fragile economic situation).
- Regarding the role of demand versus supply factors on inflation, generally respondents considered that the (negative) demand effects would be more important than possible supply-side effects. The latter were also likely to be sector specific (most notably for food) and largely operating in the near-term. The direct impact via oil prices was specified as an important channel on the inflation outlook. Some respondents did indicate that factors like de-globalisation and the re-thinking of supply chains could provide some inflationary tendencies (although demand factors were largely considered dominant).
2 HICP inflation expectations for shorter horizons revised sharply down
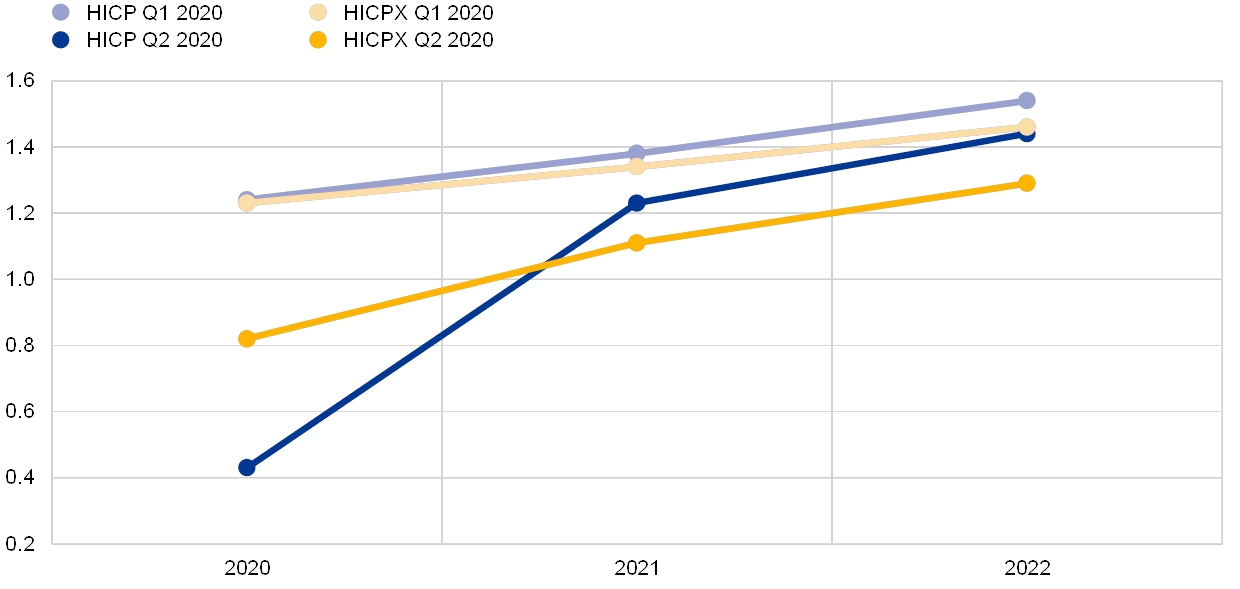
SPF respondents revised down, compared to the previous round, their inflation expectations for the period 2020-21 mainly owing to a combination of a changed profile for oil price assumptions and the weaker economic outlook. Averages of SPF respondents’ point forecasts for annual HICP inflation stand at 0.4%, 1.2% and 1.4%, for 2020, 2021 and 2022, respectively (see Chart 2). These represent downward revisions of 0.8, 0.2 and 0.1 percentage points, respectively. Respondents’ assumptions imply a much lower starting point for crude oil prices (around 30 US dollars per barrel in Q2 compared with 60 US dollars previously) but an upward profile (previously a slightly downward sloping profile was assumed). See Section entitled “Expectations for other variables” for further details. Although respondents noted that some sectors may experience higher prices reflecting supply factors and scarcity, they consider that negative demand impact would outweigh these in aggregate. The profile of inflation expectations is now considerably lower than that of the March 2020 ECB staff Macroeconomic Projection Exercise (MPE) (which was finalised in February before mitigation measures were put in place) but broadly similar to those of the more recent April 2020 Consensus Economics and Euro Zone Barometer (see Table 1).
Expectations for inflation excluding energy, food, alcohol and tobacco (HICPX) were revised down for 2020, 2021 and 2022 although they continue to forecast a gradual upward movement (see Chart 2). Expectations for HICPX were revised down by 0.4 percentage points for 2020 and by 0.2 percentage points for both 2021 and 2022. Although respondents generally did not elaborate on the main factors underlying their inflation forecasts, the downward revisions clearly reflect the impact of the lower forecasts for the level of economic activity. The combination of a changed profile for assumed oil prices and weaker activity also helps explain the differences in the pattern of revisions to headline inflation and to HICPX, with revisions to the former being larger in 2020, but smaller in 2022. The SPF forecasts for HICPX are in line with those in the April 2020 Consensus Economics but considerably lower than those from the March 2020 MPE. The March MPE projections were broadly similar to those in the Q1 2020 SPF.
Chart 2
Inflation expectations: overall HICP and HICP excluding energy, food, alcohol and tobacco
(annual percentage changes)
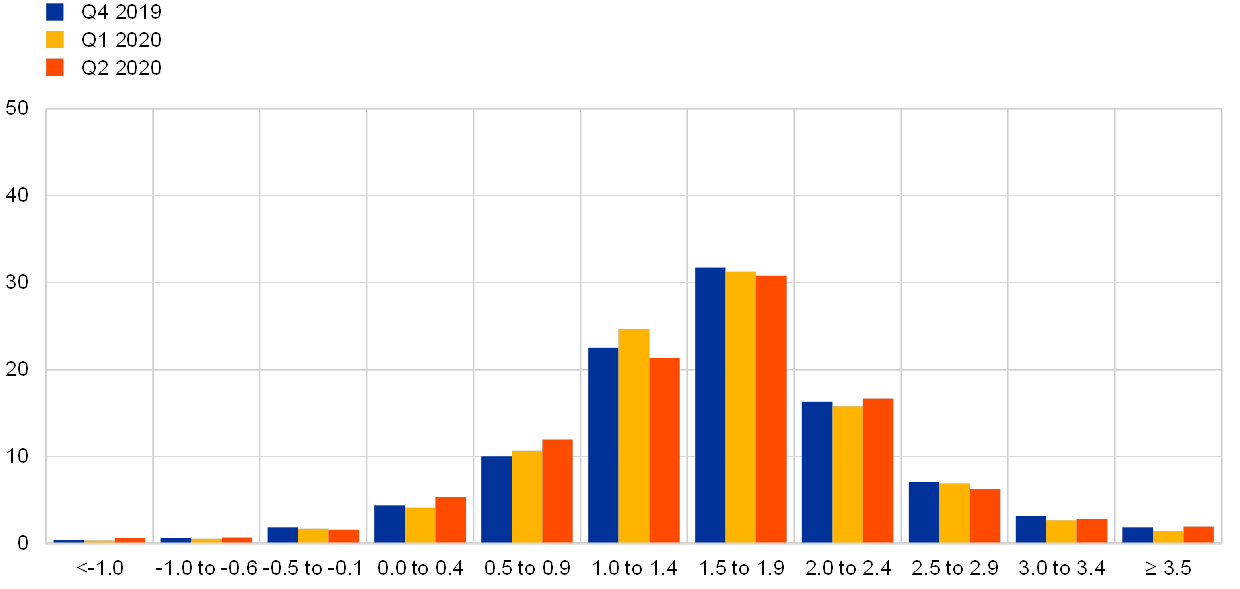
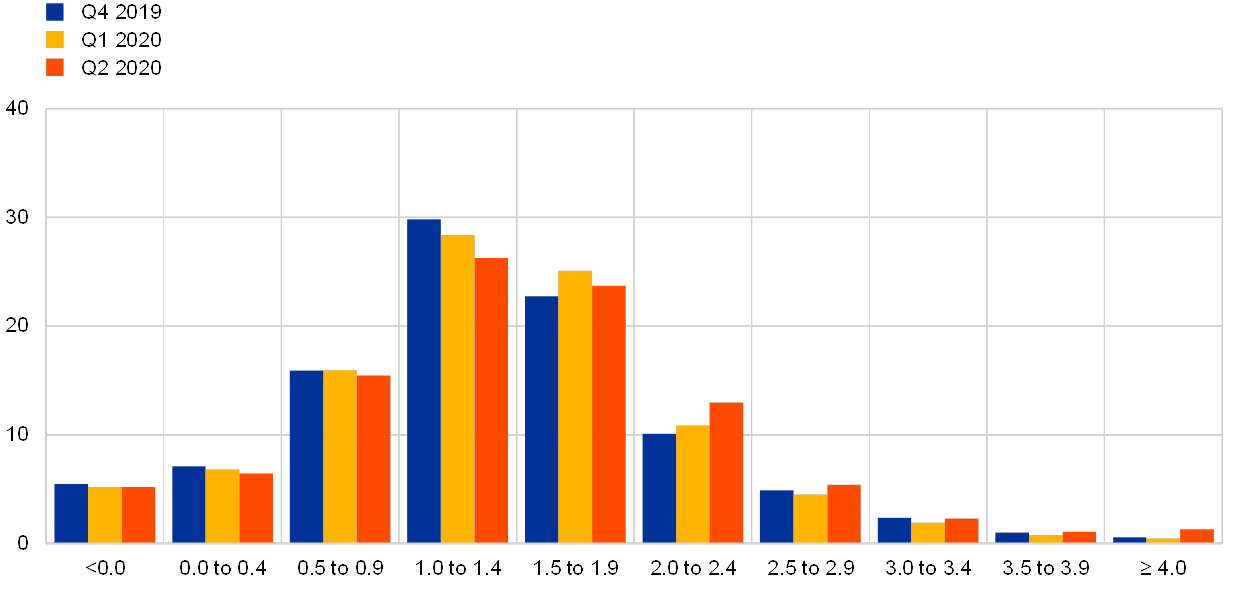
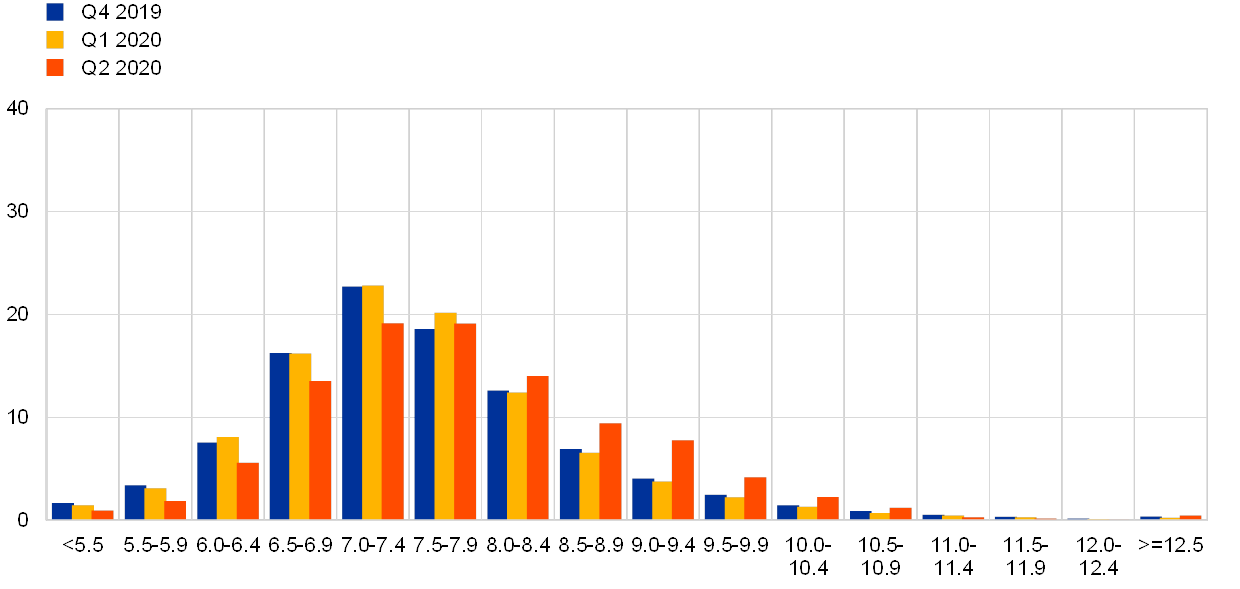
Respondents reported increased overall uncertainty surrounding the outlook for inflation and considered that the balance of risks was largely to the downside. Quantitative indicators of uncertainty for inflation derived from the reported probability distributions increased for all horizons but most noticeably for the shorter horizons.[4] For these horizons (particularly those for 2020), the increase in ‘aggregate uncertainty’ owed mainly to an increase in ‘disagreement’ across forecasters, which was much larger than the increase in ‘individual uncertainty’. For the longer horizons, the increase in aggregate uncertainty reflected a more similar increase in both disagreement and ‘individual uncertainty’.[5] The aggregate probability distributions for the calendar years 2019-2021 are presented in Chart 3).
Chart 3
Aggregate expected probability distributions for inflation in 2020, 2021 and 2022
(x-axis: HICP inflation expectations, annual percentage changes; y-axis: probability, percentages)
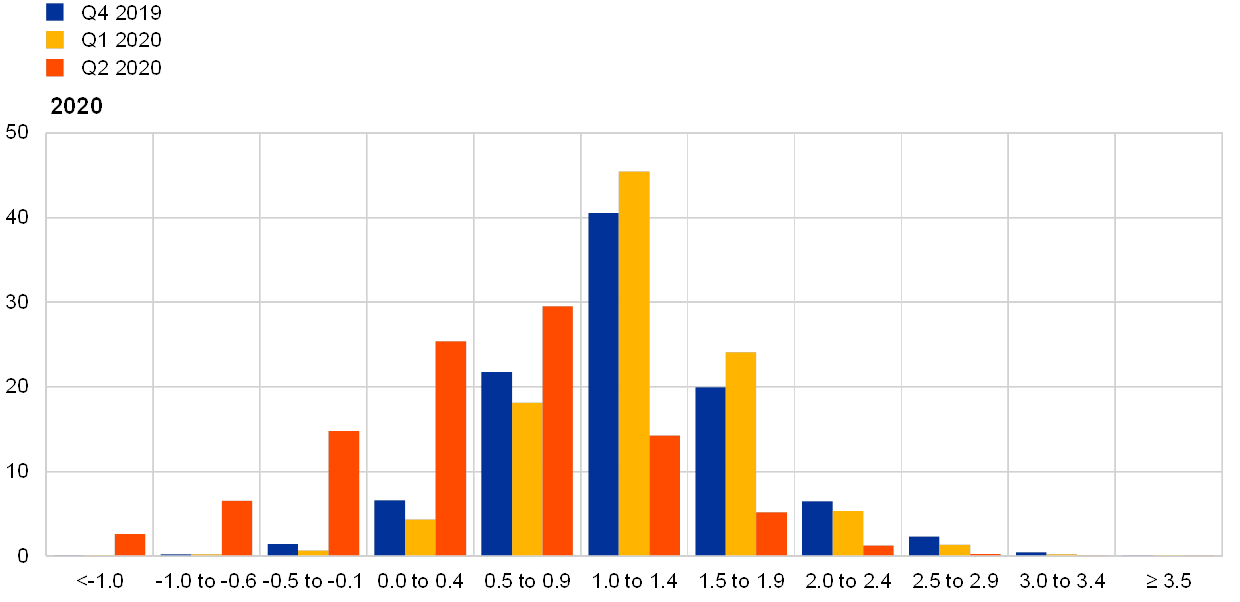
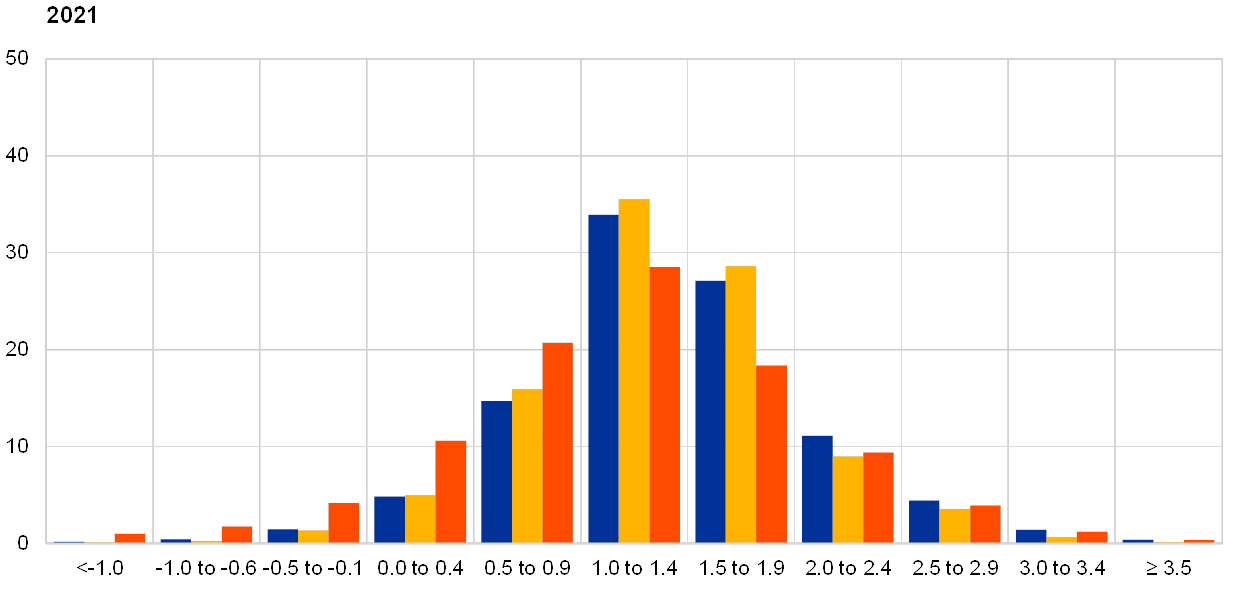
Note: The SPF asks respondents to report their point forecasts and to separately assign probabilities to different ranges of outcomes. This chart shows the average probabilities they assigned to different ranges of inflation outcomes in 2020, 2021 and 2022.
3 Average longer-term inflation expectations unchanged at 1.7% but with increased downside risks
Average longer-term inflation expectations remained largely unchanged at 1.7%. Notwithstanding the substantial downward revisions to inflation forecasts over the 2020-22 horizon, longer-term expectations were not substantially changed, with the average point expectation remaining at 1.7%. However, some summary statistics declined to new lows – for example the median point forecast dropped to 1.6% and the estimated mean of the aggregate probability distribution edged down to 1.55% (from 1.57%) – see Chart 4. The distribution of individual point forecasts tilted further to values below 1.7%, with the modal value being 1.6% – see Chart 5. The longer-term expectations for HICP inflation excluding energy, food, alcohol and tobacco (HICPX) also remained unchanged, staying at 1.6%.
Chart 4
Longer-term inflation expectations
(annual percentage changes)
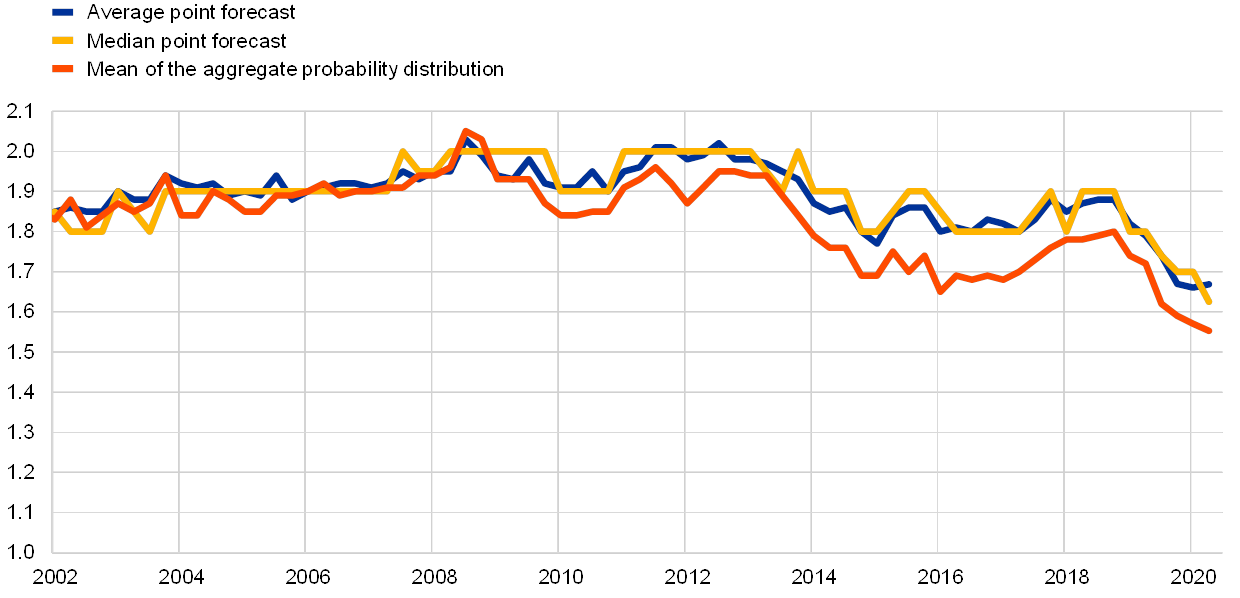
Chart 5
Distribution of point expectations for HICP inflation in the longer term
(x-axis: HICP longer-term inflation expectations, annual percentage changes; y-axis: percentages of respondents)
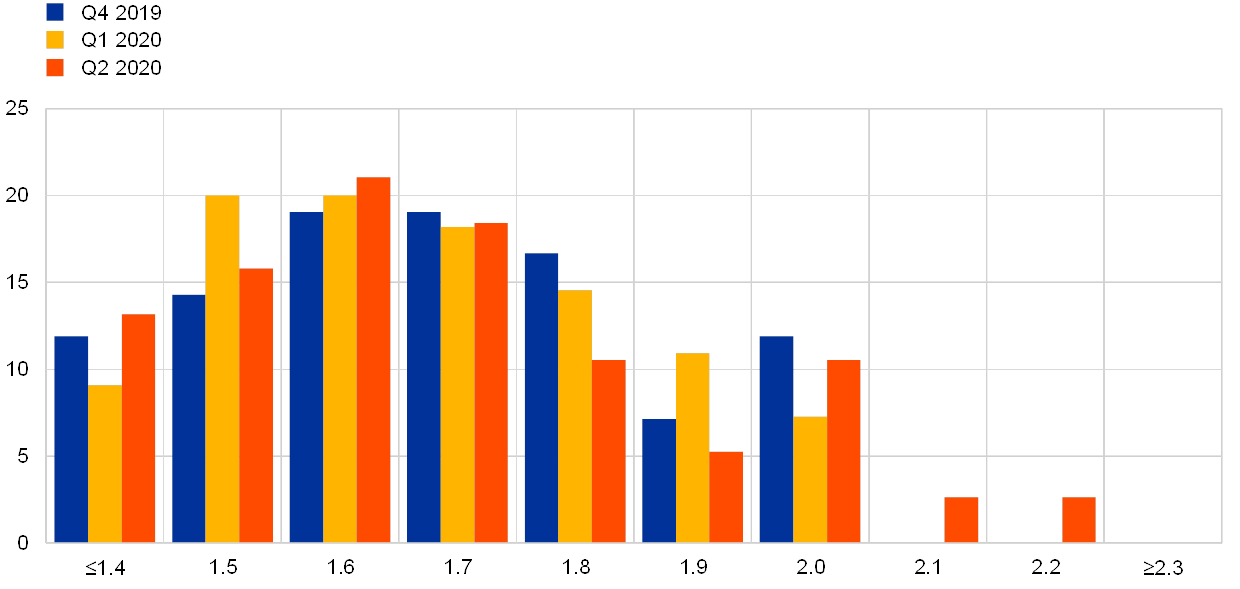
Notes: The SPF asks respondents to report their point forecasts and to separately assign probabilities to different ranges of outcomes. This chart shows the spread of point forecast responses.
Perceptions of uncertainty surrounding longer-term inflation expectations increased slightly and the balance of risks moved sharply further to the downside. In line with their overall assessment that uncertainty has risen, the width of forecasters’ probability distributions for inflation in the longer term increased to a new high level – see Chart 6. Having gradually narrowed since 2016, the balance of risks moved sharply further to the downside. The probability associated with longer-term inflation being negative increased slightly (to 2.9% from 2.6%).
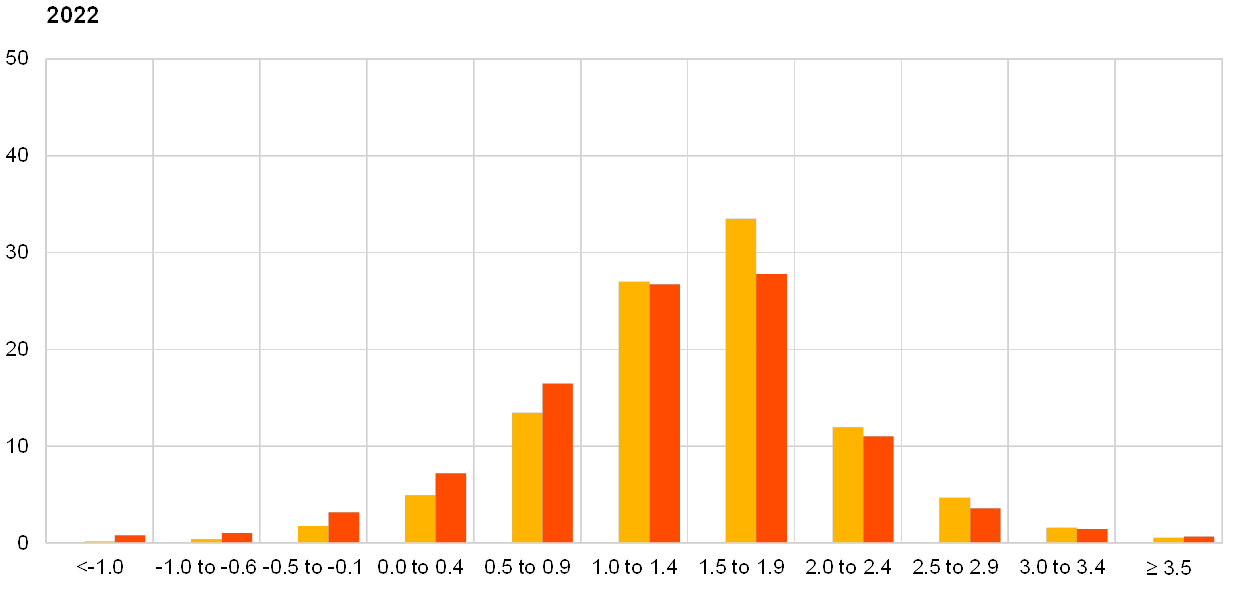
Chart 6
Aggregate probability distribution of longer-term inflation expectations
(x-axis: HICP inflation expectations, annual percentage changes; y-axis: probability, percentages)
Notes: The SPF asks respondents to report their point forecasts and to separately assign probabilities to different ranges of outcomes. This chart shows the average probabilities they assigned to different ranges of inflation outcomes in the longer term.
4 Real GDP growth expectations for current and next year revised significantly
SPF GDP growth expectations now stand at -5.5% for 2020, +4.3% for 2021 and at +1.7% for 2022 (see Chart 7). These imply a downward revision of -6.1 percentage points for 2020 and an upward revision of 3.1 percentage points for 2021. The magnitude of these revisions from one round to the other is unprecedented and far stronger than during the Great Financial Crisis, when forecasters adjusted more slowly.[6] For both horizons there is large disagreement among forecasters, with standard deviations over the point forecasts standing at 2.1 percentage points for 2020 and 2.4 percentage points for 2021. For 2020, more than half of respondents expect euro area GDP to decrease by between 4% and 6% annually, while for 2021 around 40% expect euro area GDP to increase by between 4% and 6% annually. For 2022 point forecasts have been revised up on average by 0.3 percentage points Longer-term growth expectations (which refer to 2024) remained stable at 1.4%. Notwithstanding the upward revisions for 2021, 2022 and 2024, the level of GDP by 2024 is expected to be approximately 3% lower than expected in the 2020 Q1 SPF. Compared with the SPF, the April 2020 Consensus Economics has a slightly sharper slowdown in 2020 but more of a rebound in 2021 and 2022, whereas the Euro Zone Barometer has a milder slowdown but the subsequent rebound is also milder – see Table 1.
Chart 7
Expectations for real GDP growth
(annual percentage changes)
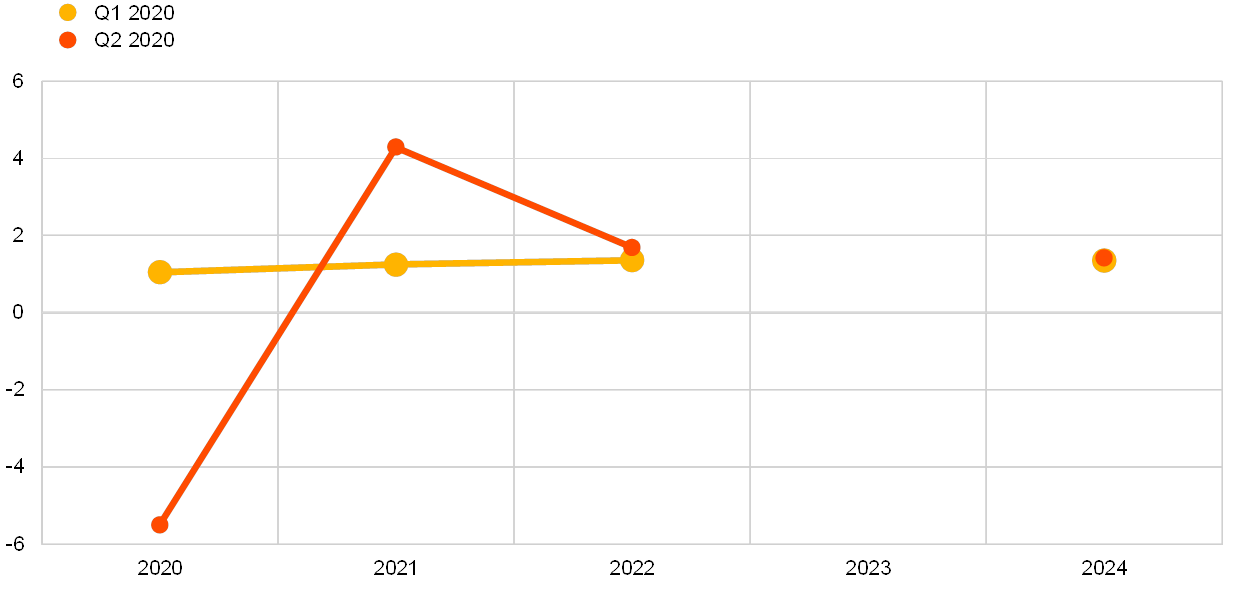
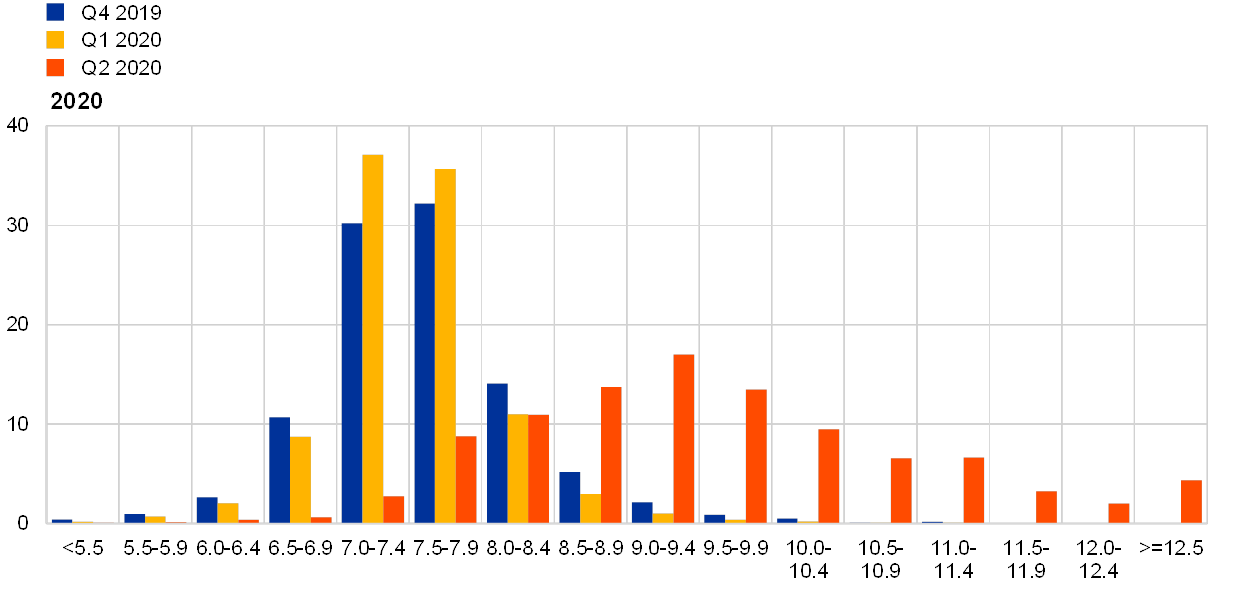
Chart 8
Aggregate probability distributions for GDP growth expectations for 2020, 2021 and 2022
(x-axis: real GDP growth expectations, annual percentage changes; y-axis: probability, percentages)
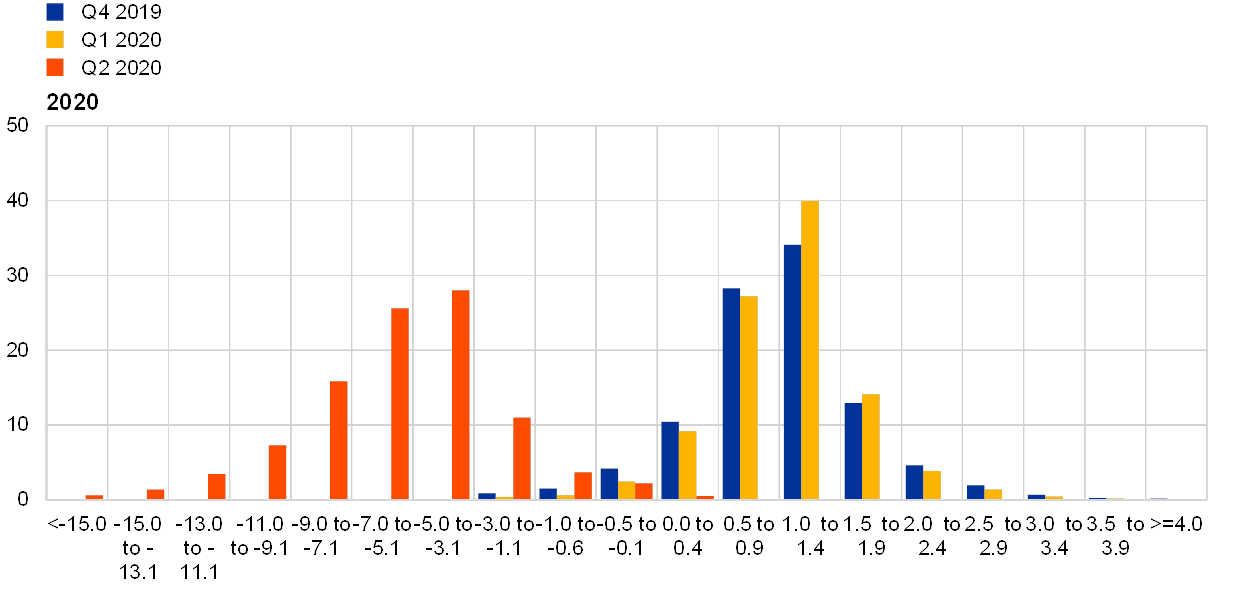

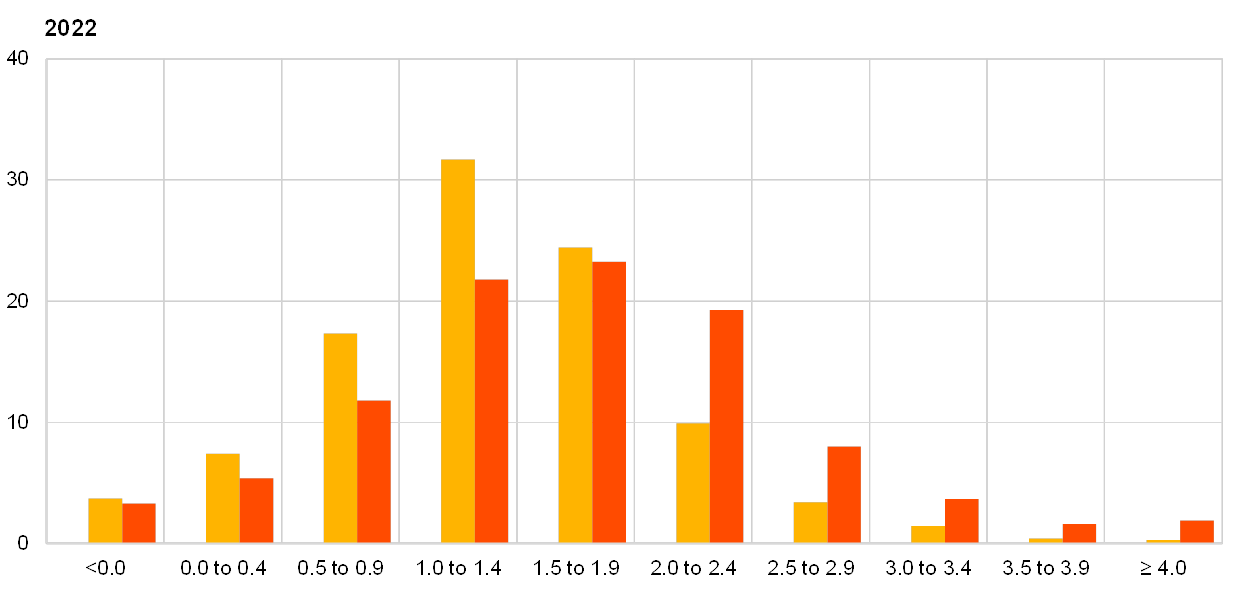
Notes: The SPF asks respondents to report their point forecasts and to separately assign probabilities to different ranges of outcomes. This chart shows the average probabilities they assigned to different ranges of real GDP growth outcomes in 2020, 2021 and 2022. In anticipation of the expected substantial revisions to the growth outlook and the considerable uncertainty surrounding them (e.g. depending on the length of confinement measures and the evolution of the spread of the virus), the SPF questionnaire was adjusted to allow for a significantly wider range of the probability distributions, with bins of 2 percentage points width surrounding the regular bins of previous rounds (i.e. <-1.0% and >4.0%).
The perceived individual uncertainty has increased considerably across horizons and the balance of risks is generally reported as being to the downside. The respondents’ qualitative risk comments focused almost entirely on the coronavirus pandemic and its impact. These comments describe risks as being, on balance, to the downside. Respondents mentioned longer than expected lockdown measures as the main downside risk, which could harm the economy further and cause second-round effects on demand and the stability of the financial system. Chart 8 and Chart 9 present the aggregate probability distributions for GDP growth for 2020-22 and 2024 respectively.[7] For 2020 the highest probability is assigned to an annual decrease in GDP between -3.1% and -5% (28%), but uncertainty is high and a large mass of the aggregate probability distribution is spread widely, with 80% assigned to outcomes ranging from as low as -9.0% to -1.1%. Uncertainty is also high regarding the expected recovery in 2021, where the highest probability assigned to growth in any given interval is only 16% (between 4.0% and 5.9%) and 80% is assigned to a range from 1.0% to 7.9%. Probability distributions for 2022 have become somewhat wider and the highest probability is now assigned to an outcome between 1.5% and 1.9% (23%), while in the previous survey round expectations were centred around lower outcomes (1.0% to 1.4%). Also for the longer term, SPF respondents see higher outcomes more likely, with the probability mass for growth above 2% increasing to 23% compared with 18% in the previous round.
Chart 9
Aggregate probability distribution for longer-term GDP growth expectations
(x-axis: real GDP growth expectations, annual percentage changes; y-axis: probability, percentages)
Note: The SPF asks respondents to report their point forecasts and to separately assign probabilities to different ranges of outcomes. This chart shows the average probabilities they assigned to different ranges of real GDP growth outcomes in the longer term.
5 Unemployment rate expectations revised up sharply for 2020 with only a gradual unwinding thereafter
Respondents expect a sharp increase in unemployment in 2020 with a steady but gradual decline thereafter (see Chart 10). The euro area unemployment rate is forecast to increase substantially in 2020 to 9.4%. This represents an upward revision of 1.9 percentage points from the expectation of 7.5% in the previous round.[8] Although the unemployment rate is expected to gradually decline thereafter, the average longer-term forecast (for 2024) at 7.7% was still 0.4 percentage points higher than for the previous round. This indicates that respondents believe it will take quite some time for the effects of the crisis to unwind fully. It is also worth noting that a number of SPF respondents mention that the increase in unemployment will likely not be as large as might have been expected on the basis of historical relationships between economic activity and unemployment (i.e. Okun’s Law type relationships). This owes to policy measures adopted in many countries to protect employment in the short-term.
Chart 10
Expectations for the unemployment rate
(percentages of the labour force)

Uncertainty surrounding unemployment rate expectations, particularly for nearer-term horizons, has spiked up to historical highs and risks are perceived to be to the upside. Having eased back slightly in the previous (Q1 2020) SPF round, forecasters’ uncertainty about the unemployment rate in the future (as measured by the average width or standard deviations of the reported probability distributions) rose across all horizons (see Chart 11 and Chart 12). The increase was particularly sharp for the near-term horizon, with uncertainty about the one-year ahead rate unprecedentedly being higher than about the two-year ahead rate. This unusual situation reflects participants’ uncertainty about how the virus lockdowns and the impact on the macro-economy evolve. Across all horizons, the probability distributions are skewed toward higher unemployment rate outcomes and the balance of risks is perceived to be to the upside.
Chart 11
Aggregate probability distributions for the unemployment rate in 2020, 2021 and 2022
(x-axis: unemployment rate expectations, percentages of the labour force; y-axis: probability, percentages)
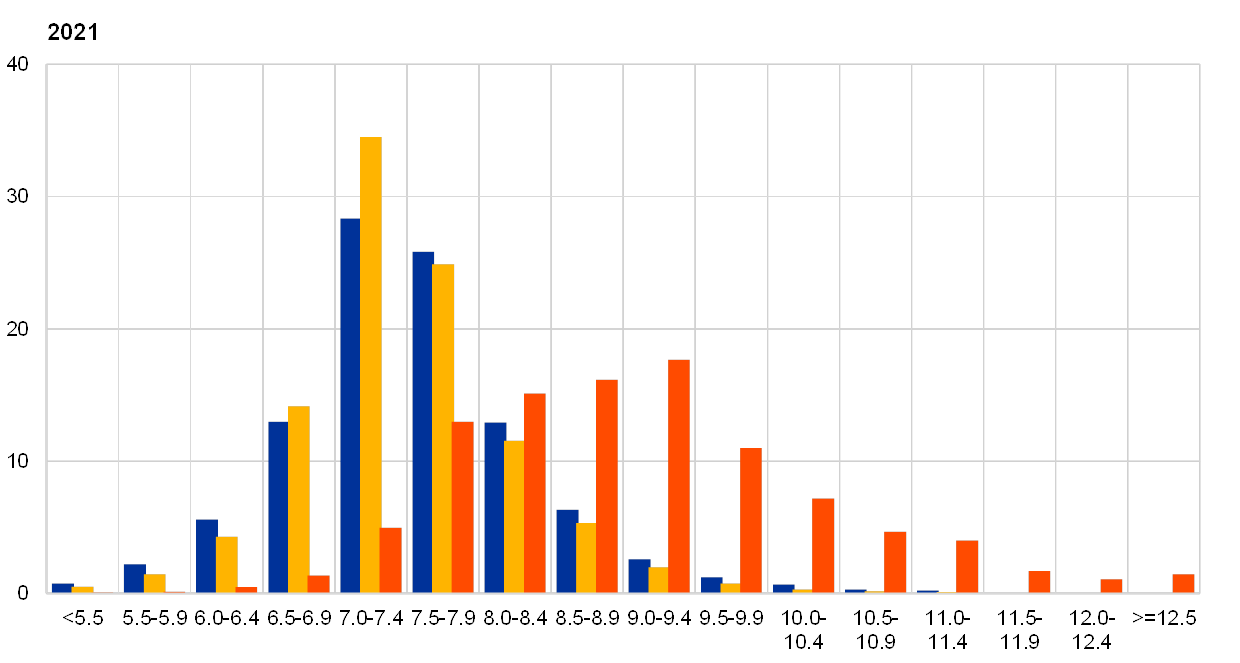
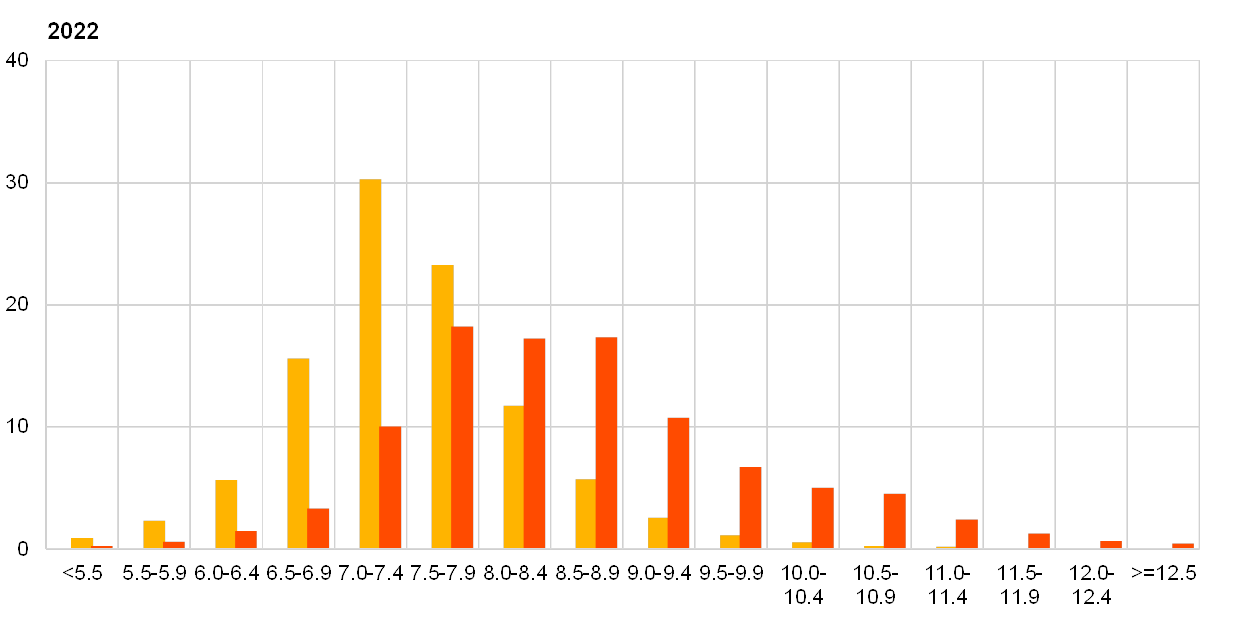
Notes: The SPF asks respondents to report their point forecasts and to separately assign probabilities to different ranges of outcomes. This chart shows the average probabilities they assigned to different ranges of unemployment rate outcomes for 2020, 2021 and 2022.
Chart 12
Aggregate probability distribution for the unemployment rate in the longer term
(x-axis: unemployment rate expectations, percentages of the labour force; y-axis: probability, percentages)
Notes: The SPF asks respondents to report their point forecasts and to separately assign probabilities to different ranges of outcomes. This chart shows the average probabilities they assigned to different ranges of unemployment rate outcomes in the longer term.
6 Expectations for other variables
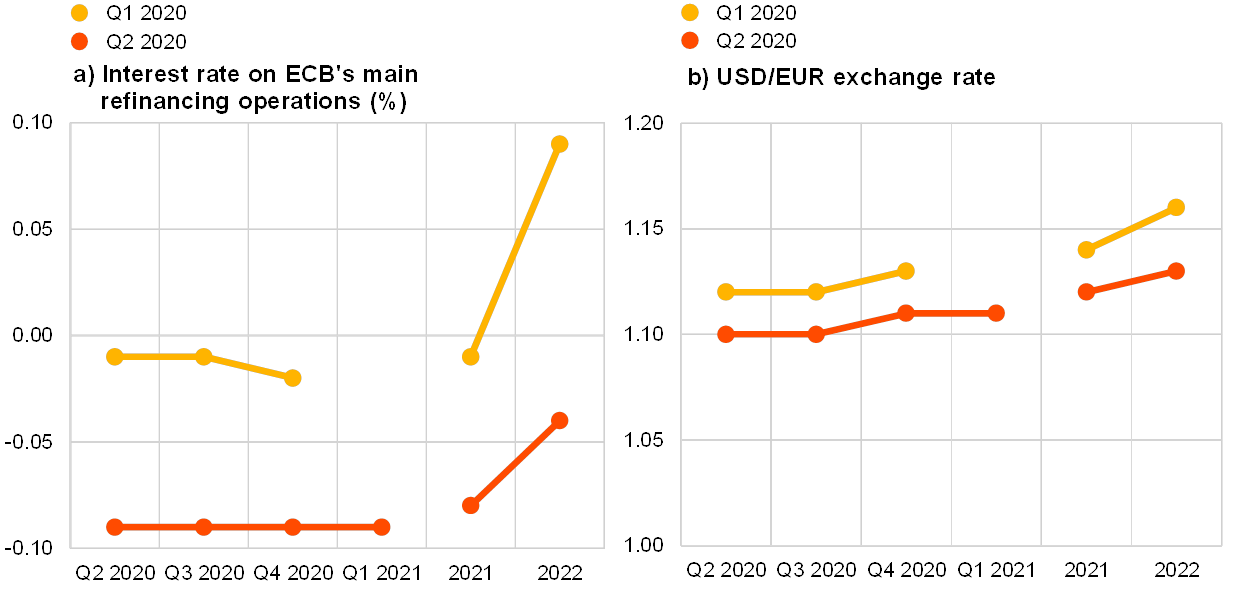
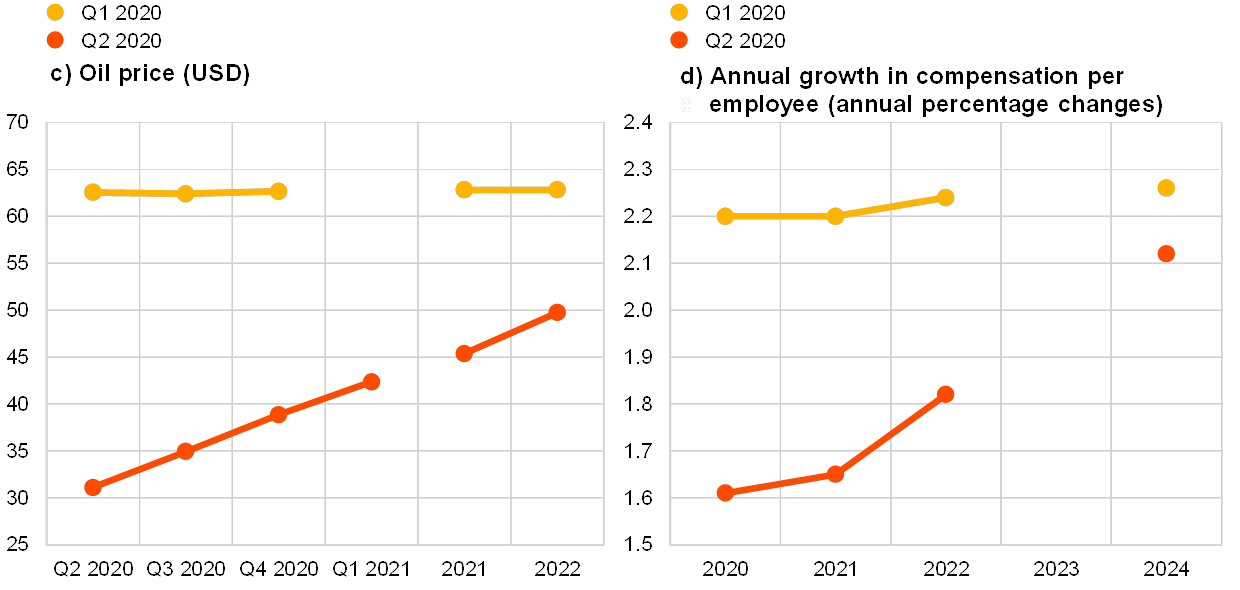
Respondents expected: US dollar oil prices to increase quite strongly from around 30 US dollars per barrel in Q2 2020 to 50 US dollars per barrel by 2022; the euro to appreciate slowly against the dollar until 2022; the ECB’s main policy rates to remain low until at least 2022; and wage growth to be in the range 1.6-2.1% over the entire forecast horizon.
The median expectation for the rate on the ECB’s main refinancing operations was for it to remain at 0% at least until 2022. This implies a later ‘lift-off’ than was forecast in the previous round (see panel (a) of Chart 13).
The average expected USD/EUR exchange rate was expected to appreciate marginally from around 1.10 in Q2 2020, to 1.12 in 2021 and further to 1.13 in 2022. This is slightly lower (by about 2%) than in the previous round (see panel (b) in Chart 13).
Compared with the previous round, the level of expected US dollar-denominated oil prices (per barrel) is lower over the entire horizon (Q2 2020 to 2022), however, the slope is now positive whereas it was slightly negative previously. Oil price expectations for 2020 Q2, at 30 US dollars per barrel, are 50% lower than reported in the previous round. Thereafter they are expected to increase steadily to reach around 50 US dollars per barrel by 2022, which is 20% lower than previously reported (see panel (c) of Chart 13). Given the relatively small changes to expectations for the USD/EUR exchange rate, this implies a similar relative profile for the oil price in euro.
On average, expected annual growth in compensation per employee was in the range 1.6-2.1% over the period 2020-22. This is 0.4-0.6 percentage points lower when compared with the Q1 2020 survey. For 2024, it is expected to be 2.1%, 0.1 percentage points lower than in the previous round (see panel (d) of Chart 13).
Chart 13
Expectations for other variables
7 Annex (chart data)
Excel data for all charts can be downloaded here.
© European Central Bank, 2020
Postal address 60640 Frankfurt am Main, Germany
Telephone +49 69 1344 0
Website www.ecb.europa.eu
All rights reserved. Reproduction for educational and non-commercial purposes is permitted provided that the source is acknowledged.
For specific terminology please refer to the ECB glossary (available in English only).
PDF ISSN 2363-3670, QB-BR-20-002-EN-N
HTML ISSN 2363-3670, QB-BR-20-002-EN-Q
- The survey was conducted between 31 March and 7 April 2020 with 57 responses received – over 80% of replies were received on Monday 6 April (63%) and Tuesday 7 April (19%). Participants were provided with a common set of the latest available data for annual HICP inflation (March 2020 flash estimates: overall inflation, 0.7%; underlying 1.0%), annual GDP growth (Q4 2019, 1.0%) and unemployment (February 2020, 7.3%).
- SPF panellists were explicitly asked to “elaborate on how you have factored in the impact from the coronavirus to your inflation, growth and unemployment rate forecasts. Specifically, we would like to know (a) what are the key coronavirus-related assumptions (e.g. lockdown duration, shape of path to normality, etc.) underlying your baseline projections, (b) what effect do various (public, fiscal and monetary) policy measures have in your baseline, (c) what risks/scenarios have you considered around the baseline, and (d) how do you see demand and supply effects playing out on inflation?”
- Some respondents used different letters of the alphabet (V, U, L, etc.) to describe their baseline profiles, although it is not always clear whether these refer to GDP levels or GDP growth rates. Considering the profile for GDP levels implied by their growth forecasts, the most appropriate characterisation of their GDP level expectations is a flat and elongated ‘tick-mark’ recovery.
- The width of the reported probability distributions indicates the perceived degree of uncertainty, whereas the asymmetry of the distributions indicates whether that uncertainty is more concentrated on higher or lower outturns, i.e. it measures the perceived balance of risks.
- Regarding uncertainty, it can be shown that the width (or standard deviation) of the aggregated probability distribution (i.e. ‘aggregate uncertainty’) is a function of the average width (or standard deviations) of the individual probability distribution (i.e. ‘individual uncertainty’) and standard deviation of the individual point forecasts (i.e. ‘disagreement’).
- Around the time of the global financial crisis, the one year ahead forecast for GDP growth was revised downward by a cumulative 4.4% over seven consecutive rounds from Q4 2007 to Q2 2009 with the largest downward revision in a single round being 1.9% in Q1 2009. However, unlike the current situation, during the global financial crisis the two-year ahead forecasts were also revised downward (e.g., by 0.4% both in Q4 2008 and Q1 2009).
- In anticipation of the expected substantial revisions to the growth outlook and the considerable uncertainty surrounding them (e.g. depending on the length of confinement measures and the evolution of the spread of the virus), the SPF questionnaire was adjusted to allow for a significantly wider range of the probability distributions, with bins of 2 percentage points width surrounding the regular bins of previous rounds.
- The upward revision is larger, at 2.2 percentage points, for the one-year ahead rate (i.e. 9.6% for February 2021) compared with the one-year ahead rate on the previous round (i.e. 7.4% for November 2020).
-
4 May 2020