
Economic Bulletin Issue 4, 2022
Economic, financial and monetary developments
Overview
High inflation is a major challenge for everyone. The Governing Council will make sure that inflation returns to its 2% target over the medium term.
In May inflation again rose significantly, mainly because of surging energy and food prices, including due to the impact of the war in Ukraine. But inflation pressures have broadened and intensified, with prices for many goods and services increasing strongly. Eurosystem staff have revised their baseline inflation projections up significantly. These projections indicate that inflation will remain undesirably elevated for some time. However, moderating energy costs, the easing of supply disruptions related to the pandemic and the normalisation of monetary policy are expected to lead to a decline in inflation. The June 2022 Eurosystem staff macroeconomic projections for the euro area foresee annual inflation at 6.8% in 2022, before it is projected to decline to 3.5% in 2023 and 2.1% in 2024 – higher than in the March projections. This means that headline inflation at the end of the projection horizon is projected to be slightly above the ECB’s target. Inflation excluding energy and food is projected to average 3.3% in 2022, 2.8% in 2023 and 2.3% in 2024 – also above the March projections.
Russia’s unjustified aggression towards Ukraine continues to weigh on the economy in Europe and beyond. It is disrupting trade, leading to shortages of materials and contributing to high energy and commodity prices. These factors will continue to weigh on confidence and dampen growth, especially in the near term. However, the conditions are in place for the economy to continue to grow on account of the ongoing reopening of the economy, a strong labour market, fiscal support and savings built up during the pandemic. Once current headwinds abate, economic activity is expected to pick up again. This outlook is broadly reflected in the Eurosystem staff macroeconomic projections, which foresee annual real GDP growth at 2.8% in 2022, 2.1% in 2023 and 2.1% in 2024. Compared with the March projections, the outlook has been revised down significantly for 2022 and 2023, while for 2024 it has been revised up.
On the basis of the updated assessment, the Governing Council decided to take further steps in normalising its monetary policy. Throughout this process, the Governing Council will maintain optionality, data-dependence, gradualism and flexibility in the conduct of monetary policy.
First, the Governing Council decided to end net asset purchases under its asset purchase programme (APP) as of 1 July 2022. The Governing Council intends to continue reinvesting, in full, the principal payments from maturing securities purchased under the APP for an extended period of time past the date when it starts raising the key ECB interest rates and, in any case, for as long as necessary to maintain ample liquidity conditions and an appropriate monetary policy stance.
Second, the Governing Council undertook a careful review of the conditions which, according to its forward guidance, should be satisfied before it starts raising the key ECB interest rates. As a result of this assessment, the Governing Council concluded that those conditions have been satisfied. Accordingly, and in line with its policy sequencing, the Governing Council intends to raise the key ECB interest rates by 25 basis points at its July monetary policy meeting. Looking further ahead, it expects to raise the key ECB interest rates again in September. The calibration of this rate increase will depend on the updated medium-term inflation outlook. If the medium-term inflation outlook persists or deteriorates, a larger increment will be appropriate at the September meeting.
Third, beyond September, based on its current assessment, the Governing Council anticipates that a gradual but sustained path of further increases in interest rates will be appropriate. In line with the commitment to its 2% medium-term target, the pace at which the Governing Council adjusts its monetary policy will depend on the incoming data and how it assesses inflation will develop in the medium term.
Within the Governing Council’s mandate, under stressed conditions, flexibility will remain an element of monetary policy whenever threats to monetary policy transmission jeopardise the attainment of price stability.
Economic activity
The economic fallout from the Russian invasion of Ukraine and the new lockdowns in China represent two key headwinds to global growth in the near term. Survey indicators confirm that global activity is moderating. Disrupted economic activity in Asia and the war in Ukraine are putting pressure on global supply chains, following a brief period of easing earlier this year. Supply chain and commodity market disruptions are stoking inflation amid growing evidence that inflationary pressures are intensifying and broadening. Increasing inflationary pressures are also evident from the rising export prices of the euro area’s competitors. Commodity prices remain volatile and subject to supply risks, whereas financial conditions have tightened. Global financial conditions tightened, reflecting monetary policy normalisation, falling prices of risky assets and rising yields. Against this background, the June 2022 Eurosystem staff macroeconomic projections indicate that global real GDP – excluding the euro area – will grow at 3.0% in 2022, 3.4% in 2023 and 3.6% in 2024 – a weaker growth trajectory than foreseen in the March projections. The two key headwinds are projected to weigh significantly on trade in the near term, but their impact is expected to dissipate thereafter. The projected growth in euro area foreign demand is more subdued and has undergone more significant downward revisions than growth in world imports, as European countries outside the euro area with tighter economic links to Russia and Ukraine are more affected by the economic shocks triggered by the invasion. In an environment of elevated uncertainty, the balance of risks around the baseline projections is firmly tilted to the downside for growth and to the upside for inflation.
The Russia-Ukraine war is severely affecting the euro area economy and the outlook is still surrounded by high uncertainty. But the conditions are in place for the economy to continue to grow and to recover further over the medium term. In the near term, the Governing Council expects activity to be dampened by high energy costs, the deterioration in the terms of trade, greater uncertainty and the adverse impact of high inflation on disposable income. The war in Ukraine and renewed pandemic restrictions in China have made supply bottlenecks worse again. As a result, firms face higher costs and disruptions in their supply chains, and the outlook for their future output has deteriorated.
Despite a better than expected outcome in 2021, the outlook for the euro area budget balance has deteriorated significantly since the finalisation of the March 2022 ECB staff macroeconomic projections. The more adverse outlook is related to a worsening of the economic cycle, increased expected interest payments and additional discretionary government spending. Fiscal support measures have been aimed in particular at countering the rising cost of living for consumers, but also at financing defence capacities and supporting refugees from the war in Ukraine. Nonetheless, according to the June 2022 Eurosystem staff macroeconomic projections, the euro area government budget deficit is expected to continue falling – from 5.1% of GDP in 2021 to 3.8% in 2022 and further to 2.4% by the end of the forecast horizon. After the strong loosening during the coronavirus crisis in 2020, the fiscal stance tightened last year and is projected to continue to tighten gradually in 2022 and 2023. The projected slight tightening in 2022 is mainly due to the reversal of a significant part of the pandemic emergency support, which will be only partially compensated by additional stimulus measures in response to the energy price shock and other spending related to the Russia-Ukraine war. The fiscal tightening is projected to be somewhat stronger in 2023, when many of the recent support measures compensating for the impact of high energy prices are projected to expire. In 2024 a more neutral stance is expected, although, compared to the pre-pandemic period, significant fiscal support to the economy is projected to remain in place.
In a context of heightened uncertainty and downside risks to the economic outlook in the light of the war in Ukraine, as well as energy price increases and continued supply chain disturbances, the European Commission recommended on 23 May 2022 the extension of the general escape clause of the Stability and Growth Pact (SGP) to the end of 2023. This would allow fiscal policies to adjust to changing circumstances if necessary. At the same time, with fiscal imbalances still exceeding their pre-pandemic levels and inflation exceptionally high, fiscal policy needs to be increasingly selective and targeted in order not to add to medium-term inflationary pressures, while ensuring fiscal sustainability over the medium term.
Fiscal policy is helping to cushion the impact of the war. Targeted and temporary budgetary measures protect those people bearing the brunt of higher energy prices while limiting the risk of adding to inflationary pressures. The swift implementation of the investment and structural reform plans under the Next Generation EU programme, the “Fit for 55” package and the REPowerEU plan would also help the euro area economy to grow faster in a sustainable manner and become more resilient to global shocks.
There are also factors supporting economic activity and these are expected to strengthen over the months to come. The reopening of those sectors most affected by the pandemic and a strong labour market, with more people in jobs, will continue to support incomes and consumption. In addition, savings accumulated during the pandemic are a buffer. The baseline projections of the June 2022 Eurosystem staff macroeconomic projections are built on the assumptions that the current sanctions against Russia will remain in place over the full projection horizon (including the EU’s oil embargo); the intense phase of the war will continue until the end of this year with no further escalation; disruptions to energy supplies will not lead to rationing in euro area countries; and supply bottlenecks will gradually be resolved by the end of 2023. All this implies much weaker (though still positive) near-term growth prospects, with headwinds fading after 2022 and growth in the medium term standing somewhat above historical average rates, reflecting a gradual recovery from the economic fallout from the pandemic and the fading of the negative impact of the war amid overall robust labour markets. According to the June 2022 Eurosystem staff macroeconomic projections, euro area real GDP is expected to grow by 2.8% on average in 2022 (of which 2.0 percentage points relates to carry-over from 2021) and by 2.1% in both 2023 and 2024. Compared with the March 2022 ECB staff projections, the outlook for growth has been revised down by 0.9 percentage points for 2022 and by 0.7 percentage points for 2023, mainly owing to the economic impact of the war in Ukraine, while growth in 2024 has been revised up by 0.5 percentage points, reflecting a rebound in activity as headwinds fade.
Inflation
Inflation rose further to 8.1% in May. Although governments have intervened and have helped slow energy inflation, energy prices stand 39.2% above their levels one year ago. Market-based indicators suggest that global energy prices will stay high in the near term but will then moderate to some extent. Food prices rose 7.5% in May, in part reflecting the importance of Ukraine and Russia among the main global producers of agricultural goods. Prices have also gone up more strongly because of renewed supply bottlenecks and because of recovering domestic demand, especially in the services sector, as the euro area economy reopens. Price rises are becoming more widespread across sectors. Accordingly, measures of underlying inflation have been rising further. The labour market continues to improve, with unemployment remaining at its historical low of 6.8% in April. Job vacancies across many sectors show that there is robust demand for labour. Wage growth, including in forward-looking indicators, has started to pick up. Over time, the strengthening of the economy and some catch-up effects should support faster growth in wages. While most measures of longer-term inflation expectations derived from financial markets and from expert surveys stand at around 2%, initial signs of above-target revisions in those measures warrant close monitoring.
Following the surge in inflation in early 2022, the outlook is for higher and more persistent inflation. Headline HICP inflation is expected to remain very high for most of 2022, averaging 6.8%, before abating gradually from 2023 and converging to the ECB’s inflation target in the second half of 2024. Price pressures will remain exceptionally high in the near term owing to elevated oil and gas prices and increases in food commodity prices, which have been strongly affected by the war in Ukraine, as well as the effects of the reopening of the economy and global supply shortages. The expected decline in inflation to 3.5% in 2023 and 2.1% in 2024 mainly reflects an assumed moderation in energy and food commodity prices in the absence of additional shocks, as embedded in futures prices. In addition, the ongoing normalisation of monetary policy, to the extent that it is reflected in higher interest rate assumptions (in line with market expectations), will contribute to the moderation in inflation, with the usual transmission lags. HICP inflation excluding energy and food will remain very elevated until the end of 2022, but thereafter it is expected to decline as the upward pressures from the reopening of the economy subside and as supply bottlenecks and energy input cost pressures ease. The ongoing economic recovery, tightening labour markets and some effects from compensation for higher inflation on wages – which are expected to grow at rates well above historical averages – imply elevated underlying inflation until the end of the projection horizon, although the baseline assumes that longer-term inflation expectations will remain well anchored. Compared with the March 2022 ECB staff projections, inflation has been revised up substantially. This reflects recent data surprises, higher energy and food commodity prices, more persistent upward pressures from supply disruptions, stronger wage growth and the depreciation of the euro exchange rate. These effects more than offset the downward impact of the increase in the interest rate assumptions and the weaker growth outlook.
Risk assessment
The Governing Council judges that the risks relating to the pandemic have declined, but the war in Ukraine continues to be a significant downside risk to growth. In particular, a major risk would be a further disruption in the energy supply to the euro area, as reflected in the downside scenario included in the staff projections. Furthermore, if the war were to escalate, economic sentiment could worsen, supply-side constraints could increase, and energy and food costs could remain persistently higher than expected. The risks surrounding inflation are primarily on the upside. The risks to the medium-term inflation outlook include a durable worsening of the production capacity of the euro area economy, persistently high energy and food prices, inflation expectations rising above the ECB’s target and higher than anticipated wage rises. However, if demand were to weaken over the medium term, it would lower pressures on prices.
Financial and monetary conditions
Market interest rates have increased in response to the changing outlook for inflation and monetary policy. With benchmark interest rates rising, bank funding costs have increased, and this has fed into higher bank lending rates, in particular for households. Nevertheless, lending to firms picked up in March. This was because of the continued need to finance investment and working capital against the backdrop of increasing production costs, persisting supply bottlenecks and lower reliance on market funding. Lending to households also increased, reflecting continued robust demand for mortgages.
In line with its monetary policy strategy, the Governing Council has undertaken its biannual in-depth assessment of the interrelation between monetary policy and financial stability. The environment for financial stability has worsened since the last review in December 2021, especially over the short term. In particular, lower growth and increasing cost pressures, as well as rising risk-free rates and sovereign bond yields, could lead to a further deterioration in the financing conditions faced by borrowers. At the same time, tighter financing conditions could reduce some existing financial stability vulnerabilities over the medium term. Banks, which started the year with solid capital positions and improving asset quality, are now facing greater credit risk. The Governing Council will watch these factors closely. In any case, macroprudential policy remains the first line of defence in preserving financial stability and addressing medium-term vulnerabilities.
Monetary policy decisions
Based on its updated assessment, the Governing Council decided to end net asset purchases under the APP as of 1 July 2022. The Governing Council intends to continue reinvesting, in full, the principal payments from maturing securities purchased under the APP for an extended period of time past the date when it starts raising the key ECB interest rates and, in any case, for as long as necessary to maintain ample liquidity conditions and an appropriate monetary policy stance.
As regards the pandemic emergency purchase programme (PEPP), the Governing Council intends to reinvest the principal payments from maturing securities purchased under the programme until at least the end of 2024. In any case, the future roll-off of the PEPP portfolio will be managed to avoid interference with the appropriate monetary policy stance.
In the event of renewed market fragmentation related to the pandemic, PEPP reinvestments can be adjusted flexibly across time, asset classes and jurisdictions at any time. This could include purchasing bonds issued by the Hellenic Republic over and above rollovers of redemptions in order to avoid an interruption of purchases in that jurisdiction, which could impair the transmission of monetary policy to the Greek economy while it is still recovering from the fallout from the pandemic. Net purchases under the PEPP could also be resumed, if necessary, to counter negative shocks related to the pandemic.
The Governing Council undertook a careful review of the conditions which, according to its forward guidance, should be satisfied before it starts raising the key ECB interest rates. As a result of this assessment, the Governing Council concluded that those conditions have been satisfied.
Accordingly, and in line with its policy sequencing, the Governing Council intends to raise the key ECB interest rates by 25 basis points at its July monetary policy meeting. In the meantime, the Governing Council decided to leave the interest rate on the main refinancing operations and the interest rates on the marginal lending facility and the deposit facility unchanged at 0.00%, 0.25% and -0.50% respectively.
Looking further ahead, the Governing Council expects to raise the key ECB interest rates again in September. The calibration of this rate increase will depend on the updated medium-term inflation outlook. If the medium-term inflation outlook persists or deteriorates, a larger increment will be appropriate at the September meeting.
Beyond September, based on its current assessment, the Governing Council anticipates that a gradual but sustained path of further increases in interest rates will be appropriate. In line with the Governing Council’s commitment to its 2% medium-term target, the pace at which the Governing Council adjusts its monetary policy will depend on the incoming data and how it assesses inflation will develop in the medium term.
The Governing Council will continue to monitor bank funding conditions and ensure that the maturing of operations under the third series of targeted longer-term refinancing operations (TLTRO III) does not hamper the smooth transmission of its monetary policy. The Governing Council will also regularly assess how targeted lending operations are contributing to its monetary policy stance. As announced previously, the special conditions applicable under TLTRO III will end on 23 June 2022.
The Governing Council stands ready to adjust all of its instruments, incorporating flexibility if warranted, to ensure that inflation stabilises at its 2% target over the medium term. The pandemic has shown that, under stressed conditions, flexibility in the design and conduct of asset purchases has helped to counter the impaired transmission of monetary policy and made the Governing Council’s efforts to achieve its goal more effective. Within the ECB’s mandate, under stressed conditions, flexibility will remain an element of monetary policy whenever threats to monetary policy transmission jeopardise the attainment of price stability.
Following an ad hoc meeting on 15 June the Governing Council further communicated that it will apply flexibility in reinvesting redemptions coming due in the PEPP portfolio, with a view to preserving the functioning of the monetary policy transmission mechanism, a precondition for the ECB to be able to deliver on its price stability mandate. In addition, the Governing Council decided to mandate the relevant Eurosystem Committees together with the ECB services to accelerate the completion of the design of a new anti-fragmentation instrument for consideration by the Governing Council.
1 External environment
The economic fallout from the Russian invasion of Ukraine and the new lockdowns in China represent headwinds to global growth in the near term. Against this background, the June 2022 Eurosystem staff macroeconomic projections expect that global real GDP – excluding the euro area – will grow at 3.0% in 2022, 3.4% in 2023 and 3.6% in 2024, a weaker growth trajectory compared with the March projections. The implications of the Russian invasion and the pandemic measures in China are projected to weigh significantly on trade in the near term, but their impact is expected to dissipate thereafter. The projected growth of euro area foreign demand is more subdued and has undergone more significant downward revisions compared with world imports, reflecting a worse outlook for Russia and for European countries outside the euro area with tighter economic links to Russia and Ukraine. In an environment of elevated uncertainty, the balance of risks around the baseline projections is firmly tilted to the downside for growth and to the upside for inflation.
The economic fallout from the war and the new lockdowns in China represent headwinds to global growth in the near term. Through commodity prices, supply chains and uncertainty, the consequences of the war in Ukraine are reaching well beyond the countries and regions closely associated with Russia and Ukraine via trade and financial linkages. While the war is weighing on growth, it is also adding to already heightened inflationary pressures, particularly in emerging market economies (EMEs), where spending on energy and food constitutes a particularly large share of private consumption. In addition, the resurgence of the coronavirus (COVID-19) pandemic in Asia and the associated tightening of containment measures, particularly in economically important Chinese provinces, are adding pressure to global supply chains following a brief period of easing earlier this year. The implications of the Russian invasion and the pandemic measures in China are operating in an environment of high inflationary pressures, which has prompted central banks across the globe to adjust their monetary policies, thereby contributing to tighter financial conditions.
Survey indicators signal that global activity is moderating. The Purchasing Managers’ Index (PMI) surveys for May suggest that economic activity remained resilient across advanced economies in spite of the ongoing invasion, and that the services sector continued to outpace the manufacturing sector. In contrast, more muted economic activity in EMEs reflects developments in China and Russia (Chart 1). The global activity tracker, based on a broader range of indicators, confirms the trends shown in surveys. Overall, estimated global real GDP growth – excluding the euro area – slowed significantly to 0.5% in the first quarter of 2022, in line with the March 2022 ECB staff macroeconomic projections.
Chart 1
PMI composite output by region
(diffusion indices)

Sources: Markit and ECB staff calculations.
Note: The latest observations are for May 2022.
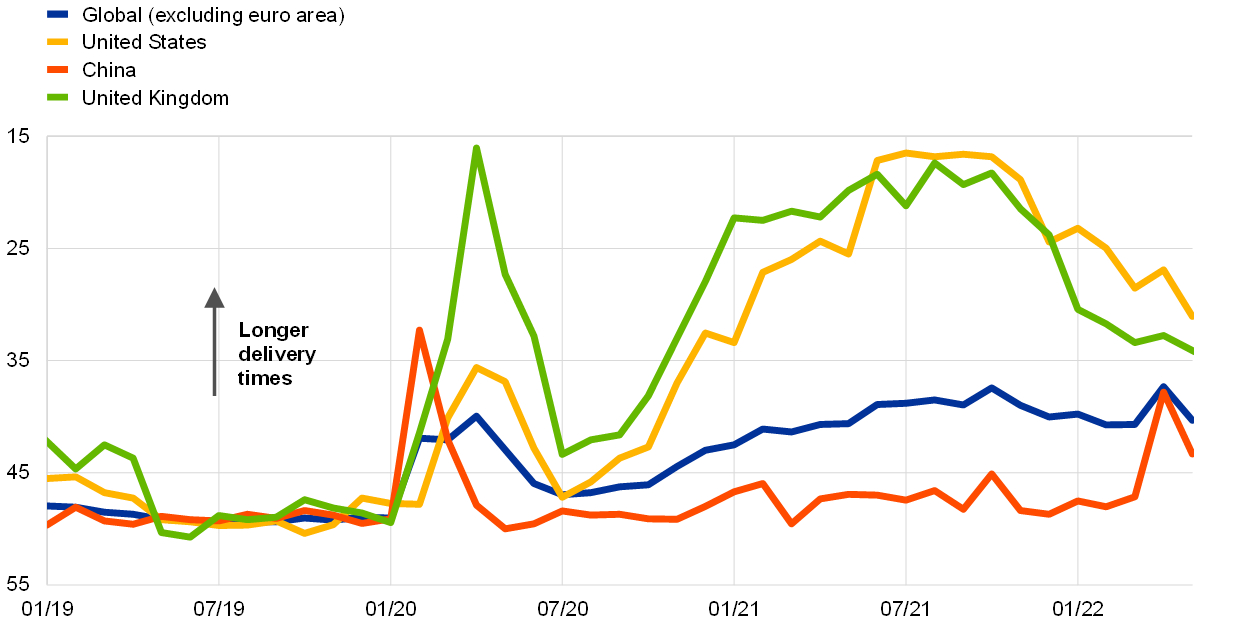
Disrupted economic activity in Asia and the war in Ukraine are putting pressure on global supply chains, following a brief period of easing earlier this year. The PMI suppliers’ delivery times had been improving throughout March, especially in the United States and United Kingdom (though the indicator was still pointing to long delivery times, remaining below the neutral threshold of 50). This positive trend was interrupted in April, when suppliers reported lengthening delivery times. In the case of the United States, however, a model-based analysis suggests that this development was a result of stronger demand rather than supply factors. At the same time, a marked lengthening of suppliers’ delivery times in China – largely on account of lockdown-related supply factors – has brought the global composite measure back to the levels recorded in late 2021 when supply bottlenecks were most acute. More recently suppliers’ delivery times have shortened again as the improving situation in China meant strict measures were eased in May. Delivery times in the United States and the United Kingdom have improved but are still far from normalisation (Chart 2).
Chart 2
PMI suppliers’ delivery times
(diffusion indices, inverted scale)
Sources: Markit and ECB staff calculations.
Note: The latest observations are for May 2022.
Supply chain and commodity market disruptions are contributing to inflation amid growing evidence that price pressures are intensifying and broadening. Annual headline CPI inflation across OECD countries – excluding Turkey – rose to 7.2% in April, reaching its highest rate in over three decades. Annual inflation excluding energy and food increased to 4.7%. In addition, the momentum in both headline and core inflation in the OECD area has picked up again and moved close to levels recorded in mid-2021, when demand recovered as economies reopened (Chart 3). Survey data for input and output prices in the manufacturing sector confirm the elevated inflationary pressures for producers and consumers, and prices in the services sector are rising gradually. The general increase in global commodity prices observed this year is expected to add to already heightened inflation pressures in the near term, especially across EMEs, where energy and food account for a larger share of consumer expenditure than in advanced economies. Under the latest conditioning assumptions, global consumer price inflation is expected to peak around the middle of this year and decline gradually over the rest of the projection horizon.
Increasing inflationary pressures are also evident from the rising export prices of the euro area’s competitors. Compared with the March 2022 ECB staff macroeconomic projections, euro area competitors’ export prices were revised significantly upwards for this year and the next, as higher oil and non-oil commodity prices interact with rising domestic and global pipeline pressures.
Chart 3
OECD consumer price inflation
(year-on-year percentage changes and three-month-on-three-month annualised percentage changes)
Sources: OECD and ECB calculations.
Notes: OECD aggregates are calculated excluding Turkey. In Turkey, annual headline and core inflation stood at 70% and 54.6% respectively. Annual headline and core inflation for OECD countries including Turkey (not reported in the charts) was 9.2% and 6.3% respectively. Core inflation excludes energy and food. The latest observations are for April 2022.
Commodity prices remain volatile and subject to supply risks. While volatility in commodity markets has declined somewhat compared with the weeks directly following Russia’s invasion of Ukraine, substantial supply-side risks persist, affecting energy commodities in particular. Global oil prices have increased since the April 2022 Governing Council meeting, on the back of the EU oil embargo and supply risks materialising. This follows a short period of declining prices, as the global oil market was calmed by the release of strategic oil reserves by the United States and other countries, as well as by falling demand due to lockdowns in China. European gas prices, however, declined as markets took comfort from rising inventories which outweighed intensifying supply-side concerns and the usual summer seasonality in Europe. Meanwhile, Russia halted gas deliveries to Bulgaria, Finland and Poland, and – after the cut-off date for Eurosystem staff projections – also to Denmark and the Netherlands, as they refused to comply with Russian demands to settle gas payments in roubles. Overall, the risk of broader gas supply disruptions in Europe continues to be elevated. Composite food prices remained broadly stable at elevated levels, whereas metal prices declined sharply amid lower demand from China.
Global financial conditions tightened, reflecting monetary policy normalisation, falling prices of risky assets and rising yields. The United States saw financial conditions tighten more than in other advanced economies. Financial conditions in EMEs have tightened markedly since the Russian invasion of Ukraine, adding to previous trends that mainly reflect domestic monetary policy tightening. Capital outflows from EMEs have increased since the invasion, which signals that further risks and uncertainties lie ahead.
In the United States, economic activity contracted in the first quarter of 2022. Real GDP declined by 0.4%, but while this weak outturn generally surprised observers, it showed that domestic demand remained relatively solid, while activity was dragged down by negative contributions from net exports and the change in inventories. Looking ahead, a return to positive, albeit moderate growth rates is expected over the near to medium term amid high inflation, substantial monetary policy tightening and a smaller fiscal impulse. Annual headline consumer price inflation decreased to 8.3% in April as energy prices moderated, while core inflation fell to 6.2%. Nevertheless, core month-on-month inflation jumped to 0.6% as underlying pressures remain high. In particular, services prices are continuing to increase at an elevated pace amid the ongoing rise in rents and transportation costs.
In China, real GDP growth held up in the first quarter of 2022 despite the strongest resurgence in coronavirus cases since the beginning of the pandemic. However, the sweeping mobility restrictions implemented in the context of the zero-COVID strategy and the related changes in consumer behaviour are expected to impinge on activity in the second quarter of 2022. More accommodative policy is being implemented to mitigate the negative impact of lockdowns on economic growth.
In Japan, economic recovery halted at the start of 2022 amid the spread of the Omicron variant and persistent supply constraints. A firmer recovery is expected, supported by pent-up demand and policy support, as well as a pick-up in global demand and gradually declining pressures on supply chains. Economic growth is expected to moderate in the longer term and gradually return to the trend rate. Annual CPI inflation is projected to rise in the near term, supported by higher food and energy prices, as well as the declining effects from special factors such as cuts to mobile phone charges.
In the United Kingdom, economic activity has rebounded from the Omicron wave more strongly than previously anticipated. However, the outlook is expected to remain rather subdued as the war in Ukraine exacerbates already elevated price pressures and supply bottlenecks. Consumer confidence has fallen sharply in response to the squeeze on real household disposable income. The tightening in the labour market has persisted, with the unemployment rate continuing to decline despite the ending of the furlough scheme in September 2021. Supply-side bottlenecks and rising commodity prices are projected to push up consumer price inflation to substantially higher levels than in the March 2022 ECB staff projections until at least the second quarter of 2022.
The Russian economy is expected to fall into a deep recession this year. This outlook reflects the more severe economic sanctions imposed since the March projections, including an embargo on energy commodity imports from Russia by the United Kingdom and the United States, as well as a commitment by all G7 countries to phase out or ban Russian oil as soon as possible. Following its embargo on coal imports from Russia, the EU has also agreed to ban oil imports. Although this embargo had not yet been agreed by the time of the cut-off date for the June 2022 Eurosystem staff projections, the baseline assumes that either the initially proposed embargo or a modified version excluding certain countries will be gradually implemented over the projection horizon. The impact of the sanctions on activity in Russia is further amplified by broader private sector boycotts disrupting production and logistics, whereas rising inflation and tight financing conditions are weighing on domestic demand. The expected pattern of a deep recession followed by a subdued recovery reflects an assumption that the economic sanctions imposed to date will remain in place for the rest of the projection horizon.
2 Economic activity
The second paragraph and the last paragraph of section 2 were corrected.
The euro area economy grew by 0.6% in the first quarter of 2022, thus standing 0.8% above its pre-pandemic level. This stronger than expected outcome was driven by a double-digit quarterly GDP increase in Ireland. On average, the rest of the euro area economy grew by 0.3%. Modest positive growth is expected in the second quarter, as the favourable impact from lifting pandemic-related restrictions on euro area activity is counteracted by adverse factors caused or amplified by the war in Ukraine, as well as by new pandemic-related measures in China. Despite the recovery in consumption of contact-intensive services, higher energy and food prices have dampened consumer sentiment and household spending. Persisting or even intensified supply chain disruptions, including in the aftermath of the lockdowns in China and the war in Ukraine, are constraining manufacturing activity and trade. Elevated uncertainty, rising costs and tightening financing conditions are also expected to weigh on both business and housing investment in the coming quarters. Nevertheless, looking beyond these weaker near-term growth prospects, the conditions are in place for the economic activity in the euro area to regain momentum in the second half of the year.
This assessment is broadly reflected in the June 2022 Eurosystem staff macroeconomic projections for the euro area, which foresee annual real GDP growth at 2.8% in 2022 and 2.1% in both 2023 and 2024. Compared with the March 2022 ECB staff macroeconomic projections, this outlook was revised downwards significantly for 2022 and 2023 but revised upwards for 2024. Risks to the economic outlook are assessed to be tilted to the downside, notably as a result of the possibility of a severe disruption to European energy supplies, leading to further increases in energy prices and production cuts.
Euro area domestic demand contracted in the first quarter of 2022. While GDP increased by 0.6% quarter on quarter in the first quarter of the year, the contribution from domestic demand stood at -0.4 percentage points, signalling an overall weakness in domestic sources of growth. By contrast, net trade and changes in inventories made a positive contribution to growth. GDP growth was 0.3 percentage points higher than Eurostat’s flash estimate, reflecting the inclusion of volatile data from Ireland, which showed double-digit growth in the first quarter owing to developments in its multinational sector, thereby boosting its net trade contribution to growth. The level of GDP in the euro area stands 0.8% above its pre-pandemic level observed in the final quarter of 2019 (Chart 4). On the production side, total value added displayed a broadly based increase across the main sectors of the economy.
Chart 4
Euro area real GDP and its components
(percentage changes since the fourth quarter of 2019; percentage point contributions)

Sources: Eurostat and ECB calculations.
Note: The latest observations are for the first quarter of 2022.
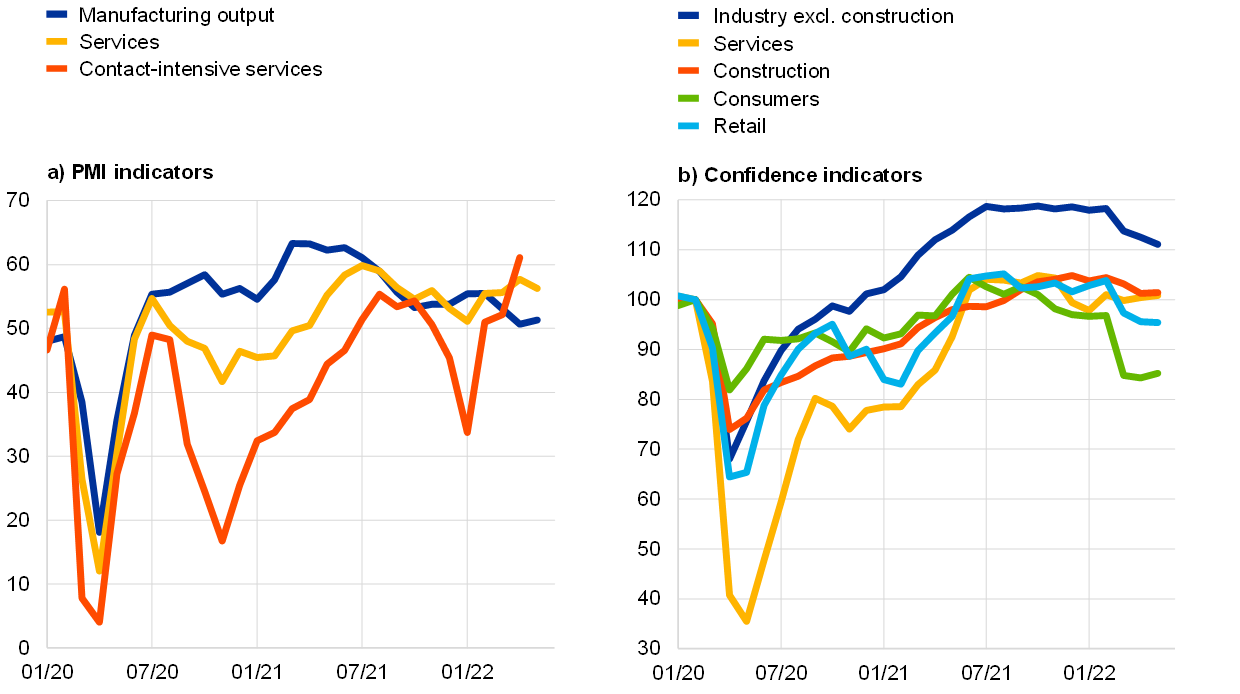
Economic activity is expected to be somewhat weaker in the second quarter of 2022, negatively affected by the consequences of the war in Ukraine but still supported by the recovery in contact-intensive services. Incoming survey data point to continued positive, albeit slow, growth in the second quarter of 2022. The composite output PMI indicator decreased in May but remains in expansionary territory and well above its long-term average. However, there are signs of weakening activity in the manufacturing sector, particularly affected by intensified supply chain disruptions and higher commodity prices due to Russia’s invasion of Ukraine, as well as the rise in overall uncertainty (Box 2). In May 2022, new orders in manufacturing decreased for the first time since June 2020 and 12-month-ahead business expectations were among the weakest seen over the past two years. This contrasts with the further solid growth of new business inflows into the services sector, reflecting stronger activity in contact-intensive services once the pandemic-related restrictions were lifted (Chart 5a). The different developments in confidence indicators across sectors corroborate this contrasted picture (Chart 5b). The improvement in business confidence in May was mostly driven by the services sector, while sentiment deteriorated further in the industrial and retail sectors. Consumer confidence edged up in May but remains well below its long-term average, pointing to risks to future demand against the background of higher energy and food costs (Box 1; Box 6). Overall, while this combination of factors is likely to dampen growth in the near term, the prospects for a strengthening of the recovery still remain, given the reopening of the economy, a strong labour market, fiscal support measures and the continued high level of savings. Therefore, this outlook clearly does not point to a stagflation scenario, understood as a protracted period of low or even negative growth with persistently high or even accelerating inflation, as witnessed in the main advanced economies in the 1970s (Box 5).
Chart 5
Survey indicators across sectors of the economy
(left-hand panel: percentage balances; right-hand panel: percentage balances, February 2020 = 100)
Sources: Standard & Poor’s Global Ratings (left-hand panel), European Commission and ECB calculations (right-hand panel).
Notes: “Contact-intensive services” refers to accommodation, food and beverage service activities. The latest observations are for May 2022, except for contact-intensive services for which the latest observation is for April 2022.
The labour market in the euro area continues to improve despite the economic impact of the war in Ukraine. The unemployment rate stood at 6.8% in April 2022, broadly unchanged since March and around 0.6 percentage points lower than the pre-pandemic level observed in February 2020 (Chart 6). This is also the lowest level recorded since the inception of the euro area, albeit with continuing, though progressively lower, recourse to job retention schemes in some countries. Total employment grew by 0.6% quarter on quarter in the first quarter of 2022, after standing at 0.4% in the fourth quarter of 2021. As a result of the economic recovery following the relaxation of pandemic-related containment measures, workers covered by job retention schemes accounted for 1.1% of the labour force in March 2022, down from around 1.6% in December 2021. Likewise, the available national accounts data indicate that in the first quarter of 2022, the total hours worked remained below pre-pandemic levels, particularly in the industrial and market services sectors.
Chart 6
Euro area employment, the PMI employment indicator and the unemployment rate
(left-hand scale: quarter-on-quarter percentage changes, diffusion index; right-hand scale: percentages of the labour force)

Sources: Eurostat, Standard & Poor’s Global Ratings and ECB calculations.
Notes: The two lines indicate monthly developments; the bars show quarterly data. The PMI is expressed as a deviation from 50 divided by 10. The latest observations are for the first quarter of 2022 for employment, May 2022 for the PMI and April 2022 for the unemployment rate.
Short-term labour market indicators continue to develop favourably, indicating an overall resilient labour market in the euro area so far. The monthly composite PMI employment indicator reached 55.9 in May, 1.2 points higher than in April, thus remaining above the threshold level of 50 that indicates an expansion in employment. The PMI employment indicator has recovered strongly following its all-time low in April 2020 and has now been in expansionary territory since February 2021. Looking at developments across different sectors, the PMI employment indicator points to robust employment growth in all three key sectors, i.e. services, manufacturing and construction.
After contracting for two consecutive quarters, private consumption should be supported by spending on services as pandemic restrictions are eased, notwithstanding significant headwinds. Following a weak start to the year due to the pandemic, households’ consumption of goods signals unfolding effects from the war in Ukraine and persistent bottlenecks in goods’ production and distribution. This is suggested by recent developments in retail sales, which stood at -1.3% month on month in April, after -0.5% quarter on quarter in the first quarter of 2022, and new car registrations, which, in April, remained some 7% below their first quarter average, despite a small month-on-month increase from the lows seen in March 2022. Consumer confidence remained well below its long-term average in May, reflecting households’ ongoing concerns about the impact of the war in Ukraine. Households and retail companies also became less optimistic about future spending on major (goods) purchases, as flagged by the European Commission’s latest Consumer Survey in May. Their downbeat expectations about the future financial and economic situation, despite a small improvement in May, indicate that higher inflation and increased uncertainty are likely to weigh on their spending decisions (Box 2). Nevertheless, consumer spending on services is expected to strongly rebound amid easing pandemic restrictions. This assessment is confirmed by the European Commission’s latest Consumer Survey suggesting that, in anticipation of a restriction-free summer, expected demand for accommodation, food and travel services has strengthened despite the ongoing war and falling real disposable income. Savings accumulated during the pandemic might only cushion the impact of the energy price shock to a limited extent, as it is concentrated among higher-income households with lower overall exposure to high energy costs. On the other hand, lower-income households – which spend a larger share of their income on energy – should be able to benefit from fiscal income support measures.
Business investment contracted in the first quarter of 2022, driven by developments in Ireland. Non-construction investment declined by 2.9% quarter on quarter in the first quarter, reflecting a strong contraction in intellectual property investment in Ireland which offset the strong surge seen in the final quarter of 2021. Excluding Ireland, euro area investment grew by 0.8% quarter on quarter, against a backdrop of record-level equipment shortages reported by respondents to ECOFIN’s quarterly business surveys. All four of the largest euro area countries recorded ongoing growth in non-construction investment, particularly Spain and, to a lesser extent, Italy, potentially reflecting reopening effects and early disbursements of Next Generation EU (NGEU) funds. Looking ahead, business investment is expected to be adversely affected by elevated uncertainty related to the war in Ukraine, high energy prices, ongoing supply bottlenecks and tightening financial conditions. Incoming survey data at the start of the second quarter suggest lower business confidence, reflecting downgraded output and order book assessments among capital goods’ producers, while lower expected turnover in manufacturing points to a quarter-on-quarter contraction of business investment in the second quarter of 2022. At the same time, an improving outlook for services activity, reflecting the lifting of pandemic-related restrictions, and broader support from NGEU funds are expected to support a return to growth later in the year.[1]
Housing investment increased significantly in the first quarter of 2022 but is likely to weaken in the near term. Housing construction investment increased by 4.5% in the first quarter of 2022 compared with the previous quarter. As for the second quarter, the European Commission’s indicator of recent trends in construction activity declined significantly in April and May, on average, compared with the first quarter. The PMI for residential construction also declined significantly, moving into negative growth territory in May. On the demand side, according to the European Commission’s latest survey data, households’ near-term intentions to renovate and to buy or build a house fell significantly in the second quarter. On the supply side, firms’ order books weakened and insufficient demand as a limit to production increased in April and May, albeit remaining well below its long-term average. Moreover, firms’ production continued to be constrained by significant bottlenecks in the supply of labour and materials (e.g. steel, lumber), which worsened after the outbreak of the war in Ukraine and led to a sharp rise in construction prices. This rise in construction costs, combined with less favourable financing conditions, is likely to weigh on housing demand and, together with ongoing supply-side constraints, dampen growth in housing investment.
Euro area trade lost momentum as extra-euro area exports weakened, and the outlook points to subdued trade, particularly in manufacturing. In February and March 2022, nominal extra-euro area goods exports weakened, while extra-euro area goods imports continued to increase. The goods trade balance shifted further into deficit owing to the higher cost of energy imports and subdued export performance. Exports to China decreased due to the pandemic-related restrictions, while exports to Russia halved due to sanctions and the unsanctioned behaviour of market participants. Short-term shipping and survey indicators suggest that supply bottlenecks may have re-intensified, as illustrated, for example, by an increase in the amount of goods blocked in key ports in May 2022 due to pandemic-related lockdowns in China and the war in Ukraine. The weakening in external demand related to these events is reflected in forward-looking PMI manufacturing export orders that declined somewhat further into contractionary territory in May. By contrast, the PMI for export orders in the services sector has moved into expansionary territory due to the relaxation of pandemic-related restrictions in Europe. In particular, survey indicators and travel bookings point to a strong recovery in trade in tourism this summer.
Despite the weak near-term prospects, euro area economic activity is expected to regain momentum later this year and expand at a relatively solid pace. This outlook is, however, surrounded by considerable uncertainty. The June 2022 Eurosystem staff macroeconomic projections foresee annual real GDP growth at 2.8% in 2022 and 2.1% in both 2023 and 2024 (Chart 7). Compared with the March 2022 ECB staff macroeconomic projections, the outlook has been revised downwards significantly for 2022 and 2023, mainly owing to the economic impact of the war in Ukraine, while for 2024 it has been revised upwards, reflecting a rebound in activity as headwinds fade.
Chart 7
Euro area real GDP (including projections)
(index; fourth quarter of 2019 = 100; seasonally and working day-adjusted quarterly data)
Sources: Eurostat and the article entitled “Eurosystem staff macroeconomic projections for the euro area, June 2022” published on the ECB’s website on 9 June 2022.
Note: The vertical line indicates the start of the June 2022 Eurosystem staff macroeconomic projections and follows the last observation for euro area real GDP, which relates to the first quarter of 2022.
The risks to the economic outlook continue to be tilted to the downside. One key risk is the possibility of a severe disruption to European energy supplies from Russia following the implementation of the EU sanctions, leading to further increases in energy prices and production cuts.
3 Prices and costs
According to Eurostat’s flash estimate inflation rose further to 8.1% in May, mainly because of surging energy and food prices, including due to the impact of the war. Prices have also gone up more strongly because of renewed supply bottlenecks and recovering domestic demand as the economy reopens, especially in the services sector. Overall, inflationary pressure has broadened and intensified, and wage growth has started to pick up. While most measures of longer-term inflation expectations derived from financial markets and expert surveys stand at around 2%, initial signs of above-target revisions in those measures warrant close monitoring. Eurosystem staff have revised up their baseline for inflation in the June 2022 projections significantly compared to the March ECB staff projections. The new staff projections foresee annual inflation at 6.8% in 2022, 3.5% in 2023 and 2.1% in 2024.
According to Eurostat’s flash estimate for May, HICP inflation rose to a record high unprecedented in the history of the euro. The increase from 7.4% in April to 8.1% in May reflects higher inflation rates for all main components, but most notably for energy and food. Consumer energy prices, which remain the primary contributor to headline inflation, edged up again after a slight moderation in April. High wholesale prices for gas, oil and electricity, as well as elevated refining and distribution margins for transport fuel (particularly diesel oil) offset a downward effect of the compensatory measures adopted by euro area countries. Food inflation also rose substantially, pushed up by global food commodity prices and domestic producer prices. This reflected cost factors such as those related to energy and fertilisers (Chart 8).
Chart 8
Energy and food input cost pressure
(annual percentage changes)

Source: Eurostat.
Note: The latest observations are for May for euro area farm gate prices and for April for the other data.
HICP excluding energy and food (HICPX) increased to 3.8%, reflecting a further build-up in both non-energy industrial goods (NEIG) and services inflation (Chart 9). Here, too, higher input costs as a result of the surge in energy prices remain a prominent driver. NEIG inflation is also still affected by global supply disruptions, which have intensified as a result of the war in Ukraine and the aftermath of pandemic-related developments in China. Services inflation reflects some of the effects arising from the reopening of the economy once pandemic-related restrictions were lifted, as evidenced by the relatively buoyant contributions from accommodation and recreation services in April 2022.
Chart 9
Headline inflation and its main components
(annual percentage changes; percentage point contributions)

Sources: Eurostat and ECB calculations.
Note: The latest observations are for May 2022 (flash estimate).
A wide range of measures of underlying inflation surpassed 3% (Chart 10). Exclusion-based indicators of underlying inflation have increased further in recent months, as high inflation rates become more prevalent across a wider range of HICP items. HICPX inflation rose to 3.8% in May 2022, after 3.5% in April. Other indicators of underlying inflation are only available up to April, at which time HICPXX inflation (which excludes travel-related items, clothing and footwear, as well as energy and food) increased to 3.2%. The upward movement of exclusion-based indicators is illustrated by the distribution of the sub-components that make up the HICP basket. In April, almost 80% of these sub-components recorded annual growth rates of above 2%. Meanwhile, the model-based Persistent and Common Component of Inflation (PCCI) stood at 5.5% in April and the Supercore indicator, which comprises cyclically-sensitive HICP items, edged up to 3.5%, from 3.0% in March. At the same time, it remains uncertain how persistent these increases will be. A large part of the upward push in underlying inflation dynamics can be attributed to indirect effects from the surge in energy and food prices and from exceptional developments in the balance between supply and demand related to the pandemic and the Russian invasion of Ukraine. Looking ahead, developments in wages will be a key factor for the future dynamics of underlying inflation.
Chart 10
Indicators of underlying inflation
(annual percentage changes)

Sources: Eurostat and ECB calculations.
Notes: The range of indicators of underlying inflation includes HICP excluding energy, HICP excluding energy and unprocessed food, HICPX (HICP excluding energy and food), HICPXX (HICP excluding energy, food, travel-related items, clothing and footwear), the 10% and 30% trimmed means, and the weighted median. The latest observations are for April 2022, with the sole exception of the HICPX, which was obtained from the May 2022 flash estimate.
The latest data on negotiated wages signal a strengthening in wage dynamics, but this remains moderate when taking into account one-off payments (Chart 11). Growth in negotiated wages increased to 2.8% in the first quarter of 2022, compared with 1.6% in the previous quarter. The upward movement is not fully indicative of the growth in base wages, as the underlying wage agreements generally comprise one-off payments to compensate workers for the exceptional developments that occurred during the pandemic. More recent information on those wage agreements that were concluded since the start of 2022 confirm some strengthening in wage dynamics, although wage growth remains contained compared with the current inflation rates. Wage developments measured by compensation per employee (CPE) also strengthened further in the first quarter of 2022, increasing to 4.4% compared with 3.8% in the previous quarter. However, this increase mainly reflected an increase in the average hours worked, while the increase in compensation per hour (CPH) remained far more contained at an annual growth rate of 1.1%. Pandemic-related distortions to these indicators are declining as the impacts of government measures related to job retention schemes have continued to decrease.
Chart 11
Breakdown of compensation per employee into compensation per hour and hours worked
(annual percentage changes)

Sources: Eurostat and ECB calculations.
Note: The latest observations are for the first quarter of 2022.
Pipeline pressures on consumer prices for NEIG have continued to build up further at all stages of the pricing chain. (Chart 12). Cost pressures rose further to new all-time highs on the back of supply chain disruptions and global commodity prices, particularly for energy but also for some metals. At the early stages of the pricing chain for HICP NEIG inflation, the annual growth rate of producer prices for domestic sales of intermediate goods jumped to 25.1% in April 2022, up from 22.7% in the previous month. Import prices for intermediate goods also continued to grow at a strong pace (22.6% in April compared with 22.4% in the previous month). Input cost pressures also feature more prominently at later stages of the pricing chain, with producer price inflation for domestic sales of non-food consumer goods increasing from 6.0% in March to 6.7% in April, which is exceptionally high when compared with the average annual rate of 0.6% over the 2001-19 period. Import price inflation for non-food consumer goods edged up as well to 7.0% in April, after a small decline between February and March. Overall, these developments in import and producer prices for non-food consumer goods imply that pressure on NEIG inflation in the HICP is likely to remain elevated in the near term. This is also reflected in the data on selling-price expectations in the manufacturing sector.
Chart 12
Indicators of pipeline pressures
(annual percentage changes)

Sources: Eurostat and ECB calculations.
Note: The latest observations are for April 2022.
Market-based measures of euro area inflation compensation increased markedly for the very near term but declined somewhat for longer horizons amid intensifying supply-side constraints and a worsening economic outlook (Chart 13). Market-based measures of inflation compensation (based on HICP excluding tobacco) now suggest euro area inflation will peak at almost 9% during the third quarter of 2022. These measures of inflation compensation remain close to 8% until the end of 2022, around 3 percentage points higher than at the time of the March Governing Council meeting, before declining to levels slightly above 2.5% in mid-2024. At the same time, longer-term measures of inflation compensation have recently declined somewhat once again, after increasing strongly in the first half of the review period. The five-year forward inflation-linked swap rate five years ahead temporarily reached 2.49% at the beginning of May, before falling back to 2.28% at the end of the review period. Importantly, market-based measures of inflation compensation are not a direct measure of market participants’ actual inflation expectations, since they contain inflation risk premia to compensate for inflation uncertainty. Currently, these premia are assessed to be positive, implying that actual inflation expectations are estimated to be lower than the simple readings of market-based longer-term measures of inflation compensation and thus closer to the ECB’s symmetric 2% inflation target. According to the ECB’s Survey of Professional Forecasters (SPF) for the second quarter of 2022, longer-term inflation expectations (for 2026) rose further to 2.1%, while those of Consensus Economics stood at 1.9%.
Chart 13
Survey-based indicators of inflation expectations and market-based indicators of inflation compensation
(annual percentage changes)

Sources: Eurostat, Refinitiv, Consensus Economics, Survey of Professional Forecasters, Eurosystem staff macroeconomic projections for the euro area and ECB calculations.
Notes: The market-based indicators of inflation compensation series is based on the one-year spot inflation rate, the one-year forward rate one year ahead, the one-year forward rate two years ahead, the one-year forward rate three years ahead and the one-year forward rate four years ahead. The latest observations for market-based indicators of inflation compensation are for 8 June 2022. The Survey of Professional Forecasters for the second quarter of 2022 was conducted between 1 and 4 April 2022. In the Consensus Economics forecasts, the cut-off date for 2024, 2025 and 2026 was April 2022, and the cut-off date for 2022 and 2023 was May 2022. The cut-off date for data included in the Eurosystem staff macroeconomic projections was 24 May 2022.
The June 2022 Eurosystem staff macroeconomic projections for the euro area foresee headline inflation to remain elevated in the near term, before coming down to 3.5% in 2023 and 2.1% in 2024. Following the surge in inflation, the outlook is for higher and more persistent inflation, with headline inflation expected to remain very high in 2022, averaging 6.8%. This reflects elevated oil and gas prices, increases in prices of food commodities that have been strongly affected by the war in Ukraine, effects related to the reopening of the economy, and global supply shortages. Further ahead, exceptional developments in food and energy commodity prices are expected to moderate. This, together with the ongoing monetary policy normalisation embedded in interest rate assumptions, is expected to bring down headline inflation to 3.5% in 2023 and 2.1% in 2024. HICP inflation excluding energy and food is also expected to remain elevated in the near term on the back of supply bottlenecks, energy input costs and reopening effects. Towards the end of the projection horizon HICPX inflation declines as these pressures subside, but remains elevated due to wage growth well above the historical average in a context of tight labour markets, economic recovery and some effects from compensation for higher inflation. Compared with the March 2022 Eurosystem staff projections, the inflation outlook was revised up by 1.7 percentage points for 2022, 1.4 percentage points for 2023 and 0.2 percentage points for 2024.
Chart 14
Euro area HICP inflation and HICP inflation excluding energy and food (including projections)
(annual percentage changes)

Sources: Eurostat and the Eurosystem staff macroeconomic projections for the euro area (June 2022).
Notes: The vertical line indicates the start of the projection horizon. The latest observations are for the first quarter of 2022 (data) and the fourth quarter of 2024 (projections). The cut-off date for data included in the projections was 24 May 2022. Historical data for HICP inflation and HICP inflation excluding energy and food are at quarterly frequency. Forecast data are at quarterly frequency for HICP inflation and annual frequency for HICP inflation excluding energy and food.
4 Financial market developments
Over the review period (10 March to 8 June 2022), euro area risk-free rates increased significantly as market participants revised their expectations towards a more imminent tightening of monetary policy. As a result, the euro short-term rate (€STR) forward curve steepened markedly, with markets pricing in the first 25 basis point policy rate increase for the July meeting of the ECB’s Governing Council. Long-term bond yields rose globally as inflationary pressures fuelled expectations of faster monetary policy normalisation; at the same time, euro area sovereign bond yields generally increased in lockstep with risk-free rates, although spreads widened somewhat across countries. European equity and corporate bond markets went through two distinct phases: first, a recovery from war-induced losses, and then a weakening amid lower long-term earnings expectations and higher risk-free rates. Overall, the euro continued to depreciate in trade-weighted terms against a backdrop of mixed bilateral exchange rate developments.
Since the March Governing Council meeting, euro area risk-free rates have increased significantly as market participants have revised their expectations towards a more imminent tightening of monetary policy, with the first 25 basis point rate hike being priced in for the July Governing Council meeting. Over the review period the €STR averaged -58 basis points and excess liquidity increased by approximately €136 billion to €4,613 billion. At the same time, the overnight index swap (OIS) forward curve based on the benchmark €STR steepened following the April Governing Council meeting (Chart 15). This suggests that market participants revised their monetary policy expectations in light of the growing inflationary pressures and the Governing Council’s announcement to conclude net purchases under the asset purchase programme (APP) in the third quarter. As a result, the date implied by the market for a first 25 basis point policy rate increase was brought forward significantly to July 2022, with three more 25 basis point policy rate hikes priced in for 2022.
Chart 15
€STR forward rates
(percentages per annum)

Sources: Thomson Reuters and ECB calculations.
Note: The forward curve is estimated using spot OIS (€STR) rates.
Long-term bond yields have increased globally as inflationary pressures have fuelled expectations of faster monetary policy normalisation (Chart 16). During the review period, bond yields surged globally in anticipation of increases in central bank policy rates despite increasing downside risks to the economic outlook. In the euro area, the GDP-weighted average ten-year sovereign bond yield rose by 118 basis points to stand at 2.05%, a level last seen in mid-2015. Despite declining somewhat at the beginning of May, ten-year US sovereign bond yields increased by 102 basis points over the review period to reach 3.03%, broadly in line with movements in euro area rates. Similarly, yields on ten-year UK and German government bonds rose by 72 and 108 basis points to 2.25% and 1.36% respectively.
Chart 16
Ten-year sovereign bond yields and the ten-year OIS rate based on the €STR
(percentages per annum)

Sources: Refinitiv and ECB calculations.
Notes: The vertical grey line denotes the start of the review period on 10 March 2022. The latest observations are for 8 June 2022.
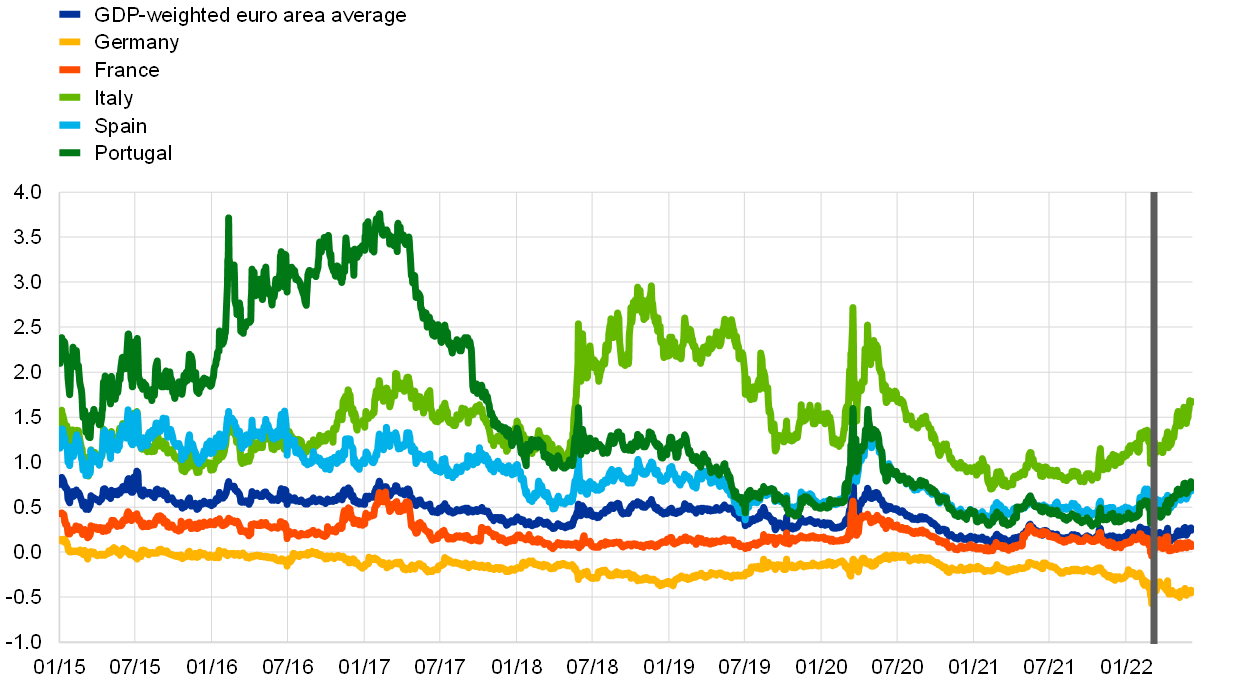
Overall, euro area sovereign bond yields increased in lockstep with risk-free rates, although spreads widened somewhat across countries (Chart 17). The ten-year GDP-weighted euro area sovereign spread over the OIS rate remained stable during the review period, increasing by a modest 9 basis points. A slightly stronger repricing occurred for high-debt countries with, for instance, the Italian and Portuguese ten-year sovereign bond spreads increasing by 44 and 27 basis points respectively over the review period, while the German ten-year Bund spread became more negative by 2 basis points.
Chart 17
Ten-year euro area sovereign bond spreads vis-à-vis the ten-year €STR OIS rate
(percentages per annum)
Sources: Refinitiv and ECB calculations.
Notes: The vertical grey line denotes the start of the review period on 10 March 2022. The latest observations are for 8 June 2022.
In the first half of the review period, corporate bond spreads declined on the back of improved risk sentiment but increased thereafter amid growing downside risks to the economic outlook and higher risk-free rates. After an initially strong decline on the back of improved risk sentiment, corporate bond spreads in the euro area increased markedly following the April meeting of the ECB’s Governing Council, with signs of an increasing differentiation between investment-grade and high-yield bonds. Over the review period, spreads on investment-grade non-financial corporate bonds fell by 2 basis points to 67 basis points, while spreads on financial corporate bonds fell by 5 basis points. As a result, spreads are close to their pre-pandemic averages and, at the moment, appear resilient in the face of the expected normalisation of monetary policy.
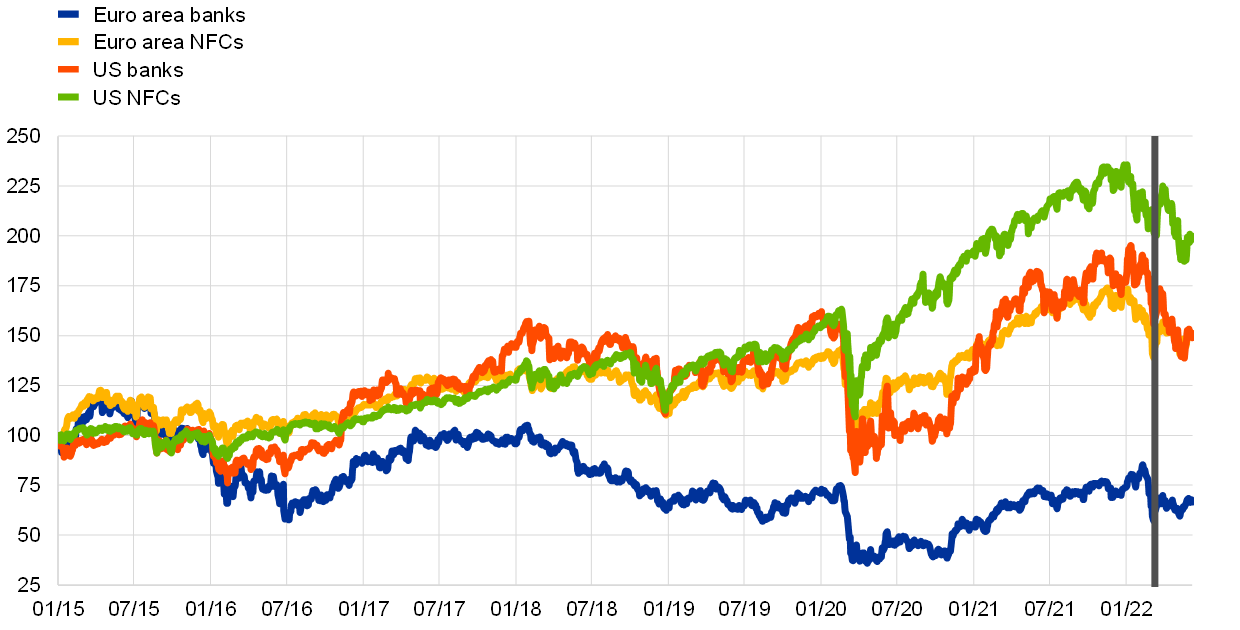
European equity markets, buoyed by improved sentiment, recovered at first from war-induced losses, before declining in the second half of the review period amid downside risks to the economic outlook, lower earnings expectations and higher risk-free rates (Chart 18). Following a decline related to the Russian invasion of Ukraine, European equity markets initially recovered on the back of stronger risk sentiment thanks to signs that the impact of the conflict might be contained and a surprisingly strong earnings season for the first quarter of the year. In the second part of the reporting period, however, equity prices declined somewhat on account of a more pessimistic economic outlook as new lockdown measures in China added to the uncertainty. As a result, longer-term earnings growth expectations started to decline, albeit from elevated levels. Over the review period, equity prices of euro area non-financial corporations (NFCs) and banks increased by 4.1% and 7.1% respectively, despite significantly higher risk-free rates. In the United States, the sell-off of risky assets on the back of growing fears of a recession led to overall declines of 3.7% and 7.5% in the equity prices of NFCs and banks respectively.
Chart 18
Euro area and US equity price indices
(index: 1 January 2018 = 100)
Sources: Refinitiv and ECB calculations.
Notes: The vertical grey line denotes the start of the review period on 10 March 2022. The latest observations are for 8 June 2022.
In foreign exchange markets, the euro continued to depreciate against the US dollar and in trade-weighted terms, amid otherwise mixed bilateral exchange rate developments (Chart 19). Over the review period the nominal effective exchange rate of the euro, as measured against the currencies of 42 of the euro area’s most important trading partners, weakened by 2.5%. This reflected a depreciation of the euro against the US dollar (by 3.5%), amid expectations of a faster pace of monetary tightening by the Federal Reserve System. The euro also depreciated against the currencies of a number of emerging market economies but, at the same time, appreciated against the Japanese yen (by 7.9%), the pound sterling (by 1.2%) and the Chinese renminbi (by 1.8%).
Chart 19
Changes in the exchange rate of the euro vis-à-vis selected currencies
(percentage changes)

Source: ECB.
Notes: EER-42 is the nominal effective exchange rate of the euro against the currencies of 42 of the euro area’s most important trading partners. A positive (negative) change corresponds to an appreciation (depreciation) of the euro. All changes have been calculated using the foreign exchange rates prevailing on 8 June 2022.
5 Financing conditions and credit developments
Bank funding and lending conditions continued to tighten in April and May, in the context of increased uncertainty regarding the economic outlook and firming expectations of normalisation of monetary policy. Bank lending rates for firms and households have started to reflect the overall increases in risk-free market rates. Over the review period the cost of market-based debt financing for firms increased substantially, while the cost of equity declined. Lending to firms and households remains robust. However, survey-based data show that firms of all sizes perceive that financing conditions have deteriorated. Money creation has continued to normalise, as the pace of deposit accumulation by firms and households has decreased further from the high levels recorded during the pandemic.
The funding costs of euro area banks have continued to rise amid firming expectations of monetary policy normalisation. In May, as shown by the nowcast, the composite cost of euro area banks’ debt financing continued the upward trend that started in August 2021 (Chart 20, panel a). This was mainly attributable to rising yields on bank bonds (Chart 20, panel b) and these, in turn, reflected the increase in risk‑free rates. Such upward pressure on overall bank funding costs has so far been contained by two factors. First, rates on deposits, which account for a large share of euro area banks’ funding, have remained stable and close to their historical lows. Second, targeted longer-term refinancing operations (TLTROs) have provided banks with liquidity at favourable conditions. Nonetheless, this cushioning effect is likely to wane in the coming quarters as deposit rates are expected to increasingly reflect the increase in market rates and TLTROs are repaid.
Chart 20
Composite bank funding rates in selected euro area countries
(annual percentages)

Sources: ECB, IHS Markit iBoxx indices and ECB calculations.
Notes: Composite bank funding rates are a weighted average of the composite cost of deposits and unsecured market-based debt financing. The composite cost of deposits is calculated as an average of new business rates on overnight deposits, deposits with an agreed maturity and deposits redeemable at notice, weighted by their respective outstanding amounts. Bank bond yields are monthly averages for senior-tranche bonds. The diamonds indicate nowcasts for banks’ composite cost of debt financing in May 2022, assuming that the composite cost of deposits and the respective outstanding amounts used as weights remained unchanged at their April 2022 level. The latest observations are for 31 May 2022 for bank bond yields and April 2022 for the composite cost of deposits.
Bank lending rates for firms and households have started to reflect the increases seen in risk-free market rates, but remain at low levels (Chart 21). The recent sharp increase in euro area government bond yields has started to pass through to lending rates, although financing conditions for firms and households remain favourable and dispersion of lending rates is contained, as measured by the cross-country standard deviation (Chart 21). In April the composite bank lending rate for loans to households for house purchase increased sharply by 14 basis points, to stand at 1.61%, while the equivalent rate for loans to non-financial corporations (NFCs) increased marginally to 1.51%. The spread between bank lending rates on very small loans and large loans increased considerably, reaching pre-pandemic levels. The increase in mortgage rates was broadly based across the larger euro area countries. Banks are also tightening their credit standards on loans to firms and households, which signals a forthcoming contraction in credit supply that may coincide with higher lending rates in the coming months. After a long period during which these remained compressed, loan-deposit margins on new business, defined as the difference between average interest rates on loans and average interest rates on deposits, have significantly increased. While the margins on outstanding amounts have still continued to decline, as loans tend to have longer durations than deposits and therefore take longer to reprice, over time the higher interest rate environment and a lower level of non-performing loans are expected to support bank profitability, provided that the economic outlook remains robust enough to avoid higher credit risk.[2]
Chart 21
Composite bank lending rates for NFCs and households in selected countries
(annual percentages, three-month moving averages; standard deviation)

Source: ECB.
Notes: Composite bank lending rates are calculated by aggregating short and long-term rates using a 24-month moving average of new business volumes. The cross-country standard deviation is calculated using a fixed sample of 12 euro area countries. The latest observations are for April 2022.
Over the period 10 March to 8 June 2022 the cost of market-based debt issuance for firms increased substantially, while the cost of equity financing for NFCs recorded a decline. The increase in the cost of market-based debt is accounted for by a significant increase in the risk-free rates, while corporate bond spreads declined marginally. The decline in the cost of equity can be attributed to a decline in the equity risk premium, as the uncertainty priced into equity markets fell notwithstanding the deterioration in long-term earnings growth expectations (see Section 4). The increase in the discount rate pushed the cost of equity upwards, but was not sufficient to compensate for the dampening impact of the decline in the equity risk premium. Assuming that the cost of bank borrowing has remained unchanged at the level recorded in April, the overall cost of external financing is estimated to have declined to 5.6% on 8 June 2022, down from 5.9% on 10 March (Chart 22). Since the beginning of 2022 the overall cost of financing has however recorded significantly higher values relative to the levels seen in 2020 and 2021.
Chart 22
Nominal cost of external financing for euro area NFCs, broken down by components

Sources: ECB and ECB estimates, Eurostat, Dealogic, Merrill Lynch, Bloomberg and Thomson Reuters.
Notes: The overall cost of financing for NFCs is calculated as a weighted average of the cost of borrowing from banks, market-based debt and equity, based on their respective outstanding amounts. The dark blue diamonds indicate the nowcast for the overall cost of financing in May and June 2022 (including data up to 8 June 2022), assuming that the cost of borrowing from banks remains unchanged at the level recorded in April 2022. The latest observations are for 8 June 2022 for the cost of market-based debt (monthly average of daily data), 3 June 2022 for the cost of equity (weekly data) and April 2022 for the cost of borrowing from banks (monthly data).
Firms also signalled a tightening of financing conditions in the April 2022 Survey on the Access to Finance of Enterprises (SAFE). A significantly higher percentage of firms reported increases in bank interest rates (34% of firms, up from 5% in the previous survey round), with similar developments across firm sizes and countries. At the same time, the net percentage of firms signalling increases in other costs of financing (i.e. charges, fees and commissions) continued to increase (reaching 37% from 29%) and stricter collateral requirements were also reported. Euro area firms regarded the macroeconomic environment as having adversely affected the availability of external financing (-29% in net terms, from 8%) and perceived that banks’ willingness to provide credit had still improved, but to a lesser extent than in the previous survey round. A synthetic indicator of how firms perceive the financing conditions that they face corroborates a deterioration across all firm size classes: about 20% of both large firms and small and medium-sized enterprises (SMEs) signalled a deterioration in the indicator, taking account of firms’ characteristics and the willingness of banks to provide credit (Chart 23).[3] Such elevated percentages have not been seen since mid-2014 and are consistent with available information from the banking sector.
Chart 23
Financing conditions as perceived by euro area firms
(weighted scores)

Source: ECB Survey on the Access to Finance of Enterprises.
Notes: The indicator is obtained by factor analysis. Positive values indicate a deterioration in firms’ financing conditions. For details, see the box entitled “Financing conditions through the lens of euro area companies”, Economic Bulletin, Issue 8, ECB, 2021. The individual scores are weighted by firm size class, economic activity and country to reflect the economic structure of the underlying population of firms. The individual scores are standardised, so they have a range of between -1 and 1 and are multiplied by 100 to obtain weighted balances in percentages. The first vertical grey line denotes the announcement of the Outright Monetary Transactions; the second vertical grey line denotes the start of the first series of targeted longer-term refinancing operations (TLTRO I) and the ECB’s negative interest rate policy; the third vertical grey line denotes the start of TLTRO II and the corporate sector purchase programme; and the last vertical grey line denotes the start of the pandemic emergency purchase programme and TLTRO III, coinciding with the beginning of the COVID-19 pandemic. The latest observations are for October 2021-March 2022.
At the same time, euro area firms anticipate a decline in their access to external financing, especially financing from banks. In particular, firms anticipate a deterioration in their access to bank loans and credit lines (-15% and -10% respectively) in the period April-September 2022. The expectation of a deterioration was common to most countries and firm size classes. In this survey round, a significant net percentage of euro area firms reported that changes in the general economic outlook had had a negative impact on their access to finance (in net terms, -29%, down from 8%), with a similar negative impact across SMEs and large firms, although the availability of external funds had still continued to improve, albeit at a slower pace. Overall, small improvements in firms’ access to external funds had broadly compensated for the moderate increases in their financing needs, so the external financing gap – the difference between the change in demand for external financing and the change in its supply – reached 1% (up from -4% in the previous round).
The annual growth of loans to NFCs and to households remained robust in April 2022. The annual growth rate of loans to NFCs accelerated to 5.2% in April, after standing at 4.1% in March and 4.6% in February (Chart 24, panel a). The recent increase in lending to firms largely reflects a base effect. Shorter-term loans made a strong contribution, given the persistence of supply chain bottlenecks and higher input costs, both of which contribute to higher working capital needs of firms. Conversely, longer-term loans made a smaller contribution, as the prevailing uncertainty is weighing on firms’ need to finance fixed investment. The annual growth rate of loans to households remained unchanged at 4.5% in April (Chart 24, panel b), supported by robust lending for house purchase, while consumer loans held up despite falling consumer confidence. As indicated by the ECB’s Consumer Expectations Survey, this could be related to households’ expectations of tighter access to credit and higher nominal borrowing costs next year. Aggregate developments at the euro area level mask increasing differences across countries, reflecting, among other things, the uneven impact of the pandemic and the fact that countries have made differing amounts of progress in terms of their economic recoveries.[4]
Chart 24
MFI loans in selected euro area countries
(annual percentage changes; standard deviation)

Source: ECB.
Notes: Loans from monetary financial institutions (MFIs) are adjusted for loan sales and securitisation; in the case of NFCs, loans are also adjusted for notional cash pooling. The cross-country standard deviation is calculated using a fixed sample of 12 euro area countries. The latest observations are for April 2022.
The total volume of external financing for firms moderated in the first quarter of 2022. The annual growth rate of external financing decreased from 2.9% in January to 2.5% in March, despite greater firm financing needs and the still low cost of debt financing. The moderation was most notable in the first two months of the year, following the high flows at the end of 2021 (Chart 25). In March external financing flows were supported by higher volumes of bank loans to firms, amid higher input costs, and by working capital spending, which was related to persistent supply bottlenecks. In addition, while net issuance of debt securities recovered towards the end of the quarter, the increase in the relative cost of market-based debt financing has induced firms to substitute debt securities issuance with bank borrowing. The issuance of listed shares was subdued in the first quarter, dampened by unusually large share buybacks and the higher cost of equity financing relative to other financing instruments.
Chart 25
Net external financing flows for euro area NFCs
(monthly flows in EUR billions)

Sources: ECB, Eurostat, Dealogic and ECB calculations.
Notes: Net external financing is the sum of borrowing from banks (MFI loans), net issuance of debt securities and net issuance of listed shares. MFI loans are adjusted for loan sales, securitisation and cash-pooling activities. The latest observations are for March 2022.
The pace of deposit accumulation by firms and households has decreased further from the high levels seen during the pandemic (Chart 26). In April the annual growth rate of overnight deposits continued to moderate, standing at 8.2%, down from 8.7% in March. The slowdown was observed for the overnight deposits of both firms and households, as higher costs for food and energy have reduced firms’ cash buffers and limited the capacity of households to accumulate savings. At the same time, higher uncertainty related to the economic impact of the war in Ukraine is still affecting deposit dynamics. As highlighted by the outbreak of the pandemic, firms and households respond to higher uncertainty with a change in their liquidity preferences, implying sizeable inflows into overnight deposits.[5] Growth in the deposit holdings of firms and households continues to vary across countries, reflecting differences in their liquidity needs and national fiscal support measures.
Chart 26
M3, M1 and overnight deposits
(annual growth rate; annualised six-month growth rate; adjusted for seasonal and calendar effects)

Source: ECB.
Note: The latest observations are for April 2022.
Broad money (M3) growth continued to move back towards its long-term average. In April the annual growth rate of M3 declined to 6.0%, down from 6.3% in March, thus bringing the (six-month annualised) growth rate below its long-term average for the first time since the outbreak of the pandemic (Chart 26). On the components side, the main driver of M3 growth continued to be the narrow aggregate M1, reflecting strong growth in overnight deposits. On the counterparts side, credit to the private sector continued to make the largest contribution to annual M3 growth, as the contributions of other components dwindled. The contribution of the Eurosystem’s net purchases of government securities under the asset purchase programme and the pandemic emergency purchase programme has been declining as purchases under these programmes are gradually being phased out. At the same time, money creation is being dampened by higher net monetary outflows to the rest of the world, largely reflecting the negative impact of higher energy prices on the euro area trade balance.
6 Fiscal developments
The euro area budget balance is projected to improve steadily in the period up to 2024, although by significantly less than foreseen in the March 2022 ECB staff macroeconomic projections and despite a better than expected outcome in 2021. The more adverse outlook is related to a worsening of the economic cycle, increased expected interest payments and additional discretionary government spending. Fiscal support measures have been aimed in particular at countering the rising cost of living for consumers, but also at financing defence capacities and supporting refugees from Russia’s war in Ukraine. Nonetheless, according to the June 2022 Eurosystem staff macroeconomic projections, the euro area government budget deficit is expected to continue falling – from 5.1% of GDP in 2021 to 3.8% in 2022 and further to 2.4% by the end of the forecast horizon. After the strong loosening during the coronavirus (COVID-19) crisis in 2020, the fiscal stance tightened last year and is projected to continue to tighten gradually in 2022 and 2023. The projected slight tightening in 2022 is mainly due to the reversal of a significant part of the COVID-19 pandemic emergency support, which will be only partially compensated by additional stimulus measures in response to the energy price shock and other spending related to the Russia-Ukraine war. The fiscal tightening is projected to be somewhat stronger in 2023, when many of the recent support measures compensating for the impact of high energy prices are projected to expire. In 2024 a more neutral stance is expected, although significant fiscal support to the economy is projected to remain in place compared to the pre-pandemic period. In a context of heightened uncertainty and downside risks to the economic outlook in the light of the war in Ukraine, as well as energy price increases and continued supply chain disturbances, the European Commission recommended on 23 May 2022 the extension of the general escape clause of the Stability and Growth Pact (SGP) to the end of 2023. This would allow fiscal policies to adjust to changing circumstances if necessary. At the same time, with fiscal imbalances still exceeding their pre-pandemic levels and inflation exceptionally high, fiscal policy needs to be increasingly selective and targeted in order not to add to medium-term inflationary pressures, while ensuring fiscal sustainability over the medium term.
According to the June 2022 Eurosystem staff macroeconomic projections, the euro area general government budget balance will continue to improve over the forecast horizon.[6] The general government deficit-to-GDP ratio for the euro area declined to 5.1% of GDP in 2021, after having reached an unprecedented 7.1% in 2020. It is projected to fall further to 3.8% of GDP in 2022 and then to 2.6% and 2.4%, respectively, in 2023 and 2024 (Chart 27). Following economic support measures amounting to around 3.9% of GDP in response to the COVID-19 pandemic in 2020, crisis and recovery support in the euro area is estimated to have increased to about 4.2% of GDP in 2021. This reflects the fact that governments prolonged and gradually expanded the scale of pandemic emergency measures and/or adopted new measures to support the recovery, including measures set out in their national recovery and resilience plans under the Next Generation EU (NGEU) package.[7] The large negative cyclical component, which contributed to the large increase in the government deficit in 2020, was moderately smaller in 2021. From 2022 onwards, the continued improvement in the budget balance is projected to be driven primarily by the economic cycle but also by a higher cyclically adjusted primary balance, as a large share of the emergency measures have started to expire and new measures are less sizeable. Over the whole forecast horizon, interest payments are now expected to contribute significantly more to the budget balance than previously expected. However, interest payments as a ratio of GDP will still be broadly in line with what has been observed between 2019 and 2021. This reflects the fact that, although interest rates on new issuances of sovereign debt have risen significantly, these are close to the average rate of interest paid on the existing stock of debt.
Chart 27
Budget balance and its components
(percentages of GDP)

Sources: ECB and June 2022 Eurosystem staff macroeconomic projections.
Note: The data refer to the aggregate general government sector of euro area countries.
The euro area fiscal stance tightened significantly in 2021, but should do so to a lesser extent in 2022 as governments adopt measures in response to the effects of the Russia-Ukraine war.[8] The tightening of the fiscal stance adjusted for NGEU grants in 2021 largely reflects non-discretionary factors, whereas discretionary fiscal measures remained supportive for the economy. In 2022 the fiscal stance is projected to tighten slightly, mainly owing to a continued withdrawal of a significant part of the pandemic emergency support, which will be only partly compensated by additional expansionary measures. These measures are aimed at countering the rising cost of living for consumers, but also at financing defence capacity and supporting refugees from the war in Ukraine. The fiscal tightening is projected to continue in 2023 when most of these measures are expected to have expired. At the end of the forecast horizon, a broadly neutral stance is expected, although significant support to the economy will remain in place.[9]
Despite the better than expected outcome in 2021, the euro area budget balance has been revised downwards over the whole forecast horizon. Compared with the March 2022 ECB staff macroeconomic projections, the euro area budget balance-to-GDP ratio in 2021 was 0.4 percentage points higher than expected, mainly on account of better than projected revenues. Despite this positive base effect, the budget balance has been revised down by 0.7, 0.5 and 0.4 percentage points per annum in 2022, 2023 and 2024 respectively. Cumulatively over the forecast horizon, these downward revisions are mainly due to a deterioration in the cyclical component and significantly higher interest payments, but additional discretionary stimulus measures also contribute to a downward revision of the primary balance by 0.3 percentage points in 2022.[10]
Following a large increase in 2020, the euro area government debt-to-GDP ratio fell slightly in 2021 and is expected to shrink slowly to just below 90% by 2024, well above its pre-crisis level. After the debt ratio increased by about 13 percentage points to 97% in 2020, a falling but still high primary deficit in 2021 is estimated to have been more than offset by a significant debt-reducing contribution from a favourable interest rate-growth differential. Throughout the period 2022-24, the debt ratio is projected to continue declining slowly but steadily as debt-increasing primary deficits are outweighed by still favourable contributions from interest rate-growth differentials and, to a limited extent in the first two years, from deficit-debt adjustments (Chart 28). At the end of the projection horizon in 2024, the debt-to-GDP ratio is expected to stabilise at just below 90%, i.e. 12 percentage points above its pre-crisis level in 2019.
Chart 28
Drivers of change in euro area government debt
(percentages of GDP, unless otherwise indicated)

Sources: ECB and June 2022 Eurosystem staff macroeconomic projections.
Note: The data refer to the aggregate general government sector of euro area countries.
The baseline fiscal assumptions and projections continue to be surrounded by high uncertainty, mainly related to the war in Ukraine. In terms of fiscal assumptions, risks to the current baseline are tilted towards additional fiscal stimulus in the near term. Such risks are assessed as being concentrated in 2022 and relate to further compensatory energy measures and other spending related to the effects of the war. Risks to fiscal developments over the remainder of the forecast horizon are assessed as broadly balanced.
Targeted and temporary budgetary measures protect those people bearing the brunt of higher energy prices while limiting the risk of adding to inflationary pressures. In a context of heightened uncertainty and downside risks to the economic outlook in the light of the Russia-Ukraine war, energy price rises and continued supply chain disturbances, on 23 May 2022 the Commission recommended the extension of the SGP’s general escape clause to the end of 2023.[11] This would allow fiscal policies to adjust to changing circumstances if necessary. In the medium term, a decisive shift towards a more growth-friendly composition of public finances and structural reforms that raise the growth potential of euro area economies would create additional fiscal room for manoeuvre if needed, while also helping to reduce budgetary imbalances.
Boxes
1 The impact of the war in Ukraine on euro area energy markets
The war in Ukraine has generated a sharp increase in energy prices and significant volatility in energy markets. Amid fears of disruptions to energy supplies and increasingly strict sanctions on the Russian energy sector, prices have fluctuated, in particular as markets have tried to assess the potential implications for global energy supplies. Given their heavy reliance on Russian supplies before the invasion, euro area energy markets have been especially affected. This box provides an overview of the impact that the war in Ukraine has had on euro area energy markets so far. It outlines Russia’s role in the euro area’s energy supply and looks at measures that have influenced prices. In this context, it also discusses the implications for euro area energy commodity and consumer prices.
More2 The impact of the Russian invasion of Ukraine on euro area activity via the uncertainty channel
Russia’s invasion of Ukraine has significantly increased uncertainty in the euro area. While the very high energy prices and renewed supply shortages resulting from the war are key observable factors affecting economic activity, a third unobservable factor – the associated rise in uncertainty – is also playing a major role. The economic literature defines an uncertainty shock as an outcome of a random event (such as a war) that makes the economic outlook less predictable.[12] As a result of such an increase in uncertainty, economic confidence declines, leading to cuts in the expected spending of households and businesses. This box aims to study the macroeconomic implications of the heightened uncertainty in the euro area that has been triggered by the invasion of Ukraine, focusing on GDP, domestic demand (such as business investment and consumption) and developments in major individual sectors (such as manufacturing and services, and durable and non-durable goods).
More3 The impact of the influx of Ukrainian refugees on the euro area labour force
The war in Ukraine has triggered the largest displacement of European citizens since the Second World War, with women and children accounting for the vast majority of refugees.[13] According to the United Nations High Commissioner for Refugees (UNHCR), around seven million people have already crossed Ukraine’s borders (Chart A).[14] As Chart A shows, an average of around 330,000 refugees are currently leaving Ukraine for neighbouring countries each week. The UNHCR estimates that a total of up to 8.3 million refugees could have fled Ukraine by the end of the year and that up to 25 million people could be displaced and require humanitarian aid as a result of the war.[15] On the basis of this estimate, the total number of Ukrainian refugees is expected to keep growing in the coming weeks, but this is highly dependent on the duration and severity of the war. While the total number of Ukrainian refugees is increasing, a significant number of people – around 2.1 million – have temporarily re-entered Ukraine. The UNHCR indicates that such cross-border movements may be pendular and should not be regarded as permanent returns, so they have not been deducted from the gross figure.
More4 The impact of climate change on activity and prices – insights from a survey of leading firms
This box summarises the findings from a recent ECB survey of leading firms on the impact of climate change on economic activity and prices. The survey was structured in three parts and covered questions related to the impact on businesses of climate change and related measures and policies. The first part invited firms to identify in their own words (i) the main impact of climate change and related adaptation and mitigation measures on their business, (ii) the main challenges they face in transitioning to a net-zero economy, and (iii) which climate-related policies they expect to have the biggest impact – and which ones could help their company tackle the transition.[16] The second part of the survey asked firms whether they agreed or disagreed with various statements on how climate change and related adaptation and mitigation measures would affect their business. The third part asked them to assess in qualitative terms the impact of climate change on their investment, employment, productivity, costs and prices, distinguishing between the impact “until now” and the impact “during” and “after” the transition to a net-zero economy. The survey was carried out in early 2022, and responses were received from 90 large and mostly multinational companies with which the ECB maintains contact as part of its regular gathering of business intelligence.[17] A breakdown of the survey sample by sector of activity is provided in Table A.
More5 Does the private sector foresee a stagflation episode?
Does the private sector currently expect a period of stagflation in the euro area? Before the war in Ukraine the reopening of the economy in 2021 was facing headwinds related to lingering supply-chain disruptions, and goods inflation had already picked up.[18] The war that broke out in February 2022 has exacerbated inflation dynamics due to its effects on energy prices and has increased concerns about the outlook for economic activity. This is inevitably associated with stagflationary forces in the short term. Their occurrence has triggered a debate among economic commentators about whether a protracted period of stagflation is plausible.[19] “Stagflation” has no unique definition but is associated with stagnating output and persistently high inflation occurring simultaneously. For the purposes of this box an expected stagflationary episode fulfils three conditions: (1) inflation expectations are high or increasing to levels that are inconsistent with the ECB’s price stability objective of two per cent, (2) the economy is expected to be in stagnation or recession, and (3) both conditions are expected to continue for at least a two-year period (in this case until the end of 2023). Stagflation expectations thus can be seen to relate to medium-term developments in real GDP growth and inflation, rather than the short-term dynamics of economic activity and inflation in the quarters immediately following the Russian invasion of Ukraine.
More6 The surge in euro area food inflation and the impact of the Russia-Ukraine war
Euro area HICP food inflation reached a new historical high in May 2022 as already existing price pressures in the food sector intensified following the Russian invasion of Ukraine. The war and its repercussions are hindering imports of energy and food commodities in the euro area and contributing to higher global prices. The situation is exacerbating already existing pressures in both global and euro area food markets. This box examines recent developments in euro area food inflation and the channels through which it is affected by the Russia-Ukraine war.
More7 A new indicator of domestic inflation for the euro area
In this box, we present a new measure of domestic inflation for the euro area that takes into account the import intensity of HICP items. For this new indicator, the import intensities of HICP items are derived using information from national accounts and input-output tables. The HICP items with a relatively low import intensity are subsequently aggregated to what is referred to as a “Low IMport Intensity” (LIMI) inflation indicator.[22] The threshold for the import intensities, below which an HICP item is included in the indicator, is determined on the basis of empirical criteria. While the ECB’s inflation target is formulated in terms of headline inflation, the concept of domestic inflation is of analytical relevance to monetary policy, as it features prominently in the monetary policy transmission mechanism.[23] The GDP deflator is a commonly used indicator of domestic inflation, but while it discounts for imported inflation it captures price developments beyond consumer prices, such as prices for investment goods or exports that may not be very closely linked to domestically-driven consumer price inflation. In addition, standard exclusion-based indicators of core inflation may still include items that may have a high import intensity. The newly developed LIMI inflation indicator can complement some of these other indicators. It suggests that, although the sharp rise in headline inflation is mainly explained by imported inflation, domestic inflationary pressures have also increased over the past year.[24]
More8 Liquidity conditions and monetary policy operations from 9 February to 19 April 2022
This box describes the ECB’s monetary policy operations and liquidity developments during the first and second reserve maintenance periods of 2022. Together, these two maintenance periods ran from 9 February 2022 to 19 April 2022 (the “review period”).
MoreArticles
1 Energy price developments in and out of the COVID-19 pandemic – from commodity prices to consumer prices
Record-high energy price increases at the end of 2021 and beginning of 2022 put significant pressures on the purchasing power of consumers.[25] These increases followed a marked decline in energy prices at the onset of the coronavirus (COVID-19) pandemic. While the initial rise in energy prices was mainly driven by the recovery in energy demand following the easing of lockdown measures after the first wave of the pandemic, the subsequent price rally during 2021 was also significantly affected by supply-side issues. This development was aggravated in early 2022 by the Russian invasion of Ukraine. The increase in European gas prices since the summer of 2021 has been particularly sharp, reflecting a combination of supply and demand factors that left European gas inventories at historically low levels ahead of the winter season and the gas market vulnerable to supply and demand uncertainty, including from escalating geopolitical tensions. As a result, consumer gas and electricity prices – both driven by natural gas prices – played an increasingly important role in developments in HICP energy and were accompanied by unprecedented cross-country heterogeneity in energy price developments.
More2 Firm debt financing structures and the transmission of shocks in the euro area
The debt financing structure of euro area firms has broadened since the introduction of the euro as the common currency. While bank loans still account for a major share of corporate debt, euro area firms have increasingly resorted to bond financing, especially following the global financial crisis (GFC) of 2008-09.[26] As a result, the outstanding volume of bonds relative to bank borrowing by euro area firms has risen to around 30%, up from roughly 15% in mid-2008.[27] Corporate bond markets have therefore emerged as an increasingly significant determinant of euro area credit conditions over the past decade and a half.
More3 The euro short-term rate (€STR): completing the transition to the new euro benchmark
The euro short-term rate (€STR), which has been published by the ECB since October 2019, is the overnight interest rate benchmark for the euro. The €STR shows the average rate at which banks borrow overnight (one-day) deposits from other financial institutions, including non-banks, on an unsecured basis, i.e. without having to provide collateral. The €STR is published on each TARGET2 business day on the basis of transactions conducted and settled on the previous TARGET2 business day.[28]
MoreStatistics
Statistical annex© European Central Bank, 2022
Postal address 60640 Frankfurt am Main, Germany
Telephone +49 69 1344 0
Website www.ecb.europa.eu
All rights reserved. Reproduction for educational and non-commercial purposes is permitted provided that the source is acknowledged.
This Bulletin was produced under the responsibility of the Executive Board of the ECB. Translations are prepared and published by the national central banks.
The cut-off date for the statistics included in this issue was 8 June 2022.
For specific terminology please refer to the ECB glossary (available in English only).
ISSN 2363-3417 (html)
ISSN 2363-3417 (pdf)
QB-BP-22-004-EN-Q (html)
QB-BP-22-004-EN-N (pdf)
See the European Commission’s Biannual survey of investment intentions, conducted in March/April 2022, which shows a decline in manufacturers’ investment plans for 2022 compared with plans made late last year but improvements in services.
See the ECB’s Financial Stability Review, May 2022.
The indicator is one of the three principal components derived from a factor analysis using firm-level survey replies since 2009 and is interpreted as relating to price terms and conditions on loans, the other two components being related to the financial positions of firms (in terms of profits and turnover) and to non-price terms and conditions (collateral requirements and other guarantees). For a detailed description of the indicator, see the box entitled “Financing conditions through the lens of euro area companies”, Economic Bulletin, Issue 8, ECB, 2021.
See the box entitled “The heterogeneous economic impact of the pandemic across euro area countries”, Economic Bulletin, Issue 5, ECB, 2021.
See the box entitled “COVID-19 and the increase in household savings: an update”, Economic Bulletin, Issue 5, ECB, 2021.
See “Eurosystem staff macroeconomic projections for the euro area, June 2022”, published on the ECB’s website on 9 June 2021.
NGEU grants amount to around 0.5% of GDP, on average, over the projection horizon, declining gradually after 2023. Together with a limited amount of loans, they are assumed to finance budget spending of 2.7% of GDP. The fiscal developments described in this section do not include the European supranational deficit and debt related to NGEU transfers.
The fiscal stance reflects the direction and size of the stimulus from fiscal policies to the economy beyond the automatic reaction of public finances to the business cycle. It is measured here as the change in the cyclically adjusted primary balance ratio net of government support to the financial sector. Given that the higher budget revenues related to NGEU grants from the EU budget do not have a contractionary impact on demand, the cyclically adjusted primary balance is in this context adjusted to exclude those revenues. For more details on the concept of the euro area fiscal stance, see the article entitled “The euro area fiscal stance”, Economic Bulletin, Issue 4, ECB, 2016.
The euro area aggregate fiscal stance was -4.0 percentage points of GDP in 2020 and is estimated to have been +1.0 percentage points of GDP in 2021. It is projected to stand at +0.2, +0.6 and +0.1 percentage points of GDP in 2022, 2023 and 2024 respectively, after adjustment for revenues related to NGEU grants. Compared to the March 2022 projections, it has been revised down by 0.8 percentage points for 2022 and up by 0.3 percentage points for 2023.
Additional government support to compensate for higher energy prices and other spending in response to the war in Ukraine is estimated to amount to 0.9% of GDP in 2022.
See Communication from the Commission to the European Parliament, the Council, the European Central Bank, the European Economic and Social Committee, the Committee of the Regions and the European Investment Bank: 2022 European Semester – Spring Package, COM(2022) 600 final, European Commission, 23 May 2022.
See Jurado, K., Ludvigson, S.C. and Ng, S., “Measuring uncertainty”, American Economic Review, Vol. 105, No 3, 2015, pp. 1177-1216; and Scotti, C., “Surprise and uncertainty indexes: Real-time aggregation of real-activity macro-surprises”, Journal of Monetary Economics, Vol. 82, 2016, pp. 1-19.
See https://www.pewresearch.org/fact-tank/2022/03/25/after-a-month-of-war-ukrainian-refugee-crisis-ranks-among-the-worlds-worst-in-recent-history for an international comparison over the last 60 years.
Total as at 1 June 2022; see https://data2.unhcr.org/en/situations/ukraine for daily updates. The gross figure of seven million represents 15.9% of Ukraine’s pre-war population of 44 million.
For further details and updates, see https://www.unhcr.org/refugeebrief/latest-issues.
Adaptation measures refer to actions taken by firms to adapt to climate change and its effects. Mitigation measures refer to actions taken to reduce emissions with the aim of containing climate change.
The survey of leading firms took place in the context of the ECB’s dialogue with non-financial companies as a special survey in addition to the regular survey rounds. The regular survey is described in “The ECB’s dialogue with non-financial companies”, Economic Bulletin, Issue 1, ECB, Frankfurt am Main, 2021.
See Box 7 entitled “Sources of supply chain disruptions and their impact on euro area manufacturing”, Economic Bulletin, Issue 8, ECB, 2021, and Box 1 entitled “Supply chain bottlenecks in the euro area and the United States: where do we stand?”, Issue 2, ECB, 2022.
See for example Blanchard , O., “Why I worry about inflation, interest rates, and unemployment”, Real Time Economic Issues Watch, Peterson Institute for International Economics, March 2022, and Kilian, L., and Plante, M., “The Russian Oil Supply Shock of 2022”, Dallas Fed Economic, Federal Reserve Bank of Dallas, March 2022.
Deutsche Bundesbank.
Deutsche Bundesbank.
In general, HICPs are designed according to the domestic concept, i.e. the HICP refers to products that are bought in a given country. By contrast, the idea behind the indicator of “domestic” inflation means that some parts of HICP components are produced in a foreign country, such that price developments in those “non-domestic” parts should mainly be driven by foreign market conditions.
The concept of domestic inflation, as used in this box, is closely related to the concept of non-tradable inflation. The difference is that the concept of non-tradable inflation considers the export intensity and the import intensity of different goods and services for all uses, while domestic inflation refers to goods and services produced for domestic consumption with a low import intensity.
See F. Panetta, “Small steps in a dark room: guiding policy on the path out of the pandemic”, speech at the European University Institute, 28 February 2022, and F. Panetta “Patient monetary policy amid a rocky recovery”, speech at Sciences Po, 24 November 2021. Note that the LIMI inflation indicator referred to in these speeches is based on the World Input-Output Database (WIOD), which was subsequently revised using a mapping system based on Eurostat’s FIGARO (Full International and Global Accounts for Research in Input-Output analysis) database.
See the article entitled “Energy prices and private consumption: what are the channels?”, Economic Bulletin, Issue 3, ECB, 2022.
Throughout this article, we refer to corporate bond finance as also including shorter-term debt securities, such as commercial paper. In the euro area, the outstanding amounts of short-term debt securities reached around €120 billion at the end of 2021, corresponding to roughly 7% of the overall outstanding amount of corporate debt securities.
See, for example, Cappiello, L., Holm-Hadulla, F., Maddaloni, A., Mayordomo, S., Unger, R. et al., “Non-bank financial intermediation in the euro area: implications for monetary policy transmission and key vulnerabilities”, Occasional Paper Series, No 270, ECB, Frankfurt am Main, December 2021. The relative role of bond financing has also risen in other major economies over this period. In the United States, for instance, the outstanding volume of bonds relative to bank borrowing by firms has increased to around 65%, from roughly 50% in mid-2008.
TARGET2 is the real-time gross settlement system owned and operated by the Eurosystem. TARGET2 settles payments related to the Eurosystem’s monetary policy operations, as well as bank-to-bank and commercial transactions, see What is TARGET2? on the ECB’s website. A TARGET2 business day means in this context a day on which TARGET2 operates.