

- SPEECH
The transmission of monetary policy
Speech by Philip R. Lane, Member of the Executive Board of the ECB, at the SUERF, CGEG|COLUMBIA|SIPA, EIB, SOCIÉTÉ GÉNÉRALE conference on “EU and US Perspectives: New Directions for Economic Policy”
New York, 11 October 2022
Introduction
In our September monetary policy meeting, the ECB’s Governing Council communicated that, over the next several meetings, we intend to raise our key policy rates towards levels that will ensure the timely return of inflation to our two per cent medium-term target.[1]
In identifying the appropriate levels for the key policy rates, a range of factors must be considered. First, an assessment of the medium-term outlook for inflation is required: the quarterly staff macroeconomic projection exercises provide important foundations, while each meeting also draws on wide-ranging overviews of the latest economic, financial and market developments in order to develop an assessment of both the most-likely medium-term inflation path and the balance of risks around that path. Second, this assessment forms the basis for calculating the monetary policy path that is required to eliminate in a timely manner the gap between the projected inflation rate (that would be expected to materialise if monetary policy were not modified) and the two percent inflation target, while also narrowing the distribution of inflation risks around the most-likely path.
This calibration stage crucially relies on a quantitative analysis of the various stages in the monetary policy transmission mechanism. Working backwards, monetary policy can be viewed as affecting inflation through two main channels: (a) reducing inflationary pressure by increasing economic slack (lowering aggregate demand relative to the supply capacity of the economy); and (b) ensuring that medium-term inflation expectations are anchored at the two per cent target.[2]
The first channel can be de-composed into several links: (i) the link between our monetary policy instruments – our policy rates, our balance sheet policies and our communication policy (including any forward guidance) – and financial conditions; (ii) the link between financial conditions and economic slack; and (iii) the link between economic slack and inflation pressures. The second channel can be broken down into a further two elements: (iv) if inflation expectations are broadly anchored, the monetary policy needed to ensure expectations remain anchored; and (v) if inflation expectations are de-anchored (or at serious risk of being de-anchored), the monetary policy needed to ensure inflation expectations are re-anchored.
In what follows, I will discuss some of the challenges in forming quantitative assessments of the strength of these various mechanisms. First, I will discuss the various mechanisms by which monetary policy operates. Second, I will assess how the considerable shift in monetary policy during this year is being transmitted.
However, from the outset, it is essential to make three basic points. First, monetary policy is always decided under conditions of uncertainty: not only uncertainty about inflation dynamics but also uncertainty about each of the channels connecting medium-term inflation to our monetary policy instruments. This uncertainty is mitigated to some extent by taking a meeting-by-meeting approach to calibrating monetary policy, such that the latest information can be incorporated (including updates on the strength of the transmission mechanism). Second, the considerable lags between monetary policy actions and their impact on inflation outcomes also imply that much of the near-term attention in assessing monetary policy actions focuses on the transmission to financial conditions (and, where feasible, inflation expectations). Assessing the ultimate impact on inflation dynamics, meanwhile, must rely on analytical tools that seek to draw on the historical evidence in the most informative way, recognising the relevant differences across previous inflation episodes. Third, in the absence of further shocks, the profile of euro area inflation over the next 12 to 18 months will be primarily driven by the fading impact of past supply shocks and the deceleration in demand that is signalled by the latest confidence indicators: the role of monetary policy is to ensure that the “residual” inflation dynamic returns to target in a timely manner.
The transmission channels of monetary policy
Let me start by outlining the main transmission channels of monetary policy. Conceptually, the monetary policy transmission process can be divided into upstream stages of transmission and downstream effects.[3] The upstream stages include our steering of the short-term money market conditions and how these propagate to the risk-free and sovereign yield curves (mainly through expectations of the future path of policy rates). The downstream effects are captured by the adjustments in the cost and volume of external finance available to the firms and households that are dependent on banks for access to credit. I will begin with the upstream stages of the transmission mechanism and then turn to the downstream effects.
Monetary policy works through its influence on the entire yield curve.[4] Changes in the policy rates directly affect only very short-term money-market interest rates. But the expectations of future policy rates are a primary determinant of medium and long-term interest rates, together with term premia. It is the adjustment in term interest rates along the risk-free and sovereign curve that matters most for the economy, as these directly affect the conditions under which firms, banks and governments can borrow in financial markets and indirectly affect the cost of borrowing of firms and households to the extent that they rely on bank borrowing, since banks price their loans off the risk-free or sovereign yield curve.
In addition to the rate expectations mechanism, our securities holdings are still bearing down on long-term interest rates through what is known as the duration extraction effect. Duration risk exposure is costly for private investors, as they need to set aside capital and balance sheet space to bear this type of exposure. This is why investors demand compensation in the form of higher expected returns when locking in long-dated fixed-income investments, which in turn translates into higher term premia and long-term yields. In purchasing long-dated assets, a central bank takes duration risk off private hands, which translates into lower term premia and long-term interest rates.[5] As the Eurosystem – in common with many other central banks – still holds a considerable portion of the universe of euro-denominated bonds, our holdings are still exerting downward pressure (albeit more weakly) on term premia and long-term yields.
The extent to which a reduction of the central bank balance sheet operates in a fashion that is fully symmetric to the effects of expanding the balance sheet still awaits to be authoritatively settled, given the dearth of sufficient evidence on episodes of bond portfolio wind-downs. This being said, the available analysis finds that some of the channels that are found to have been important in explaining the transmission of quantitative easing – announcement and signalling effects – may be absent or much diminished if the size of the balance sheet is reduced along a much more gradual and predictable path than the discrete and often unexpected actions through which QE was conducted in the past. At the same time, some other channels, such as the duration channel or liquidity effects, will probably either operate symmetrically or will be magnified.[6] Moreover, the degree of financial market distress during the expansionary and contractionary phase and, in particular in the euro area context, the complementarities between asset purchases, rate guidance and the negative interest rate policy are likely to be relevant factors.[7]
Overall, a tentative conclusion about the impact of balance sheet actions on financial conditions in a normalisation phase is that the signalling channel will be weaker for a given adjustment to the size and composition of our balance sheet than it was in a phase when our asset purchase programmes resulted in a rapid increase in our securities holdings during a relatively short period.
However, the signalling effects emanating from a given rate adjustment may well be larger than it is estimated to have been the case prior to the financial crisis. First, the exit from the negative interest rate policy may have strengthened the transmission of a rate hike throughout the term structure of interest rates. This would be the case if the unwinding of the outsized downward pressure on long-term yields that is estimated to have been associated with rate cuts in the negative territory was symmetric.[8] Second, the retirement of rate forward guidance after years in which forward indications about the likely future path of interest rates had suppressed rate volatility almost entirely may invite markets to react to a rate increase by pulling back more sharply from longer-term securities as dealers and other providers of trading liquidity are less willing to put capital at risk to make two-sided markets in a context of perceived higher interest rate uncertainty. This may exert greater upward pressure on term premia and the level of long-term yields.
The risk of snap-back in term premia and the sudden repricing of rate expectations warrant close monitoring from a market functioning and broader financial stability perspective.
Interest rate and cash-flow channels
Interest rate changes affect households and firms through several channels. First, via the intertemporal substitution channel, higher interest rates provide incentives to households to save more now and postpone consumption from the present to the future. Second, all else being equal, higher interest rates lower asset prices (bond values, equity values and property values), with the resulting decrease in wealth discouraging spending through the wealth channel and reducing the scope to pledge collateral in debt transactions.
The role of equity markets is particularly important for firms with higher growth opportunities, whose risk profile is typically more suited to market financing instruments with the possibility of risk-sharing (including private equity or “alternative investment” funds) rather than conventional bank debt. Recent studies suggest that there is a financing gap in Europe for potential growth companies relative to other economies, which significant drops in equity valuations would tend to aggravate.[9]
In parallel, the relevance of asset prices may have increased for households, following the significant growth in house prices. Moreover, after a large fall of their investment in financial markets following the Lehman crisis, the share of equity holdings in the aggregate financial wealth of households has been increasing.
Third, the cash-flow channel operates through the impact of higher interest rates on the income and expenses of households and firms.[10] Across households and firms, the size and sign of cash flow effects depend on whether these are in net borrowing or net saving positions, the relative exposure to variable rate versus fixed rate debt (Chart 1), and the degree to which financial constraints are binding.[11],[12] In one direction, higher interest rates raise interest payments by indebted households and corporates, which reduces the cash flow available for spending. A similar effect applies to the interest expenses of the fiscal authority, which may crowd out primary spending to the extent that governments react to an increase in borrowing costs by compressing discretionary outlays.
In the other direction, higher interest rates increase the interest revenues on the interest-bearing assets held by households and firms. Changes in interest rates also directly affect the liquidity and balance sheet strength of firms, which may adjust their investment spending in response, especially if these are financially constrained.
Whereas variable-rate debt reflects changing interest rates almost immediately, fixed-rate debt does so only over time. While at the euro area level around 70 per cent of outstanding loans to households are at a fixed interest rate, this share is as high as around 90 per cent in France and Germany and as low as 25 per cent in Spain and Italy.[13] This in turn points to relevant differences in the speed at which interest rate changes are passed through to households and firms.
Chart 1: Share of fixed-rate loans for households and firms in the euro area
(percentages, based on amounts outstanding)

Source: ECB (BSI).
Latest observation: August 2022.
Bank lending channel
In the euro area’s bank-centred economy, the bank lending channel plays an important role. It covers the transmission through banks to a larger share of firms, also including smaller firms which do not issue bonds, as well as to households.[14]
Bank funding costs are the first important element in the bank lending transmission channel. For about half of banking-sector liabilities, corresponding to debt securities and wholesale deposits, the remuneration is closely linked to market rates and therefore passed through quickly to the marginal funding costs of banks.[15] By contrast, retail deposit rates adjust more sluggishly, keeping the rise in bank funding costs contained in a period of interest rate increases.
In addition, TLTROs allowed for a compression in the intermediation wedge - the difference between the cost of loans and the risk-free interest rate. TLTRO therefore operated primarily via the bank lending channel - by providing funding certainty at attractive rates, which lowered the cost of loans for households and firms - rather than via risk free rates.[16] At the same time, in the absence of new operations, TLTROs no longer have a direct accommodative contribution to the marginal funding costs of banks.
The increase in market rates is transmitted via bank funding costs to bank lending rates on new loans (the interest rate channel) as well as via repricing of the existing stock of flexible-rate debt. In relation to the former, banks apply a markup on top of their funding cost, depending on borrower risk characteristics. In addition, increasing interest rates, typically associated with a decline in asset prices, may lower the value of collateral and hence determine an increase in lending rates over and beyond that associated with higher base rates and thereby impede access to bank loans. Furthermore, tight monetary policy drains reserves from the banking system, limiting the ability of banks to supply credit.
As a result of the several steps in the transmission of monetary policy via the banking system, the pass-through of monetary policy to lending rates on new loans is slower than to market-based debt (Chart 2). Using historical regularities (excluding the COVID period due to its exceptional character), a commonly used measure looks at the percentage of changes in market rates which translates over time into changes in lending rates on new loans (i.e. the so-called pass-through). Looking at pass-through measures, the repricing of corporate debt securities is much faster than the repricing of bank loans. In particular, a change in market rates is fully transmitted to a corresponding change in corporate bond yields within the same quarter (the pass-through rate is about one), while for lending rates it usually takes about six months to one year until changes in market rates are passed through to corporate bank lending rates.
Chart 2: Pass-through of changes in market rates to lending and debt securities rates over time
(x-axis: time horizon; y-axis: percentages)

Sources: ECB (MIR, BSI), IHS Markit iBoxx and ECB calculations.
Notes: Estimates of lending rates pass-through are from Altavilla, C, F. Canova and Ciccarelli M., Mending the broken link: Heterogeneous bank lending rates and monetary policy pass-through, Journal of Monetary Economics 2020, Volume 110, 2020, Pages 81-98.
In addition to the transmission via lending rates, monetary policy is also transmitted to borrowers by banks adjusting their credit standards. Data on bank lending standards are collected directly from the banks in the euro area bank lending survey and monitored carefully to obtain early signals on future loan growth developments.
Risk-taking channel
An extended period of historically low interest rates in the aftermath of the financial crisis has fostered research on whether economic agents, in those conditions, might be encouraged to take on more risk and search for investment assets and strategies that generate higher investment returns. Importantly, banks and other investors may also be subject to excessive tolerance of risk in a low-return environment.[17] These may not adequately adjust their expectations about future interest rates, assuming instead that rates will remain low for an extended period. This, in turn, may encourage banks to expand their balance sheets through leverage and originate an excessive amount of lower-quality credit because of softened lending standards.
The build-up of financial imbalances associated with the over-expansion of the balance sheets of banks and other financial intermediaries makes them vulnerable to a pivot in monetary policy, leading in the most extreme case to a rapid unwinding of those positions as investors become risk averse. This can lead to an amplified effect of a firming in the monetary policy stance through generalised conditions of reduced liquidity and forced asset sales.
Exchange rate channel
Finally, interest rate and balance sheet policies also operate through an exchange rate channel.[18] The uncovered interest rate parity (UIP) suggests that an upward shift in the risk-adjusted forward rate curve brings about an appreciation of the euro.[19] Simple correlations between the exchange rate and interest rate expectations suggest that this relation has held up reasonably well historically and more recently in terms of the euro-US dollar bilateral exchange rate as well as in the cross-section of the effective exchange rates of major currencies.
ECB model-based decompositions of financial asset price movements across the United States and the euro area point to a prominent role of US monetary policy tightening in driving the increase in euro area yields, the correction in euro area equity markets, and the recent euro depreciation. In fact, US monetary policy spillovers have had at least as much of an impact on euro area asset prices and the euro-dollar exchange rate over the last 12 months as ECB monetary policy actions.[20] At the same time, while both rate normalisation and balance sheet normalisation in the euro area, all other things being equal, can be expected to exert appreciation pressure on the euro exchange rate, rate policies exert a stronger exchange rate effect than balance sheet policies.[21]
Spillovers
The deeply integrated nature of the global economy implies that our analysis needs to incorporate international monetary policy spillovers. For instance, changes in the interest rate locally affects domestic consumption and investment, which in turn affects the demand for imports from trading partners, and hence output abroad (“demand channel”). Via the financial channel, changes in the interest rates of major central banks can propagate across borders via asset price spillovers to bond yields, corporate earnings expectations and financial risk premia.
Since the bulk of cross-border capital flows are denominated in US dollar, as the US dollar plays a dominant role, and as US monetary policy is a key driver of the global financial cycle, US interest rate changes have more pronounced repercussions on the rest of the world, including the euro area. [22] This is also reflected in ECB staff analysis, which indicates that a Fed tightening elicits large contractionary effects on real activity and eventually inflation in the euro area. These contractionary effects are, in fact, as large as the domestic effects in the United States.[23] Overall, given the open nature of the euro area economy, cross-border channels are crucial in evaluating how our policy stance transmits to the euro area, while also influencing global economic and financial conditions.
Risk-sharing
A distinct feature of monetary policy in a monetary union is that it might entail differences in transmission across countries or regions, reflecting differences in the financial structure or other country-specific factors. For example, as noted above, the speed at which interest rate changes are passed through to households and firms might differ across euro area countries due to differences in the share of variable-rate loans. In addition, recent analysis by ECB staff suggests that the extent of international risk sharing plays a key role in shaping the real effects of monetary policy shocks in euro area regions. In particular, a monetary policy tightening is associated with a stronger output contraction, the lower is the degree of risk sharing in a region. Moreover, regions with a higher degree of risk sharing are less prone to persistent economic effects of interest rate changes (Chart 3): while output in regions with minimum risk sharing remains around 1.5 percentage points below its initial level five years after a monetary policy tightening shock, it fully recovers over this period in regions with maximum risk sharing.
Chart 3: Impact of monetary policy on regional output when risk sharing is high or low
(x-axis: years; y-axis: percentages)

Source: Hauptmeier, Holm-Hadulla and Renault (forthcoming), “Risk sharing and monetary policy transmission”, Working Paper Series, ECB.
Notes: The chart shows the impact of a 100 basis point policy rate hike on regional output for low (blue) and high (red) levels of total risk sharing for a sample consisting of 155 regions from ten euro area countries over the period 2000-18 at an annual frequency. The x-axis refers to the horizon in years of the output response. The effect of the monetary policy shock is estimated with local linear projections.
The anchoring of inflation expectations
It is an essential task for monetary policy to ensure that medium-term inflation expectations are anchored at the two per cent target. The scale and speed of the rise in inflation since the middle of 2021 constitutes a major shock and has created an environment in which there is more intense questioning of the future inflation path. The longer and larger the deviation from the two percent target, the greater the risk that medium-term inflation expectations become de-anchored.
All else equal, the monetary policy that stabilises inflation at target in a timely manner is also the monetary policy that stabilises expectations at target. First, by ensuring that the monetary policy stance will sufficiently dampen demand to return inflation to the target in a timely manner, price setters and wage setters are on notice that demand conditions will not sustain excessive price increases and wage increases. Second, clear communication of the effectiveness of our monetary policy measures and of our determination to adjust monetary policy in response to the evolving inflation outlook also helps households, firms, experts and markets to cut through the noise in the current highly uncertain environment and thereby helps to maintain the anchor for inflation expectations.
Model-based impact of an interest rate shock
So far, I have listed a range of channels by which monetary policy transmits to the financial system, the economy and, ultimately, inflation dynamics. In order to provide an integrated macroeconomic assessment, I will now turn to a discussion of model-based quantification of the overall impact of interest rate policy.
Monetary policy transmission to the real economy typically entails considerable lags. It takes a sequence of reactions for the change in financing conditions to fully feed through to demand, and from demand to inflation. ECB model-based staff analysis suggests that, on average, the impact on inflation of a 100 basis point policy rate shock builds up gradually over time to reach its peak impact during the second year following the initial shock (Chart 4). Across models, the time interval tends to be the shorter, the more forward-looking are agents, as the adjustment in demand becomes more frontloaded.
This corresponds to the hypothetical case of an isolated and temporary change in the policy rate, and the macroeconomic impact associated with the on-going normalisation – which includes a sequence of persistent changes in interest rates that extend into expectations for the future – is likely to be larger and more persistent than suggested by these standard model responses. At the same time, drawing on these estimates certainly implies that monetary policy cannot bring inflation back to target in the short run. In this respect, our medium-term orientation acknowledges this lag and allows to also account for uncertainties in the inflation process and the transmission mechanism.
The impact of monetary policy on real output at the aggregate level conceals some differences across sectors and industries. In particular, consumer demand for housing and durable goods is traditionally more sensitive to interest rate changes and therefore tends to be more responsive to monetary policy. More broadly, differences in monetary policy transmission across sectors can be related to differences in financial structure, in particular the maturity structure of debt, the coverage ratio, financial leverage and firm size.[24]
Coming to the assessment of the macroeconomic impact of normalisation, ECB staff estimates, based on a suite of macroeconomic models regularly used for policy analysis at the ECB, indicate that the change in the short-to-medium term structure of interest rates and balance sheet expectations since December 2021 is expected to compress inflation by more than one percentage point in 2024.[25]
At the same time, the ECB’s Governing Council is fully aware that further ground needs to be covered in the next several meetings to exit from the prevailing highly accommodative level of policy rates. It should also be clear that any quantitative estimates are surrounded by significant uncertainty. One dimension of this uncertainty is captured by the range of estimates across models. In particular, the impact tends to be larger in those models that embed a more elaborated financial block that supports real-financial amplification effects and models that feature stronger expectation and confidence channels as entailed in DSGE-type models. In addition, models that can better account for the conditional correlations between identified monetary policy impulses and macroeconomic aggregates, as opposed to more reduced-form models, tend to exhibit a stronger impact of monetary policy.
Such uncertainty motivates the ECB’s staff choice to use a suite of models that spans different modelling classes, ranging from fully structural dynamic general equilibrium models to semi-structural models. This notwithstanding, in the current situation of exceptionally high inflation, uncertainty has significantly increased beyond the historically regularities captured by the available models. Finally, these estimates do not capture the benefit of preventing adverse non-linear dynamics that could materialise in the absence of policy decisions, which could risk destabilising inflation expectations down the road. Accounting for these non-linear dynamics is challenging but would likely point to a larger impact of monetary policy than captured here.
Chart 4: Response to a standard monetary policy shock: comparison across models
(deviation from baseline in percentage points)

Sources: ECB staff calculations.
Notes: This chart depicts the impulse responses of real output and inflation to a standard short-term interest rate shock (normalised to 100 basis points) for the ECB-BASE model, the ECB New Area Wide Model (NAWM) and the MMR model. Real output refers to the output gap as a percentage of GDP. Inflation is in year-on-year percentage change. All responses refer to deviation from the baseline in percentage points.
Policy effects in international comparison — the role of financial structure
Structural features imply differences in transmission of monetary policy both across countries and over time. Some euro area financial structures may currently dampen the impact of monetary policy in the euro area compared to the past (typically those features relate to interest rate fixation in private borrowing), while others (first and foremost the disruptions in energy supply) may act as amplifiers. While high inflation certainly reflects global factors related to the rise in energy costs and supply bottlenecks, each central bank faces structures which are unique to their jurisdictions and influence the transmission of monetary policy.
Chart 5: Ratio between bonds and loans for firms in the euro area versus United States
(ratio of outstanding amounts)
Sources: ECB and Federal Reserve Board.
Note: The latest observation is for the second quarter of 2022.
As a more bank-based system, the euro area might entail a more delayed reaction through the interest rate channel, as compared to countries where firms finance themselves predominantly with market-based debt (Chart 5). This is due to the slower speed of pass-through of market rate changes into lending rates on new loans compared with corporate bond yields. As already hinted previously, firms in the euro area rely predominantly on banks for their external financing compared to the United States. This implies that the same policy actions might take more time in the euro area to be transmitted to the average firm in the economy Over the last decade, larger euro area firms have increased recourse to market-based finance.[26] This may slightly accelerate the pass-through of monetary policy, even if pass-through in the US remains faster by comparison.[27] Central banks take such lags into account when setting their policy action and monitor carefully the pass-through via financial markets and the banking system.
Another factor behind current differences in transmission is that European firms are more affected than firms in other jurisdictions by disruptions in energy supply (Chart 6). In particular, higher exposures to energy imports from Russia imply higher upward pressure on prices via higher commodity prices. It may also entail higher borrower risk and thus banks applying higher lending rates to firms, compared to a no-war counterfactual. These higher lending rates would negatively affect investments and aggregate demand, thus exerting downward pressure on domestic inflation.
Chart 6: Main energy importers from Russia
(percentage of total imports in 2019)
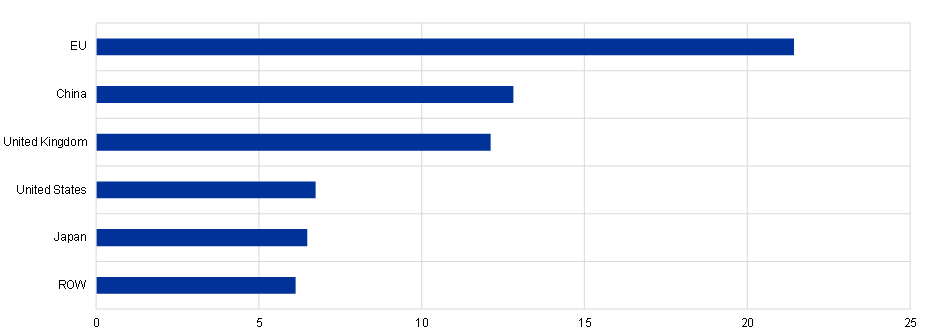
Sources: Trade Data Monitor and ECB calculations.
Notes: Products considered are crude petroleum (2709), refined petroleum (2710), petroleum gas (2711) and coal (2701). Latest observation is for 2019.
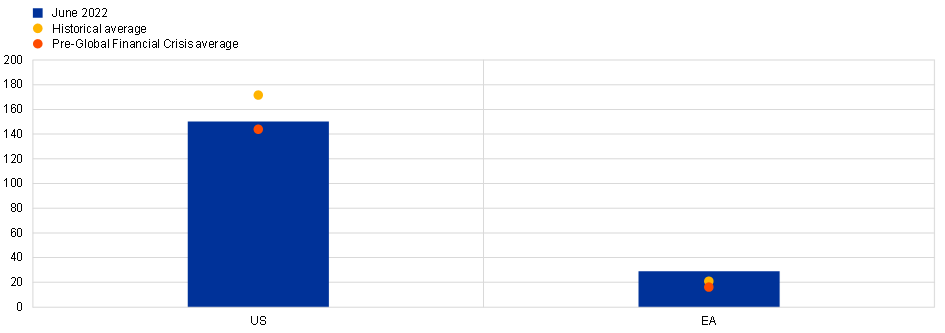
Turning to households, on the one hand, their indebtedness is generally lower in the euro area than in the United States. This implies a weaker response of consumption to monetary policy in the euro area (Chart 7). This was even more the case before the Great Financial Crisis, after which US households deleveraged to a great extent. Euro area household debt stands at overall moderate levels, somewhat above the level at the start of the pandemic in 2019, but considerably lower than for US households. The low interest rate environment in recent years has meant a considerable reduction in the interest payments made by households. Looking ahead, due to higher interest rates, gross interest payments in the euro area can be expected to rise by only a limited extent, in view of relatively contained household debt levels and the extent of fixed-rate contracts. However, compared to the US, this increase in interest payments may happen more quickly, in view of the importance of variable-rate mortgages in some parts of the euro area.
Furthermore, estimates of so called ‘wealthy-hand-to-mouth’ (i.e. households with significant illiquid wealth, limited liquid wealth and elevated debt) are consistently lower than in the US.[28] Recent research indicates that a lower share of such households also translates into a lower marginal propensity to consume by households and thus a weaker transmission mechanism.
Chart 7: Household debt: United States versus Euro area
(percentage over GDP)
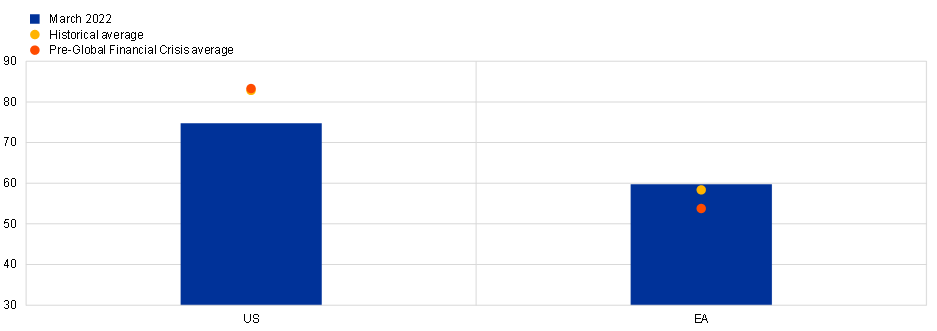
Sources: ECB, Federal Reserve Board and Bureau of Economic Analysis.
The latest observation is for the first quarter of 2022.
Another factor to consider in relation to the transmission of our monetary policy is the causal relation between economy-wide slack and inflation as captured by the structural Phillips Curve.[29] A swathe of empirical evidence indicates that the structural connection between inflation and unemployment remains present both in the euro area and the US but evolves over time. In addition, while developments in economic slack can account for a significant share of inflation, it cannot fully explain inflation developments in more recent years due to the growing importance of factors beyond the business cycle.[30] Looking to the future, this evidence overall suggests that further progress in bringing inflation towards our aim can be attained by ensuring the appropriate level of slack in the economy, provided inflation expectations remain sufficiently well-anchored.
Empirical evidence on transmission during 2022
Let me now turn to the evidence on how the adjustments in our monetary policy since last December have been transmitted.
Financial markets
The money market
Starting with the money market, the transmission of the increase in the key ECB interest rates to the unsecured money market rates has been smooth and complete for both the July and September rate hikes (Chart 8).[31] This is especially important, since the €STR is the basis for the overnight interest rate swap curve, along which the market prices expectations of future policy.
In the secured segment, the general pattern has been that of near-complete adjustment of repo rates for transactions based on a broad collateral pool, which are predominantly driven by a motivation to borrow or lend cash. By contrast, repo rates for transactions using specific collateral – which are driven by the need to source a specific security – have seen some delayed and partial adjustments, which has reflected increased demand for short-term secure investments. To prevent an abrupt outflow of deposits into the market at a time when euro area repo markets were experiencing collateral scarcity, the ECB’s Governing Council on 8 September 2022 decided to temporarily remove the 0% interest rate ceiling for remuneration of government deposits.[32] This measure has helped reduce tensions in secured money markets. Looking forward, we remain attentive to the spread between different money market rates as well as collateral scarcity concerns.
Chart 8: Money market rate (€STR) and DFR
(percentage per annum)
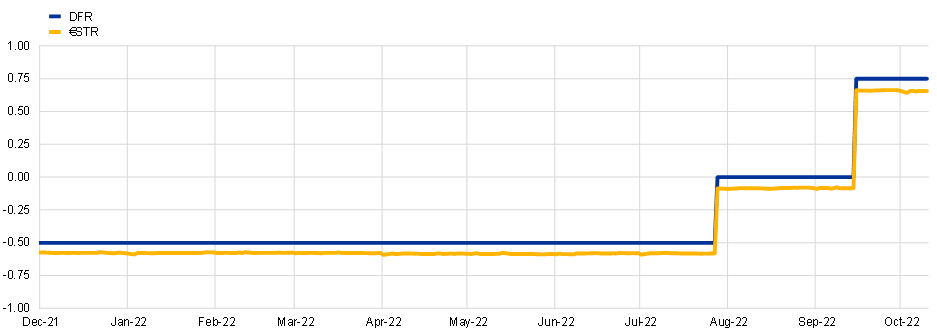
Source: ECB.
The latest observation is for 30 September 2022.
The risk-free curve
The €STR forward curve, which reflects the market pricing of the future path of short-term interest rates, has shifted up since December 2021. At the time of the December meeting, the €STR forward curve signalled no material expectations of a rate hike throughout 2022 (Chart 9), which was also reflected in the Survey of Monetary Analysts (SMA) available at the time. In line with the evolving inflation outlook and shifts in the monetary policy stance, rate expectations had already moved up sizeably by the time of our first rate hike in July, and have moved up further since.[33] As the €STR curve has shifted upwards, a noticeable gap between the number of hikes reflected in market pricing and surveys has opened up. This gap can be attributed in large part to risk premia in the market pricing.
Chart 9: €STR forward curve and survey expectations on the deposit facility rate
(percentages per annum)

Sources: Bloomberg, Refinitiv, and ECB calculations.
Notes: The dots depict the median of responses to the SMA on most likely future deposit facility rates. Surveys are adjusted for the €STR vs. DFR spread. The latest observation is for 7 October 2022 for realised €STR.
Moving beyond the front end of the curve, the transmission of our policy normalisation has also materialised in a gradual upward shift in the term structure of the risk-free curve over the broader maturity spectrum (Chart 10). While the increases at the short end have largely reflected actual and expected nearby rate decisions, the longer end has also been influenced by our decisions on asset purchases – which I will return to later – and also by changes in market expectations of the euro area economic outlook
(percentages per annum)
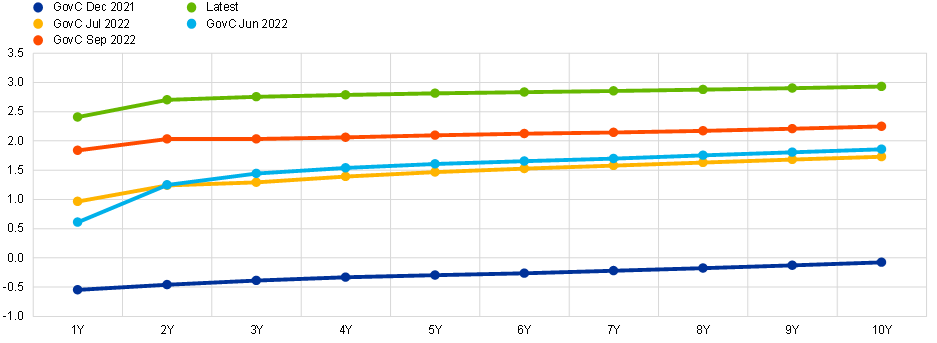
Sources: Refinitiv, ECB calculations.
Latest observation: 7 October 2022.
Real rates
Our monetary policy decisions have also contributed to substantially raising real rates over most horizons beyond the very short term. For instance, the forward real rate at the 1yr1yr horizon has gone up by about 300 bps since December 2021 (Chart 11). While this increase in the near term has primarily been driven by the real expectations component embedded in forward real rates, longer-term real forward rates increased mostly due to higher real term premia. Furthermore, the 10-year real overnight index swap (OIS) rate recently edged into positive territory – to levels not seen for over a decade.[34] These positive levels are particularly remarkable as the whole term structure of euro area real rates had been negative for many years reflecting a host of domestic and global factors.
Chart 11: Term structure of real forward rates
(percentages per annum)
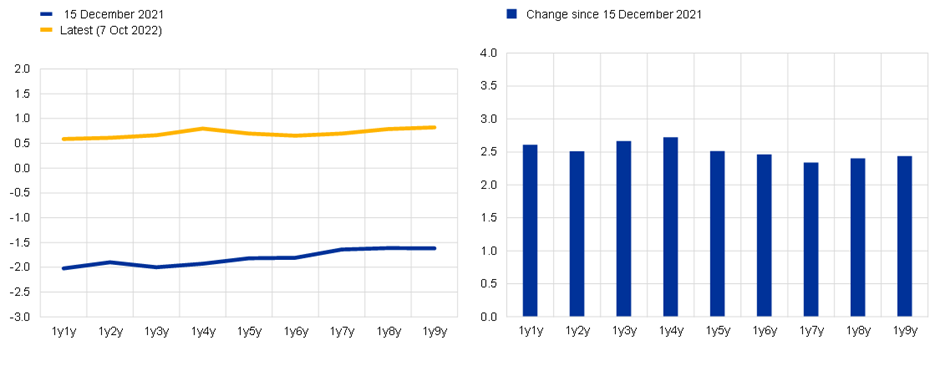
Sources: Refinitiv and ECB calculations.
Notes: Real forward rates are calculated by subtracting the inflation-linked swap forward rates from the nominal OIS forward rates for each maturity. Latest observation is for 7 October 2022.
The sovereign curve
Sovereign bonds play a pivotal role as a key reference asset to price other bonds and as an important determinant of overall financial conditions within economies. Looking at the euro area as a whole, GDP-weighted euro area sovereign bond yields have moved largely in lockstep with risk-free rates. As a result, the 10-year yield spread over the OIS rate has been fairly stable since 2021 (Chart 12).
Chart 12: 10-year sovereign yield spreads over OIS rates
(percentages per annum)
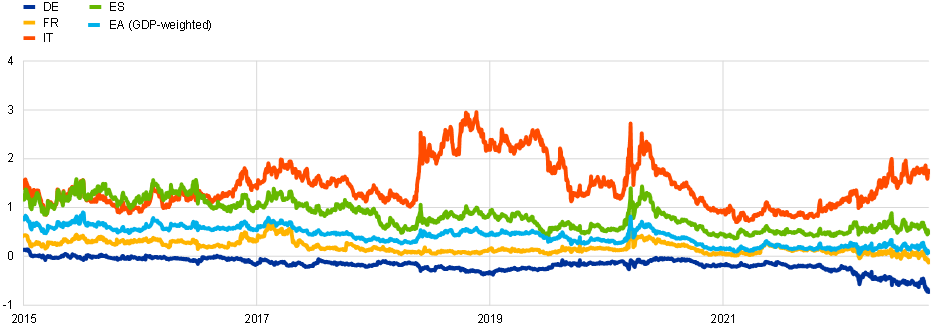
Sources: Refinitiv and ECB calculations.
Notes: The spread is the difference between individual countries’ 10-year sovereign yields and the 10-year OIS rate. Latest observation: 7 October 2022.
While the increase of sovereign yields at the short end is in line with the increased interest rate expectations, the increase of longer-term yields also reflects the discontinuation of net asset purchases, the gradual ageing of the portfolio, and some shortening of market expectations for the length of the reinvestment horizon.[35] As asset purchases compress term premia more at the long-end than at the short end, the de-compression of term premia resulting from reduced duration extraction, is estimated to be stronger at the long end also (Chart 13).
Finally, sovereign yields moving broadly in line with risk-free rates also reflect the backdrop of an ongoing flexible reinvestment of the pandemic emergency purchase programme (PEPP) and the unanimous approval of the transmission protection instrument (TPI) at the Governing Council’s July meeting.
Chart 13: Time series estimates of the combined APP and PEPP impacts on sovereign term premia
(basis points)
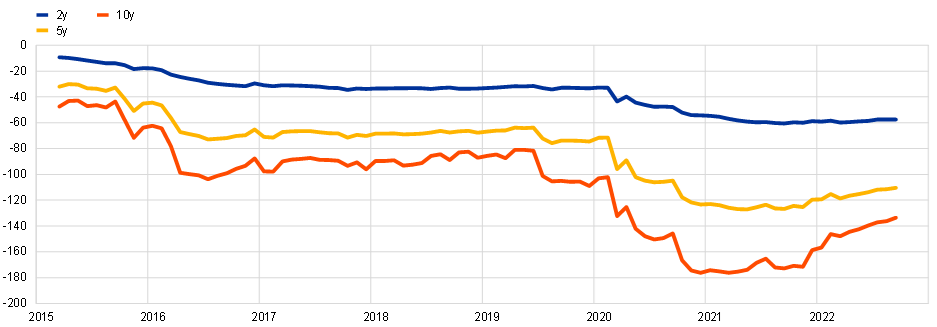
Sources: ECB calculations.
Notes: Impacts are derived on the basis of an arbitrage-free affine model of the term structure with a quantity factor (see Eser et al., 2019) and a second version of the model calibrated such that model-implied yield reactions to the March PEPP announcement match the two-day yield changes observed after 18 March 2020. The model results are derived using GDP-weighted averages of the zero-coupon yields of the big-four sovereign issuers (DE, FR, IT, ES). The latest observation is for September 2022.
Corporate bonds
The corporate bond market plays an important role in the financing of larger non-financial firms in the euro area. Similar to sovereign bonds, increases in risk-free rates have been well transmitted to the corporate bond market. Aggregate investment-grade corporate bond spreads over risk-free rates increased throughout the year from 50 to 100 basis points, with high-yield corporate bond spreads having increased from 310 to 460 basis points (Chart 14).
Chart 14: Euro area and US corporate bond spreads
(basis points)
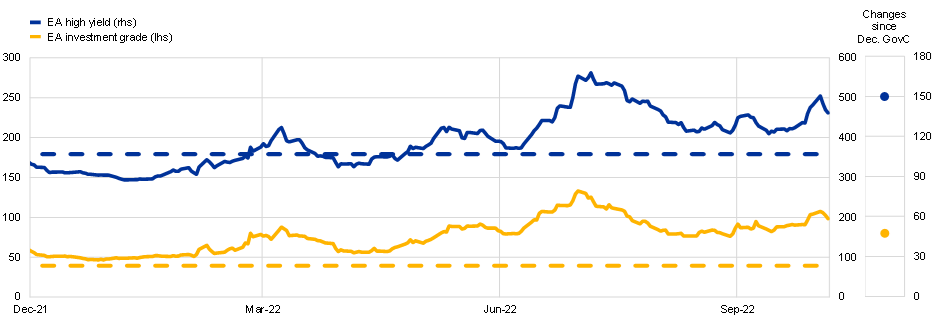
Sources: iBoxx, Refinitiv, and ECB calculations.
Notes: The spreads are based on indices including companies that issue bonds in EUR without strict restriction to their domicile and are calculated as weighted averages of bond spreads over Markit iBoxx swap curve (EA). The dashed lines show long-term averages from Jan 2015 to Nov 2021. The latest observation is for 6 October 2022.
Equity and housing markets
Equity markets in the euro area have largely moved sideways after the sharp correction experienced at the onset of Russia’s invasion of Ukraine (Chart 15). That correction was mostly driven by downward revisions in longer-term earnings expectations amid mounting recession fears. Since then, equity markets have been driven by two largely offsetting factors: while rising risk-free discount rates in the context of monetary policy normalisation have put downward pressure on equity valuations, lower equity risk premia have worked in the opposite direction. If equity risk premia were to increase in the context of a slowing economy, tighter financial conditions and elevated uncertainty, the correction in equity markets would be sharper than experienced so far.
Chart 15: Drivers of equity prices in the euro area
(cumulative change re-based to zero the Friday before the Dec GovC 2021)

Sources: Refinitiv, IBES, Consensus Economics, Bloomberg and ECB calculations.
Notes: The decomposition is based on a dividend discount model. The model includes share-buybacks, future cash-flows discounted with interest rates of appropriate maturity and includes five expected dividend growth horizons. See ECB Economic Bulletin, issue 4/2018 for more details. The latest observation is for 30 September 2022 (weekly data).
The housing market in the euro area has been buoyant over the past years, supported by favourable mortgage rates. Most recently, however, there have been initial signs of a turning point. Mortgage rates have risen significantly since the start of the year, reflecting monetary policy normalisation. Residential property price inflation was 9.3% year-on-year in the second quarter of 2022, down from 9.8% in the first quarter.
A further deceleration of house price inflation is to be expected based on historical regularities. ECB staff estimates suggest that a 1 pp increase in the mortgage rate leads, all else being equal, to a decline in house prices of around 5% after about two years (Chart 16).[36] However, relative to this historical pattern, the impact of rising mortgage rates on house prices and housing investment is found to be larger in a low interest rate environment, with an estimated decline in house prices and housing investment in response to a one percentage point mortgage rate increase of about 9% and 15% respectively after about two years.
Chart 16: Estimated semi-elasticities of house prices and housing investment to a 1 percentage point increase in the mortgage rate
(percentages)
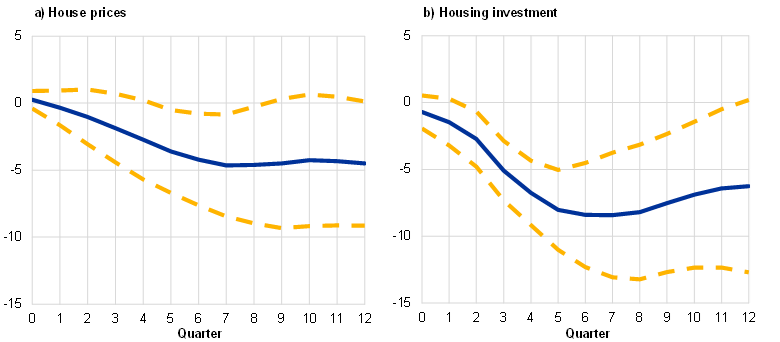
Sources: Eurostat, ECB and ECB staff calculations.
Notes: The charts show “smoothed” estimated semi-elasticities of house prices and housing investment to a 1 percentage point increase in the mortgage rate, using linear local projections. The projections include real GDP, the HICP, a short-term interest rate and housing loans as control variables and are estimated for the period running from the first quarter of 1995 to the last quarter of 2019 (i.e. excluding the period of the COVID-19 crisis). “Smoothed” refers to centred three-period moving averages of the estimated semi-elasticities, excluding the initial and final points. The dashed lines refer to the 90% confidence bands.
Credit conditions
Turning to the bank lending channel and bank funding costs (Chart 17), yields on euro area bank bonds have increased substantially, by more than 300 basis points, since December 2021. At the same time, the large amount of outstanding bank bonds at fixed rates with longer maturities dampens the impact of the yield increase on bank funding costs.
Chart 17: Average bank funding costs of euro area banks
(percentages per annum)
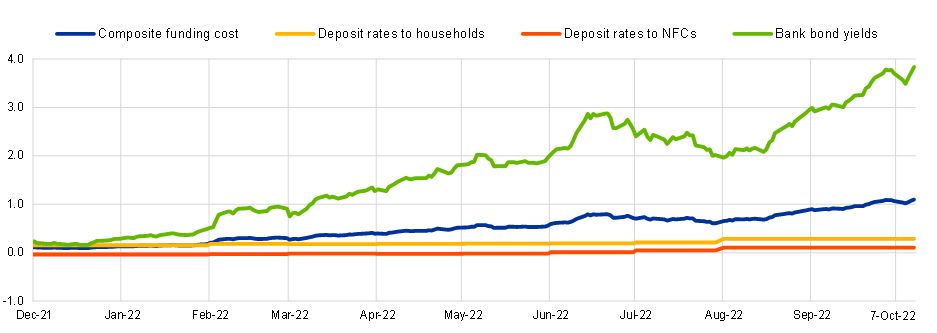
Sources: ECB (MIR, BSI), IHS Markit iBoxx and ECB calculations.
Notes: The composite funding cost is the weighted average of the cost of deposits and market debt funding, with the respective outstanding amounts on bank balance sheets used as weights. Deposit rates are on new business. The latest available data for deposit rates has been used, in order to extend the time interval of consideration up to the latest available date for bank bond yields. Latest observation: August 2022 for BSI and MIR; 7 October 2022 for iBoxx.
Compared with the rise in market rates, the adjustment in the rates on deposits – which are a stable funding source for banks, amounting to a third of their liabilities – has been more sluggish and this has contributed to containing the increase in bank funding costs so far. In some euro area countries, deposit rates were negative during recent years – providing evidence that monetary policy transmission also works in a negative rate environment – and are now coming back into positive territory.[37] In addition, the outstanding funds in the ECB’s targeted lending programme (TLTROs) are still dampening the increase in bank funding costs.[38],[39]
The recent monetary policy rate hikes, combined with the expectation of future rate increases, have been substantially passed through to lending rates applied to new borrowing (and variable-rate loans). Lending rates on new mortgages started to increase early on at the beginning of this year, leading to a substantial increase of about 100 basis points from December 2021 up to August 2022, closely tracking long-term market rate developments (Chart 18). This represents the largest increase over a corresponding eight-month period on record (since the start of the series on cost of borrowing for housing loans in 2003.) Lending rates to firms have started to increase somewhat later and less rapidly, since March this year, as these are linked more closely to short-term market rates given their shorter maturities. The increase in the cost of borrowing by 50 basis points between December 2021 and August 2022 is the largest increase over a corresponding 8-month period since mid-2011.
Chart 18: Developments in lending rates for new loans of euro area firms and households for house purchase
(percentages per annum)
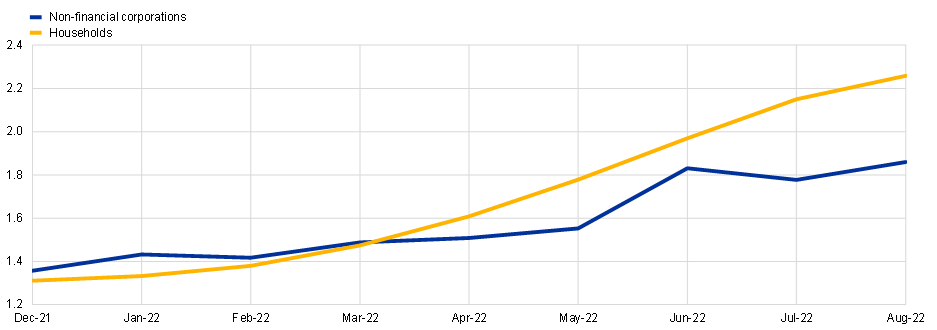
Sources: ECB (MIR).
Notes: The indicator for the total cost of borrowing for firms and for households for house purchase is calculated by aggregating short-term and long-term rates using a 24-month moving average of new business volumes. Latest observation: August 2022.
Since the fourth quarter of 2021, banks have also started to tighten their credit standards for loans to euro area firms. The current tightening follows an extended period during which credit standards were eased reflecting the monetary policy accommodation that prevailed at the time. Since the end of last year, monetary policy normalisation in the context of high inflation and the dampened economic outlook due to the rise in energy costs have significantly changed the perception and tolerance of risks when granting loans. By contrast, the moderate increase in funding costs has so far only contributed little to the tightening of lending conditions for firms, which is a positive sign for the robustness of capitalisation in the banking sector.
Despite the tightening of the financing conditions facing firms, loan demand has so far remained strong in nominal terms, with the annual growth rate of loans to firms standing at 8.7% in August. This can be explained by the need of firms to finance working capital and inventories in the current environment of high input costs and significant uncertainty, lower corporate issuance due to the increase in issuance costs as well as some frontloading of bank borrowing in anticipation of further increases in lending rates and tightening of credit conditions.
Chart 19: Credit standards on loans to euro area firms (left panel) and households for house purchase (right panel) and contributing factors
(net percentages)
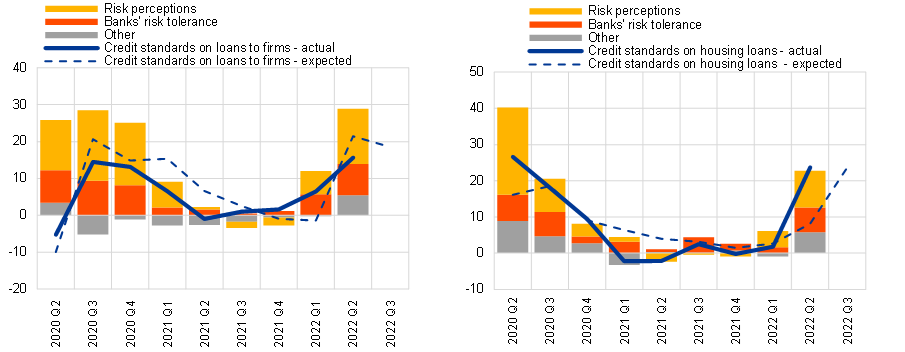
Source: ECB (BLS).
Notes: Net percentages are defined as the difference between the sum of the percentages of banks responding “tightened considerably” and “tightened somewhat” and the sum of the percentages of banks responding “eased somewhat” and “eased considerably”. “Risk perceptions” for loans to firms is the unweighted average of “general economic situation and outlook”, “industry or firm-specific situation and outlook/borrower’s creditworthiness” and “risk related to the collateral demanded”. “Risk perceptions” for loans to households for house purchase is the unweighted average of “general economic situation and outlook”, “housing market prospects, including expected house price developments” and “borrower’s creditworthiness”. “Other” refers to further factors, like “Cost of funds and balance sheet constraints” and “Competition”. Latest observation: July 2022 euro area bank lending survey (BLS).
Both credit supply and demand are indicative for future loan growth developments (Chart 20). A shift in credit standards tends to lead annual loan growth to firms by about five to six quarters, making loan growth a rather late economic indicator in the transmission of monetary policy compared with survey and market rate indicators. The net tightening of credit standards on loans to firms which we have seen since the fourth quarter of 2021 will likely translate into a dampening impact on the annual growth rate of loans in the coming quarters. While currently still strong, banks expect loan demand by firms to decrease in the coming quarters, related to weakening economic growth and diminishing frontloading effects, in line with the usual delay in loan growth developments compared to real economic activity.
Chart 20: Credit standards, loan demand and bank loan growth to euro area firms
(lhs: net percentages, rhs: quarterly growth rates in percentages)
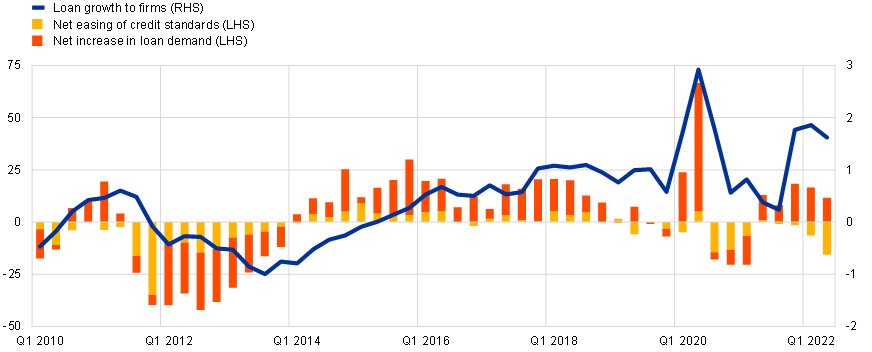
Source: ECB (BSI and BLS).
Notes: Positive bars indicate a net easing of credit standards (yellow) and a net increase in loan demand (red). The blue line shows the two-quarter moving average of loan growth to euro area non-financial corporations. Net percentages for credit standards are defined as the difference between the sum of the percentages of banks responding “tightened considerably” and “tightened somewhat” and the sum of the percentages of banks responding “eased somewhat” and “eased considerably”. Net percentages for demand for loans are defined as the difference between the sum of the percentages of banks responding “increased considerably” and “increased somewhat” and the sum of the percentages of banks responding “decreased somewhat” and “decreased considerably”. Latest observation: Q2 2022.
Compared with lending to firms, we may see the growth in loans to households for house purchases react more strongly to monetary policy normalisation and high inflation in the coming quarters, following strong mortgage loan growth during past years, especially in some euro area countries. Both credit supply and demand developments point to a weakening of housing loan growth in the coming weeks and months.
Credit standards on housing loans have tightened since the start of monetary policy normalisation and especially in the second quarter of 2022. The higher cost of living due to the sharp increases in energy bills and food prices, together with increases in construction costs, limit the capacity of households to take up a new mortgage and finance it at higher lending rates. This is reflected in the net decline in the demand for new housing loans reported by banks in the second quarter of 2022, which tends to lead a slowdown of actual loan growth in the coming quarters. While the annual growth of euro area housing loans has remained robust so far, standing at 5.2% in August, lending flows have clearly started to moderate. Households that can afford it frontload their housing loan demand to benefit from the currently still comparatively favourable financing costs. But this may not be an option for all and potential borrowers may change their plans in the current situation of high energy costs and lending rate increases.
Inflation expectations
As I explained at the beginning of my speech, one important way through which monetary policy affects inflation is by ensuring the solid anchoring of medium-term inflation expectations at target. At our latest policy meeting on 8 September, we concluded that, based on our assessment at that time, over the next several meetings we expect to raise interest rates further to dampen demand and guard against the risks of a persistent upward shift in inflation expectations.
At present, most measures of longer-term inflation expectations stand at around two per cent, although recent above-target revisions to some indicators warrant continued monitoring. For that purpose we look at a wide spectrum of market-based and survey-based expectations indicators (Chart 21). Market-based indicators suggest that inflation will return to levels compatible with our target in the course of 2024. Our Survey of Monetary Analysts likewise suggests that inflation will be close to target in 2024, while inflation will remain elevated next year. Meanwhile, the three-year-ahead inflation expectations of households have risen above target, although the term structure of expectations remains downward-sloping. While it is well-known that consumer expectations exhibit high sensitivity to near-term inflation, the above-target revisions should not be taken lightly. Overall, the evidence suggests that the euro area is not experiencing a broad-based de-anchoring of medium-term inflation expectations. As indicated above, it is an essential task for monetary policy to ensure that this remains the case.
Chart 21: Market-based measures of inflation compensations and survey-based measures (left panel), ECB Survey of Monetary Analysts (SMA): HICP inflation projections over survey rounds (middle panel), and ECB Consumer Expectations Survey (CES): inflation expectation indicators (right panel)
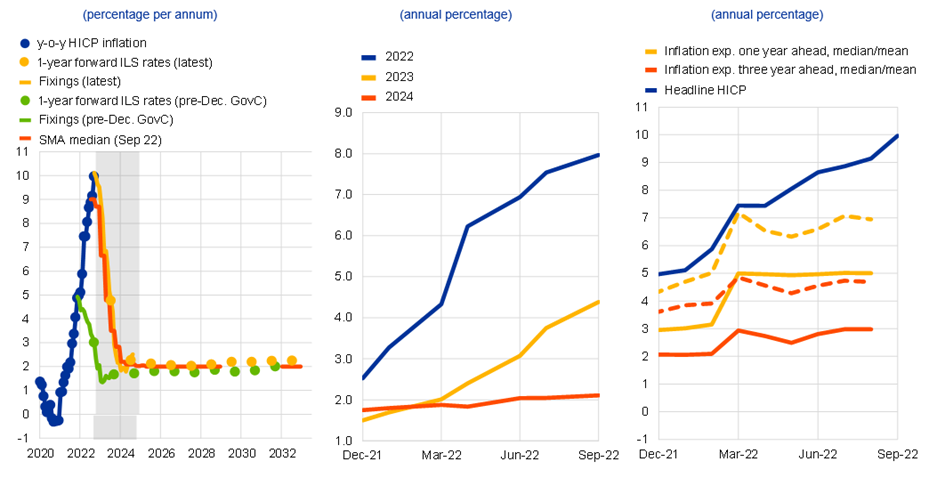
Sources: Bloomberg, Refinitiv, SMA and ECB calculations (left panel). SMA (all vintages from December 2019 until September 2022) (middle panel). ECB Consumer Expectations Survey (CES) (right panel).
Notes: The grey area refers to the projection horizon ending in December 2024 (left panel). Number of respondents in September 2022 SMA is 28 (middle panel). Dashed lines represent the mean and solid lines the median (right panel). Latest observation: 7 October 2022 (left panel). September 2022 SMA (middle panel). September 2022 (flash) for HICP. CES data from August 2022 round (right panel).
Conclusion
In delivering the monetary policy that will ensure that inflation returns in a timely manner to our two per cent target, the foremost task is to assess the various factors driving inflation dynamics: the scale and persistence of the underlying shocks (including the energy shock, the Russian invasion of Ukraine, pandemic-related bottlenecks and re-opening effects); the role of longer-term structural changes; the contribution of other macroeconomic policy forces (euro area fiscal policy, monetary and fiscal policies in the rest of the world); and the strength of self-reinforcing persistence dynamics (including pipeline pressures, second round effects, shifts in inflation expectations).
In addition, as reviewed in this speech, there is also a feedback loop between our monetary policy decisions and monetary policy transmission mechanism. In particular, in calibrating our future monetary policy decisions, it will be essential to closely monitor the impact of our monetary policy decisions on the different stages of the transmission mechanism. In one direction, if we observe that transmission is weaker or slower than expected, this would require a further tightening of the monetary policy stance. In the other direction, if we observe that transmission is stronger or faster than expected, this would require a less-tight monetary policy stance.
I am grateful for the contributions by John Hutchinson, Arthur Saint-Guilhem, Petra Köhler-Ulbrich, Giulio Nicoletti, Tilman Bletzinger, Annukka Ristimieni and Kai Christoffel.
Lagarde, C. (2022), “Monetary Policy in the Euro Area,” Karl Otto Pöhl Lecture, Frankfurt, 20 September.
For a discussion in the context of the COVID-19 pandemic, see Lane, P.R. (2021), “The compass of monetary policy: favourable financing conditions”, speech at the Comissão do Mercado de Valores Mobiliários, 25 February.
Lane, P.R. (2019), “The yield curve and monetary policy”, speech at the Centre for Finance and the Department of Economics at University College London, 25 November.
For a detailed description, see Lane, P.R., ibid.
While still limited, there is an increasing amount of literature on the impacts of balance sheet contraction, building on the experience of the Federal Reserve System’s balance sheet normalisation process in 2017-19. See Smith, A.L. and Valcarcel, V.J. (2020), “The Financial Market Effects of Unwinding the Federal Reserve’s Balance Sheet”, Research Working Papers, RWP 20-23, Federal Reserve Bank of Kansas City. See also D’Amico, S. and Seida, T. (2021), “Unexpected Supply Effects of Quantitative Easing and Tightening”, Working Papers, No 2020-17, Federal Reserve Bank of Chicago. In a recent debate sponsored by Brookings, views among the panellists differed on the issue of symmetry. On one side, it was stressed that the signalling effects – which according to some researchers was dominant in explaining the impact of balance sheet expansions in the first place – will be much diminished because, unlike the current plans by many central banks to shrink their balance sheets, the various prior phases of asset purchases had, to differing degrees, an element of surprise, with asset purchase announcements occasionally leaving a distinct imprint on the path of longer-term yields. On the other side, it was mentioned that the liquidity effect is likely to be felt much more strongly in a “quantitative tightening” than in a “quantitative easing” phase. Indeed, while money market interest rates were insensitive to additional injections of liquidity due to the effective lower bound, these are likely to respond with greater force to the contraction of liquidity that will be associated with the reduction of central banks’ assets.
Rostagno, M., Altavilla, C., Carboni, G., Lemke, W., Motto, R. and Saint Guihem, A. (2021), “Combining negative rates, forward guidance and asset purchases: identification and impacts of the ECB’s unconventional policies”, Working Paper Series, No 2564, ECB.
Evidence shows that lowering the deposit facility rate into negative territory has exerted more pronounced effects at longer maturities than standard rate cuts in positive territory, by lowering the perceived effective lower bound (ELB) and fostering further portfolio rebalancing as investors tried to avoid negative cash flows (see Rostagno, M. et al., ibid. and Altavilla et al 2022).
See Quas, A., Mason, C., Compañó, R., Gavigan, J. and Testa G. (2021), “Tackling the Scale-up Gap - Evidence and impact of the scale-up financing gap for innovative firms in Europe and reflections on potential solutions”, European Commission, JRC Science for Policy Report, and Ferrando, A., Pal, R. and Durante E. (2019), “Financing and obstacles for high growth enterprises: the European case”, European Investment Bank, Working Papers 2019/03.
There is no unique definition of the cash-flow channel in the literature, as this channel embeds a variety of mechanisms that are each the subject of a specific literature. For example, the term “cash-flow channel” itself began as reference to households and adjustable-rate mortgages (Di Maggio, M., Kermani, A., Keys, B.J., Piskorski, T., Ramcharan, R., Seru, A. and Yao, V. (2017), “Interest Rate Pass-Through: Mortgage Rates, Household Consumption, and Voluntary Deleveraging,” American Economic Review, Vol. 107, No 11, pp. 3550-88; Floden, M., Kilstrom, M., Sigurdsson, J. and Vestman, R. (2017), “Household Debt and Monetary Policy: Revealing the Cash-Flow Channel,” Swedish House of Finance Research Paper, No 16-8). Furthermore, a thorough general equilibrium approach on households’ cash-flow type of channel features heterogenous agents from the HANK literature (see footnote 10). For firms, the term “floating-rate channel” has been used to make a relatively similar point on cash flows (Ippolito, F., Ozdagli, A.K. and Perez-Orive, A. (2018), “The transmission of monetary policy through bank lending: The floating rate channel”, Journal of Monetary Economics, Vol. 95, pp. 49-71).
Ippolito, F., Ozdagli, A.K. and Perez-Orive, A., ibid. Research into past episodes of low interest rates finds that the cash-flow effect of changes in interest rates differs across income cohorts, with low-income households benefiting the most from low interest rates since 2015 (Battistini, N., Falagiarda, M., Gareis, J., Hackmann, A. and Roma, M. (2021), “The euro area housing market during the COVID-19 pandemic”, Economic Bulletin, Issue 7, ECB). For the euro area, households with low liquidity account for the majority of the consumption response to monetary policy shocks and there are significant differences across the largest euro area countries, with Germany displaying the weakest response and Spain the strongest (Slacalek, J., Tristani, O. and Violante, G.L. (2020), “Household balance sheet channels of monetary policy: A back of the envelope calculation for the euro area”, Journal of Economic Dynamics and Control, Vol. 115).
On the modelling side, Heterogeneous Agent New Keynesian (HANK) models have made progress in capturing heterogeneity and different “cash-flow” channel components, thereby going beyond the intertemporal substitution channel that is typically captured in Representative Agent New Keynesian (RANK) models. The collection of detailed granular data on euro area households from the Eurosystem’s Household Finance and Consumption Survey (HFCS) has also provided rich insights and informed the modelling. HANK models that incorporate these various channels affecting households show that the strength of these channels differs across household types (Slacalek, J. et al., ibid; Auclert, A., Rognlie, M. and Straub, L. (2020), “Micro jumps, macro humps: Monetary policy and business cycles in an estimated HANK model”, Working Papers, No 26647, National Bureau of Economic Research; Kaplan, G., Moll, B. and Violante, G.L. (2018) “Monetary policy according to HANK”, American Economic Review, Vol. 108, No 3, pp.697-743. See also discussion at the panel on “Monetary policy, employment and inequality” at the 2021 ECB Forum on Central Banking. Heterogeneities and distributional effects were also reviewed in the context of the ECB’s monetary policy strategy review (Work stream on employment (2021), “Employment and the conduct of monetary policy in the euro area”, Occasional Paper Series, No 275, ECB).
These figures reflect the current fixation period of all outstanding household credit. At the same time, there has been an increasing trend in the interest rate fixation period of newly issued loans, which is only progressively reflected into these overall stocks. For instance, the share of fixed-rate newly issued loans to households for house purchase in the euro area increased from 57% as of January 2010 to 82% as of August 2022. Over the same period, the corresponding figures for France and Germany stood at 96% (up from 87%) and 86% (up from 80%) respectively, while for Spain and Italy the figures stood at 74% (up from 10%) and 52% (up from 20%), respectively.
Under the traditional bank lending channel, or narrow credit channel, a change in monetary policy changes bank loan supply, while the broad credit channel or financial accelerator works via borrower balance sheets, where a change in short-term rates affects the net worth of borrowers, and thereby their cost of finance. Both reduced loan supply and higher cost of financing in turn influence interest-sensitive spending and investment. See Boivin, J., Kiley, M.T. and Mishkin, F.S. (2010), “How has the monetary transmission mechanism evolved over time?”, Handbook of Monetary Economics, Vol. 3, pp. 369-422; Albertazzi, U., Barbiero, F., Marques-Ibanez, D., Popov, A.A., d’Acri, C.R. and Vlassopoulos, T. (2020), “Monetary policy and bank stability: the analytical toolbox reviewed”, Working Paper Series, No 2377, ECB; and Bernanke, B.S. and Gertler, M. (1995), “Inside the black box: the credit channel of monetary policy transmission”, Journal of Economic Perspectives, Vol. 9, No 4, pp. 27-48.
The main liabilities of banks consist of central bank funding, debt securities issued, interbank borrowing, deposits from households and non-financial corporations, other deposits (from other financial intermediaries, money market funds, investment funds, insurance corporations and pension funds) and capital and reserves.
See Rostagno M., Altavilla C., Carboni G., Lemke W, Motto R., Saint Guilhem A., and Yiangou J. (2021) “Monetary Policy in Times of Crisis: A Tale of Two Decades of the European Central Bank”, Oxford University Press.
See Rajan (2006), which studies changes in the portfolio composition of banks from less-risky to more-risky assets, known as the “search for yield”. Adrian and Shin (2010) document how banks actively manage their leverage ratios in response to changes in asset values, expanding their operations through collateralised borrowing during periods of accommodative monetary policy and reducing them when monetary policy is tight. See also Borio and Zhu (2008), Boivin, Lane and Meh (2010).
For a detailed discussion see Lane, P.R. (2019), “The international transmission of monetary policy”, Speech at CEPR International Macroeconomics and Finance Programme Meeting.
Specifically, according to UIP, the level of the exchange rate reflects the path of future policy rate differentials vis-à-vis foreign currencies.
This analysis draws from a BVAR model that decomposes asset price movements into underlying drivers based on cross-asset price restrictions. For more details see Brandt, L., Schroder, M., Saint Guilhem, A., and Van Robays, I. (2021), “What drives euro area financial market developments? The role of US spillovers and global risk”, Working Paper Series, No 2560, ECB, May.
One mechanism behind this could be that the exchange rate is determined more by market participants active at the short end of the yield curve, such as traders involved in carry trade strategies, than by market participants active at the long end of the yield curve, such as global bond asset managers. In line with this, ECB staff model-based analysis finds that the euro-US dollar exchange rate is much more reactive to “rate expectations” policy shocks, such as rate cuts, than to “term premia” policy shocks, such as those due to the APP. At the same time, while this evidence suggests that, for a given shock size, rate cuts have a larger exchange rate effect than changes in term premia, the sheer scale of the APP means that the sharp decline in term premia is found to be an important driver of the euro exchange rate during unconventional times. For a discussion of the theoretical underpinnings and a review of the empirical evidence on the exchange rate channel of unconventional policies, see Lane, P.R. (2019).
See Rey, H. (2013), “Dilemma, not Trilemma: The global financial cycle and monetary policy independence”, Jackson Hole Economic Policy Proceedings, Federal Reserve Bank of Kansas City, pp. 1‑2.
While possibly surprising, it is the most common finding in the empirical literature that US monetary policy spillovers to the overall rest of the world and the average non-US country in the rest of the world are as large and oftentimes larger than the domestic effect in the US. See, for example, Dées, S. and Galesi, A. (2021), "The Global Financial Cycle and US monetary policy in an interconnected world," Journal of International Money and Finance, Vol. 115(C). However, the estimations presented here are state-of-the-art regarding shock identification and local projections; and specifically for the US-euro area pair, the same is found, for example, in Ca' Zorzi, M., Dedola, L., Georgiadis, G., Jarocinski, M., Stracca, L. andStrasser, G. (forthcoming), "Making waves: Monetary policy and its asymmetric spillovers in a globalised world," International Journal of Central Banking; and Degasperi, R., Hong, S. and Ricco, G. (2020), "The Global Transmission of US Monetary Policy," Warwick Economics Research Paper Series, No 1257.
See Barsky, R., Boehm, C.E., House, C. L. and Kimball, M. (2016), “Monetary Policy and Durable Goods”, Federal Reserve Bank of Chicago, Working Paper, No. 2016-18, 2016. For the euro area, see Peersman, G., and Smets, F. (2005), “The industry effects of monetary policy in the euro area”, The Economic Journal, 115 (April), 319–342.
The estimated impact refers to the average across a set of models used by the ECB for policy simulations, including the NAWM-II model (Coenen, G., Karadi, P., Schmidt, S., and Warne, A. (2018), “The New Area-Wide Model II: an extended version of the ECB’s micro-founded model for forecasting and policy analysis with a financial sector“, Working Paper Series, No 2200, ECB), the ECB-BASE model (Angelini, E., Bokan, N., Kai, C., Ciccarelli, M., and Zimic, S. (2019), “Introducing ECB-BASE: The blueprint of the new ECB semi-structural model for the euro area”, Working Paper Series, No 2315, ECB), the MMR model (Mazelis, F., Motto, R. and Ristiniemi, A. (2022), “Monetary policy strategies in a low interest rate environment for the euro area”, forthcoming), as well as the standard projection-based tools.
In some countries, households have also become more exposed to market-based finance with the rise of non-bank mortgage providers that are funded by markets rather than by deposits.
See also Cappiello et al. (2021) Non-bank financial intermediation in the euro area: implications for monetary policy transmission and key vulnerabilities, ECB Occasional Paper no 270
See Slacalek, J., O. Tristani, and G. L. Violante (2020). “Household Balance Sheet Channels of Monetary Policy: A Back of the Envelope Calculation for the Euro Area”. Journal of Economic Dynamics and Control, vol. 115, issue C.
See Eser, F., Karadi, P., Lane, P. R., Moretti, L. and Osbat, C. (2020), “The Phillips Curve at the ECB”, The Manchester School 88(51), 50-85.
See Koester, G., Lis, E., Nickel. C., Osbat, C. and Smets, F. (2021), “Understanding low inflation in the euro area from 2013 to 2019: cyclical and structural drivers” Occasional Paper Series, No 280, ECB. See also Clarida, R. H. (2022). “The Federal Reserve’s New Framework: Context and Consequences,” Finance and Economics Discussion Series 2022-001. Washington: Board of Governors of the Federal Reserve System.
See also Lane, P.R. (2022) “Monetary policy and the money market”, Opening remarks at the Meeting of the Money Market Contact Group on 14 September.
See the ECB press release.
A focal point in inspecting the €STR forward curve is the market’s perception of the destination of the policy rate cycle – the terminal rate. On the role of the terminal rate in monetary policy setting, see my remarks at the high-level panel: Lane, P.R. (2022) “High Inflation and Other Challenges for Monetary Policy”, Remarks for high-level panel at the Annual Meeting of the Central Bank Research Association (CEBRA), Barcelona on 29 August.
Real rates have gone through similar dynamics in the US, yet at a somewhat higher level. These developments might reflect a higher structural level of (real) interest rates in the US compared to the euro area – as evidenced by the average values over the past decade but also corroborated by estimates of the natural rate in the long run (r*). Differences in expectations of the policy normalisation path given prevailing assessment of the economic outlook and underlying drivers of inflation dynamics may matter as well.
According to the latest SMA, reinvestments under PEPP and APP are expected to continue until December 2024.
See N. Battistini, J. Gareis and M. Roma, “The impact of rising mortgage rates on the euro area housing market”, ECB Economic Bulletin, Issue 6/2022.
See Altavilla, C., Burlon, L., Giannetti M. and Holton S. (2022), “Is there a zero lower bound? The effects of negative policy rates on banks and firms”, Journal of Financial Economics, Vol. 144, Issue 3, June, pp. 885-907.
See Rostagno, M., Altavilla, C., Carboni, G., Lemke, W., Motto, R., Saint Guilhem, A. and Yiangou, J. (2021), Monetary Policy in Times of Crisis: A Tale of Two Decades of the European Central Bank, Oxford University Press.
See Barbiero, F., Boucinha, M. and Burlon, L. (2021) “TLTRO III and bank lending conditions”, Economic Bulletin, Issue 6, ECB and Altavilla, C., Barbiero, F., Boucinha, M. and Burlon, L. (2020), "The great lockdown: pandemic response policies and bank lending conditions", Working Paper Series, No 2465, ECB, September.
Banca centrale europea
Direzione Generale Comunicazione
- Sonnemannstrasse 20
- 60314 Frankfurt am Main, Germany
- +49 69 1344 7455
- media@ecb.europa.eu
La riproduzione è consentita purché venga citata la fonte.
Contatti per i media