
- SPEECH
- 24 June 2020
The ECB’s monetary policy response to the pandemic: liquidity, stabilisation and supporting the recovery
Speech by Philip R. Lane, Member of the Executive Board of the ECB, at the Financial Center Breakfast Webinar organised by Frankfurt Main Finance
Today, I will discuss the impact of the monetary policy measures taken by the ECB in response to the pandemic emergency on euro area financial conditions and the outlook for growth and inflation.[1] As I will explain, our measures have been an effective and efficient reaction to the COVID-19 crisis by boosting liquidity, stabilising financial markets and supporting the recovery.
Let me briefly recall the unprecedented challenges that warranted a decisive monetary policy response. The European and world economies are experiencing an extraordinary and severe contraction. The measures taken to contain the spread of the coronavirus since early March have interrupted many economic activities worldwide. Large-scale job and income losses, along with an exceptional degree of uncertainty about the economic outlook, have led to a significant drop in consumer spending and business investment.
As the containment measures are lifted, we see some signs of an initial recovery. However, this process is expected to be quite gradual, since it will take time for consumers and businesses to recover from this shock. Income losses and precautionary savings continue to weigh on consumption. Likewise, weak demand, continued supply constraints and ongoing social-distancing restrictions are hampering the normalisation of economic activity.[2]
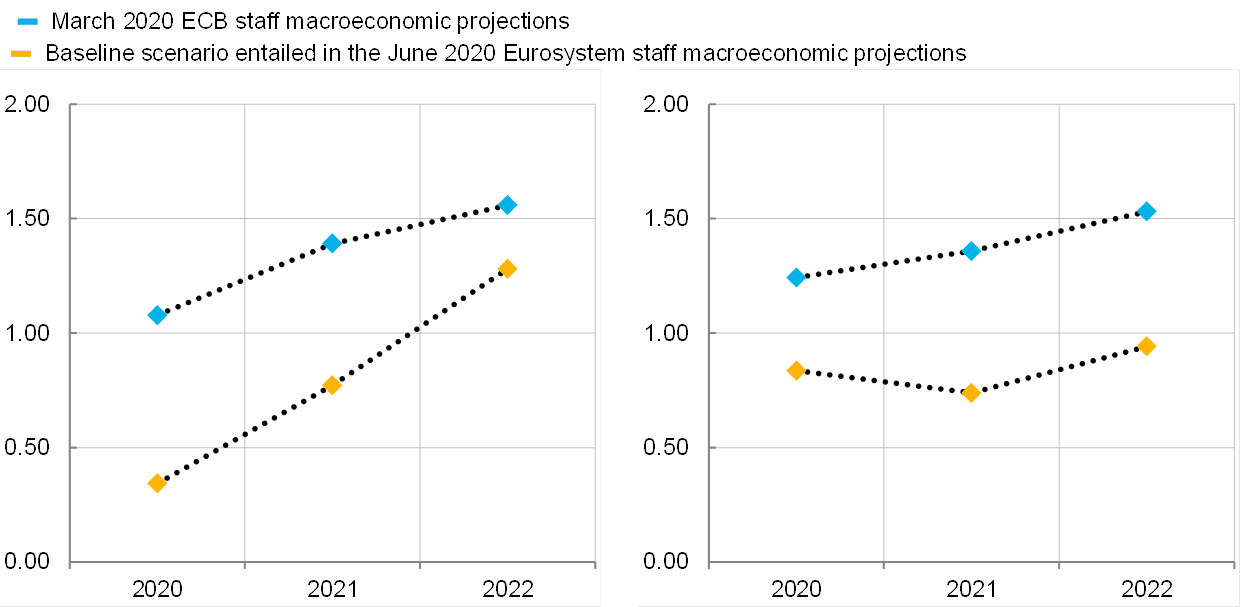
These developments are clear from the incoming data and shaped the Euroystem staff macroeconomic projections published in early June. Euro area output contracted by a record 3.6 percent in the first quarter of the year and is projected to decline by a further 13 percent in the second quarter. While growth will partially rebound in the second half of this year, output is projected to return to the level prevailing at the end of 2019 only at the end of 2022 (Chart 1).
The net impact of the COVID-19 shock on the medium-term inflation outlook is expected to be disinflationary to a substantial degree, since the forces associated with greater economic slack are likely to outweigh any inflationary pressures stemming from damage to supply capacity.[3] The sharp drop in economic activity (together with the fall in oil prices) has already left its mark on euro area inflation, which has decreased significantly over the past months, standing at only 0.1 percent in May. It is projected to average 0.3 percent in 2020 before only slowly increasing to 1.3 percent in 2022, well below levels that are consistent with our inflation aim. The revisions to the projected outlook for core inflation foresee an even greater deterioration: core inflation is forecast to reach only 0.9 percent in 2022 (Chart 2).
The economic ramifications of the pandemic have been amplified by the tightening in financial conditions compared with levels that prevailed at the turn of the year.[4]
Against this backdrop, the case for monetary policy action was clear.
Projected real GDP in the June and March 2020 Eurosystem/ECB staff macroeconomic projection exercises
(index, 2019=100)

Source: ECB calculations.
Projected euro area headline inflation and headline inflation excluding food and energy in the June and March 2020 Eurosystem/ECB staff macroeconomic projection exercises
(year-on-year percentage changes)
Source: ECB calculations.
The impact of our monetary policy measures on financial conditions
Faced with this unprecedented macroeconomic shock, there are three key roles for monetary policy: first, it must ensure that the overall stance is sufficiently accommodative; second, it should support market stabilisation to safeguard the transmission mechanism; and third, it needs to provide ample central bank liquidity, especially to maintain credit provision. I will structure my remarks around these three elements.
With regard to the monetary policy stance, the risk-free yield curve is a key determinant because it is the cornerstone of financial conditions for all sectors of the economy across the euro area. Our negative policy rates (together with the state-contingent forward guidance on the expected path of future policy rates) have been helping to keep short- to medium-term risk-free rates at highly accommodative levels.
Thanks to the recalibration of our monetary policy measures announced in September 2019 – namely the cut in our deposit facility rate, enhanced forward guidance, the resumption of net asset purchases under the asset purchase programme (APP) and the easing of TLTRO III pricing – sizeable monetary accommodation was already in place when Europe was confronted with the COVID-19 shock. Entering the crisis with an accommodative monetary policy stance helped strengthen the fundamentals of the economy, reinforcing its resilience when the crisis hit.
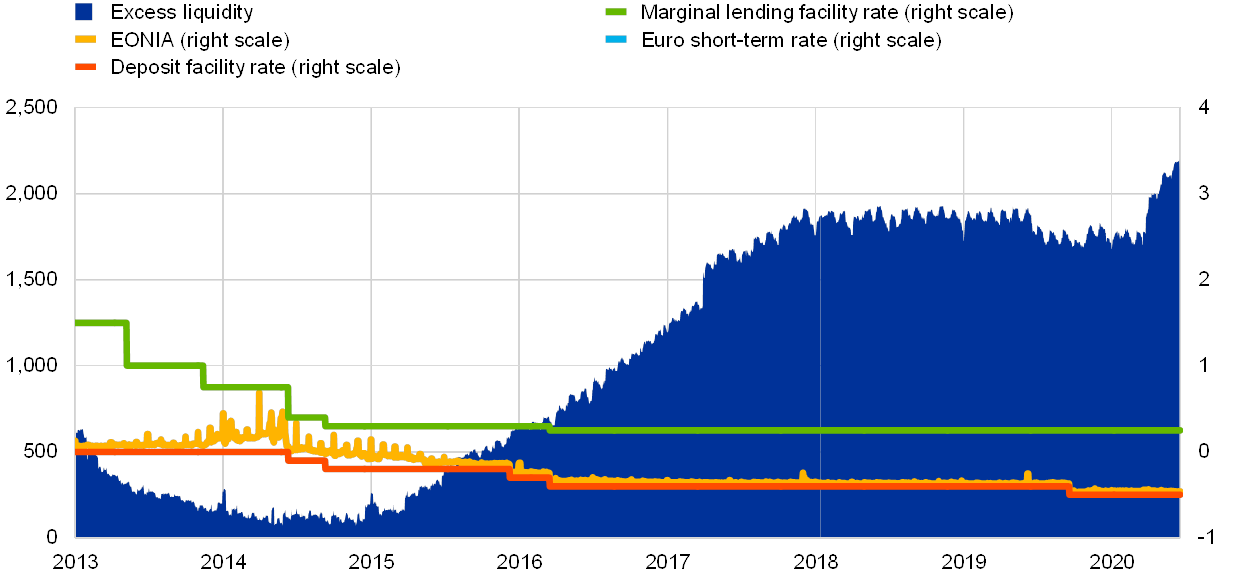
As shown in Chart 3, the ECB’s key policy rates were at their current record low levels and there was ample excess liquidity owing to the large stock of outstanding targeted longer-term refinancing operations (TLTROs) and asset purchases.[5] As a result, euro money markets have been relatively resilient and the floor of the interest rate corridor has remained the anchor for the euro overnight index average (EONIA) rate. The current resilience of money markets stands in sharp contrast to the stressed conditions observed during the global financial crisis.
EONIA, key ECB interest rates and excess liquidity
(left scale: EUR billion; right scale: percentages per annum)
Source: ECB.
Notes: Daily data. Excess liquidity is computed as the sum of credit institutions’ central bank liquidity holdings with the Eurosystem in their current accounts and deposit facility minus their reserve requirements. The latest observations are for 18 June 2019.
Money market functioning is paramount for monetary policy, because the EONIA rate is the starting point for the transmission mechanism. The EONIA rate anchors the overnight index swap (OIS) curve, which is the best proxy for a risk-free yield curve in the euro area. The risk-free yield curve was already at very low levels in January before the spread of COVID-19 to Europe and has declined further since the onset of the pandemic.
This stabilising adjustment pattern in the behaviour of the money market reflects the internalisation by market participants of the feedback to the policy rate path from the inflation outlook, which has been prominently embedded in the enhanced formulation of our forward guidance since September 2019. Our forward guidance firmly links the future path of policy rates to changing economic conditions that alter the trajectory of inflation towards our aim. Revisions to the inflation outlook directly affect market expectations of future policy rates, and thereby trigger corresponding adjustments in financial conditions.
Anchoring the risk-free yield curve at exceptionally low levels is a necessary but not sufficient condition for ensuring that the overall stance of monetary policy is appropriate: it is essential that changes in the risk-free curve are also transmitted to the benchmark rates that matter for the pricing of financial instruments and bank credit. In the euro area, sovereign yields in each member country play a pivotal role in the transmission of monetary policy to the real economy. In particular, sovereign yields matter not only for the funding costs facing governments but also feed into the market funding costs of banks – on which households and small firms rely for credit intermediation – as well as for the market funding costs of corporates (Chart 4).
Bank, corporate and sovereign bond yields
(daily; percentages per annum; x-axis: sovereign yields; y-axis: bank (left panel) and corporate (right panel) bond yields)

Sources: Markit iboxx, ECB and ECB calculations.
Notes: The chart reports the correlation between (the level of) bank bond yields and sovereign yields in the left panel, and between corporate bond yields and sovereign yields in the right panel. Each dot corresponds to a daily recording of the average yield for bonds issued by banks with a given maturity (left panel) and senior unsecured bonds (investment grade) with a given maturity issued by non-financial corporates (right panel) in a given country and the sovereign yields with the same maturity for the same day in the same country. The latest observations are for 18 June 2020.
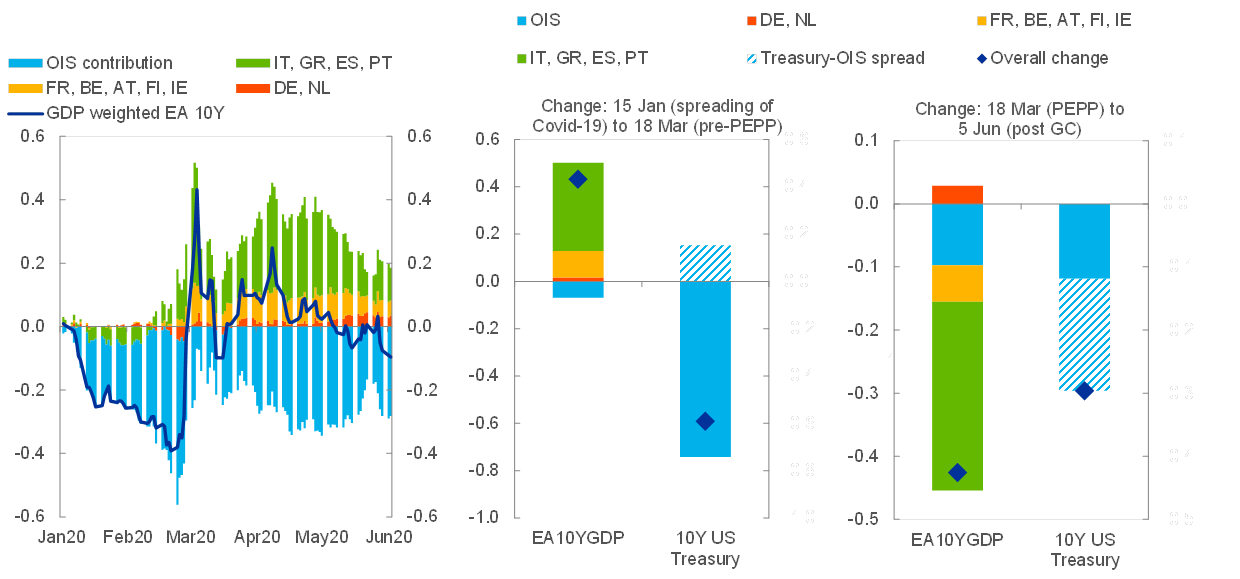
However, since the start of the pandemic, we have no longer been able to count on a smooth transition of the changes in risk-free rates to other parts of the financial system and the real economy. The stressed financial system conditions have impaired the transmission from OIS rates to the euro area GDP-weighted sovereign yield curve (Chart 5). In particular, an environment of elevated uncertainty and higher risk aversion hampers traditional portfolio rebalancing flows and tighter balance sheet constraints can further discourage normal intermediation.
The impairment in the transmission from risk-free rates to sovereign yields is compounded in a heterogeneous monetary union such as the euro area, where market stress gives rise to the risk of fragmentation across countries and market segments. On the whole, only arbitrage between the OIS and the Bund has remained intact, while it has not worked smoothly between the OIS and other sovereign yields. This disconnect is largely a euro area phenomenon, reflecting high cross-border substitutability in the absence of currency risks. By way of contrast, this has not happened in the United States, which helps explain the milder correction in financial conditions on the other side of the Atlantic.
Drivers of euro area and US sovereign yields
(percentage points)
Source: ECB calculations.
The pandemic emergency purchase programme (PEPP) that we announced in March 2020 has been instrumental in unlocking the transmission mechanism to ease financial conditions for all sectors in the economy. The announcement of the programme was followed by a more pronounced decline in the GDP-weighted sovereign yield than the concomitant decrease in the OIS rates, which indicates that the PEPP has been successful in diminishing the intermediation frictions that arose in the early stages of the crisis (Chart 5). Notably, the recently-announced expansion in the PEPP has been associated with a further improvement in the transmission mechanism. These developments show that the PEPP has been very effective against the widening of risk premia, consistent with evidence that monetary policy measures designed to release balance sheet constraints for firms and financial intermediaries tend to be particularly effective in conditions of elevated market stress.
The extraction of duration risk from the financial system is a key channel through which the PEPP supports market stabilisation. By putting downward pressure on the medium and long segments of the curve, it complements and reinforces negative interest rates and forward guidance on rates. The total PEPP envelope of €1,350 billion, in conjunction with the additional €120 billion APP purchase envelope for 2020, is expected to further reduce the amount of duration risk that is borne by investors, contributing to a compression of term premia.[6]
As of the end of 2019, the net asset purchases and reinvestment policy had already led to the withdrawal of substantial duration risk from the market, in the order of 19 percent of the duration-equivalent stock of outstanding public debt in the four largest euro area economies. This is foreseen to increase to 27 percent by the end of the second quarter of 2021, taking into account the June policy decisions and the expected supply of bonds entailed in the Eurosystem staff macroeconomic projections (Chart 6).
Outstanding quantity of duration: holdings of Eurosystem (PSPP and PEPP) and other investors
(left panel: EUR billions ten-year equivalents; right panel: percentages)

Sources: Securities holdings statistics, government finance statistics, ECB and ECB calculations.
Notes: The chart shows the stock of debt securities issued by each general government of the four largest euro area jurisdictions, and the amounts of that stock held by the Eurosystem (under the PSPP and PEPP) and other investors in terms of ten-year equivalents. “Other investors” comprise all other financial and non-financial investors. Solid columns (lines) denote historical data and patterned columns (dotted lines) denote forecasts. The latest observations are for 2020Q1 (historical data) and 2021Q2 (projected data).
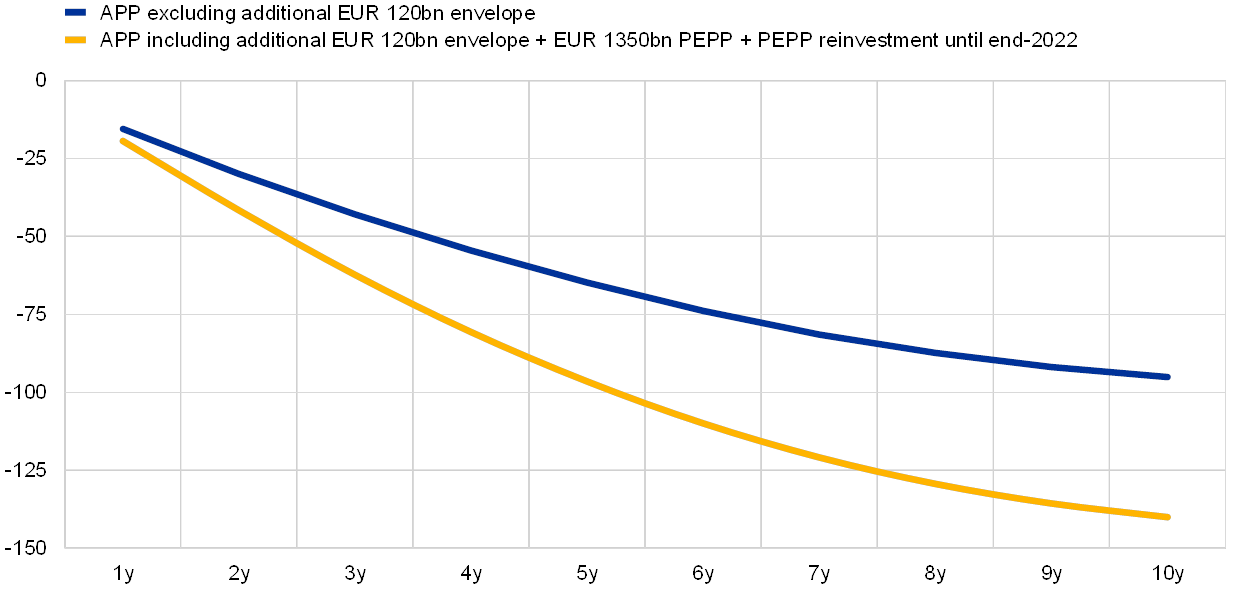
The PEPP and the scaling-up of the asset purchase programme are estimated to reduce the ten-year sovereign term premium by almost 45 basis points (Chart 7). This adds to the nearly 100 basis point compression in the term premium that is attributable to the sizeable stock of assets purchased under the APP in recent years and the September 2019 recalibration of the APP.
These are likely to be conservative estimates of the impact of the March and June 2020 asset purchase decisions on euro area sovereign yields, since these estimates are based on elasticities of yields to asset purchases estimated from the public sector purchase programme (PSPP). In fact, event study evidence from the March and June PEPP announcements suggest that the PEPP elasticities may be larger than the standard PSPP elasticity, thereby pointing to some upside potential to the yield impact assessment. The higher elasticity may also be related to the design of the PEPP, which makes it particularly effective in stressed market conditions owing to its flexibility in allocating purchases to the market segments where interventions are needed the most, thereby maximising the impact of the programme on overall financial conditions. In this way, the evidence is consistent with the intended role of the PEPP in unlocking the transmission mechanism in the current environment of elevated uncertainty.
Estimated impact of additional asset purchases on the sovereign term premium
(basis points)
Sources: Securities holdings statistics, government finance statistics, ECB and ECB calculations.
Notes: Impacts are based on the model of Eser, F., Lemke, W., Nyholm, K., Radde, S. and Vladu, A. (2019), “Tracing the impact of the ECB’s asset purchase programme on the yield curve”, Working Paper Series, No 2293, European Central Bank. The model uses PEPP-implied projected duration extraction to estimate the impact on GDP-weighted sovereign yields of Germany, France, Italy and Spain.
In relation to liquidity and protecting the flow of credit to the real economy, the recalibration of the third series of TLTROs has made a significant contribution. The TLTRO programme complements our asset purchases and negative interest rate policy by ensuring the smooth transmission of the monetary policy stance through banks.[7] This is particularly relevant in the euro area, where banks play a dominant role in financial intermediation.
For many companies, the lockdown measures and behavioural shifts associated with the pandemic have substantially curtailed revenues, while rents and other bills continue to fall due. To prevent a wave of firms going out of business as a result of liquidity constraints, it is essential that sufficient credit reaches the real economy. The easing of our TLTRO III conditions provides significant additional funding cost relief to banks, and the in-built incentive scheme makes it attractive for them to extend credit to firms and households. The TLTROs are an especially powerful form of support to small and medium-sized enterprises (SMEs), because these firms (which account for around two-thirds of euro area employment) lack the scale to have direct access to capital markets.
Evidence from the April bank lending survey indicates that our monetary policy measures are contributing to the protection of bank credit flows. Banks have indicated that TLTRO III is having a net easing impact on the terms and conditions offered to borrowers and a positive net impact on their lending volumes, particularly their expected lending volumes over the next six months (Chart 8).[8]
Impact of TLTRO III on bank lending volumes to enterprises
(net percentage of banks, over the past and next six months)
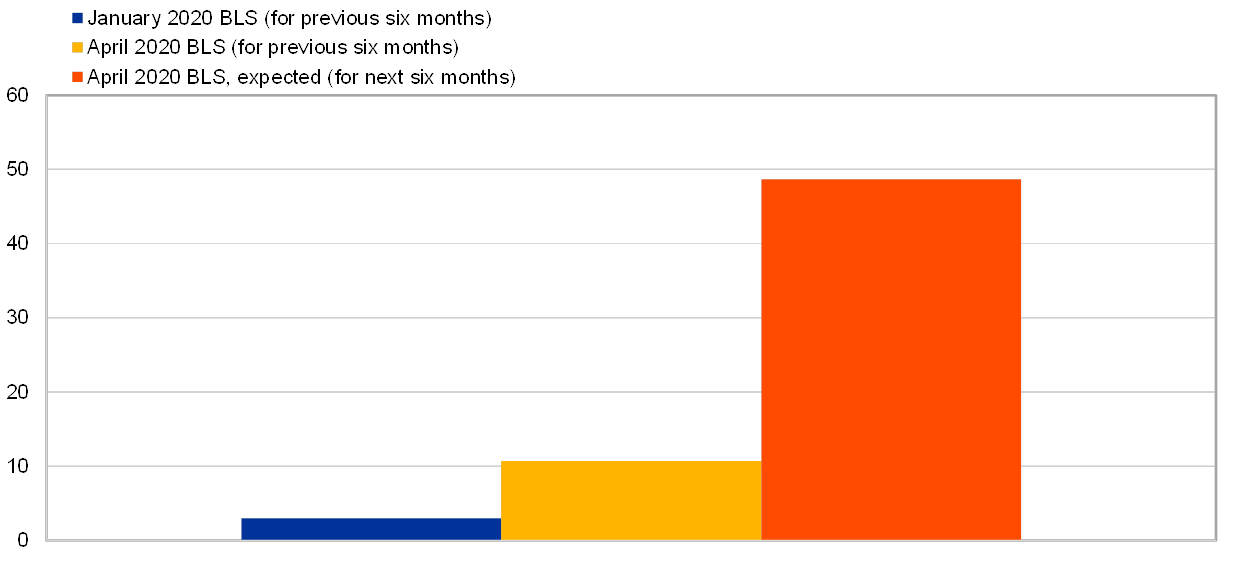
Source: ECB bank lending survey (BLS).
Notes: Net percentages are defined as the difference between the sum of the percentages for “contributed considerably to an increase” and “contributed somewhat to an increase” and the sum of the percentages for “contributed somewhat to a decrease” and “contributed considerably to a decrease”.
In the fourth operation in our third series of TLTROs settling today, €1,308 billion has been allotted. The net liquidity injection associated with the operation is nearly €550 billion.[9] The high take-up has been facilitated by the collateral-easing measures that we introduced in April to ensure that banks can make full use of TLTRO III funding. We have seen that counterparties have pledged additional assets – including credit claims – as collateral. This indicates that banks are taking advantage of the changes to the collateral framework, and underscores the potential for these changes to support the flow of credit to the real economy.
As a complement to TLTROs, we also introduced additional liquidity-providing longer-term refinancing operations. The temporary LTROs announced in mid-March provided banks with funding at the deposit facility rate in order to bridge liquidity needs until the settlement of this month’s TLTRO. These operations provided an effective liquidity backstop, helping to safeguard the smooth functioning of money markets. The pandemic emergency longer-term refinancing operations (PELTROs) that we launched in April will also act as a liquidity backstop now that the bridge LTROs have come to an end. They also provide an additional source of longer-term funding for banks, which is especially valuable for those banks with business models that focus on lending to sectors not covered by the TLTRO programme.
Overall, although euro area financial conditions remain tighter than the levels that prevailed before the pandemic, we have seen a measurable loosening in broad financial conditions since the adoption of our policy package introduced in response to the COVID-19 crisis (Chart 9). The package has helped to ease the monetary policy stance, support market stabilisation, and safeguard liquidity conditions and the flow of credit to the real economy.
Changes in financial conditions in the euro area
The macroeconomic impact of our monetary policy measures
By easing the financial conditions faced by firms and households, our monetary policy package provides crucial support to the real economy. In broad terms, this support works along two dimensions: by (i) underpinning medium-term growth and inflation developments and (ii) reducing tail risks around our baseline scenario.
With regard to the first dimension, more favourable financial conditions help to mitigate the negative impact of the COVID-19 shock on consumer expenditure and business investment. Monetary policy typically operates with transmission lags. However, especially during a crisis, we should not discount the positive effect of our swift and decisive action on consumer and business confidence, which can accelerate and reinforce the monetary policy transmission to growth and inflation.
Taking a medium-term perspective, ECB staff estimate that – taken together – the policy measures announced between March and June 2020 will exert a sizeable effect on the path of growth and inflation over the forecast horizon (Chart 10). The policy decisions taken since March 2020 on asset purchases and the TLTROs are estimated to add around 1.3 percentage points to the level of euro area output over the projection horizon, while the contribution to the annual inflation rate is estimated to be around 0.8 percentage points cumulatively over the projection horizon.
Estimated impact of the ECB’s decisions since March 2020 on the central tendency of inflation and economic activity
(percentage points)
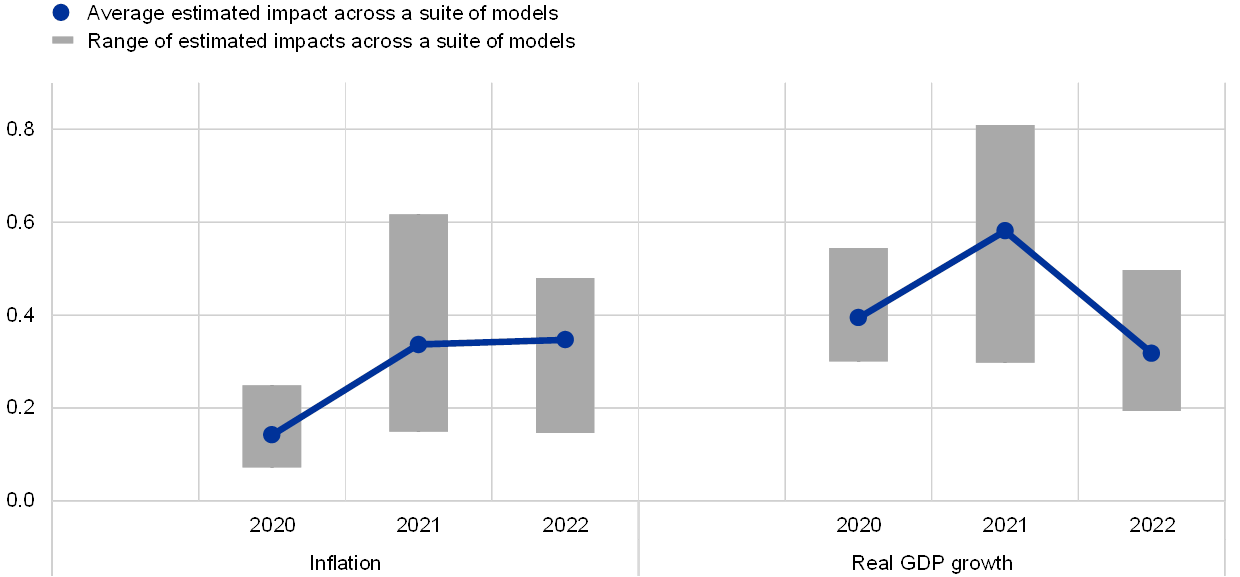
Source: ECB calculations.
Notes: The estimated impact via a suite of models refers to the average across a set of models used by the Eurosystem for policy simulations, a BVAR model (Rostagno, M., Altavilla, C., Carboni, G., Lemke, W., Motto, R., Saint Guilhem, A. and Yiangou, J. (2019), “A tale of two decades: the ECB’s monetary policy at 20”, Working Paper Series, No 2346, European Central Bank), the NAWM-II model, and the ECB-BASE model.
These estimates of the macroeconomic impact of our measures are probably a conservative quantification of the effectiveness of our policy package. In particular, these calculations do not capture the benefit of preventing adverse non-linear dynamics. In other words, the impact of a given change in financial conditions in reality depends on the state of the economy: under acute financial market stress, the presence of financial frictions and balance sheet constraints implies severe non-linearities that translate into much larger contractionary effects brought on by a tightening of financial conditions. In turn, this means that the beneficial impact of policy measures that avert the tightening becomes increasingly large.
This can be illustrated by econometric analysis that quantifies the impact of a tightening in financial conditions, not only on the mean of real GDP growth but also on different parts of its empirical distribution via quantile regression. A tightening of such conditions is associated with a stronger decline in the lower quantiles of euro area real GDP growth compared to the upper quantiles.[10] Given the severity of the shock associated with the COVID-19 crisis, a tightening in financial conditions in the current environment would be expected to have an impact several times larger than the one captured by the average elasticities employed to quantify the impact of the policy package on growth and inflation that I mentioned earlier (Chart 11).
Impact on real GDP growth of a tightening of credit conditions under different states of the economy
(year-on-year percentage change)
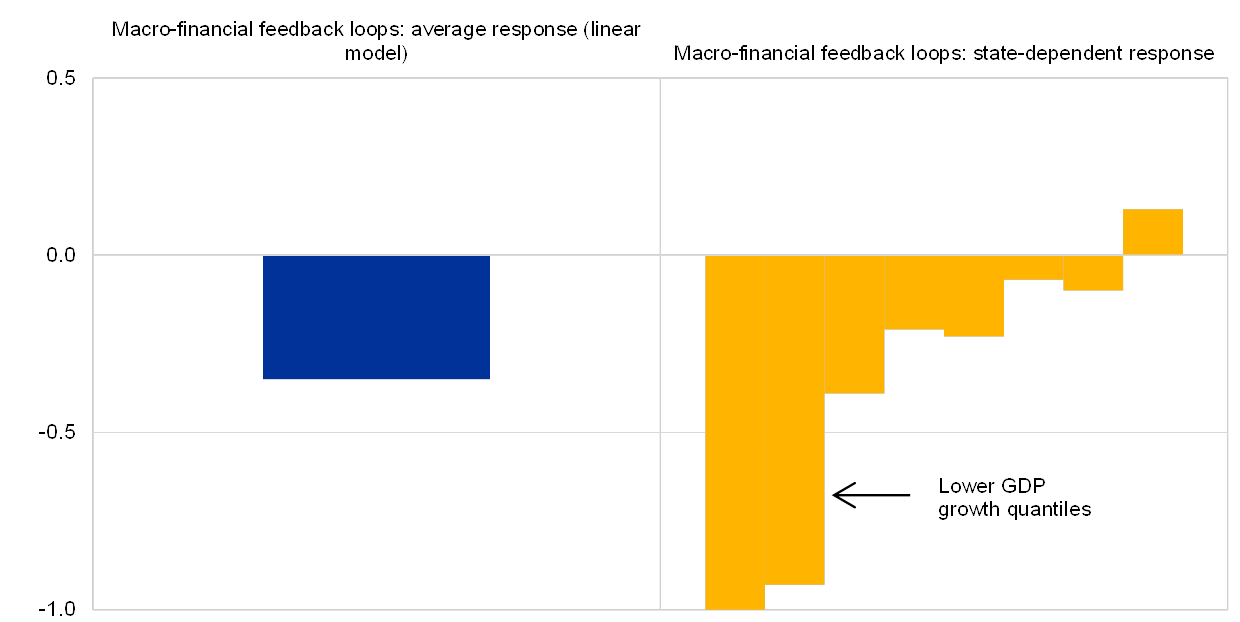
Source: ECB calculations.
Notes: The chart shows the response of real GDP growth to a tightening in financial conditions (one standard deviation) measured through a financial conditions index. The right panel shows the impact across quantiles of the GDP distribution.
In this context, the role of the ECB’s monetary policy measures as a backstop against adverse tail risks has been crucial. By averting a meltdown of financial markets, providing a liquidity backstop, curbing the excessive valuation of risk and preventing the most adverse macro-financial feedback loops that could trigger a credit crunch, our monetary policy package reduces the magnitude of risks around the central tendency of the economic outlook.
It is analytically challenging to provide an exact quantification of this dimension in terms of the macroeconomic support of our policy measures, but let me provide an example in the case of the TLTROs. While the amplification effects of the COVID-19 crisis via banks have so far been contained, the severity of the shock had the potential to lead to a liquidity crunch that would morph into a fully-fledged credit crunch. An illustrative counterfactual exercise by ECB staff suggests that the TLTRO support in removing tail risk would be in the order of three percentage points of euro area real GDP growth in cumulative terms over 2020-22.[11]
In summary, our monetary policy response to the pandemic is not only highly effective in supporting financial conditions, but is also providing crucial support to the real economy and has averted the most severe tail risks. Of course, in terms of the overall policy contribution to containing the macroeconomic impact of the pandemic shock, it should be recognised that the extraordinary fiscal response has played a central role, with an estimated 2.5 percentage point positive contribution to 2020 euro area output.
Asset purchases versus rate cuts
Before I finish, it is perhaps useful to consider an alternative scenario, in which our response to the COVID-19 crisis would have come from further cuts in short-term interest rates rather than from asset purchases. Informing this comparison, ECB staff analysis has shown that episodes of market stress are associated with a weaker pass-through of policy rate cuts to sovereign yields (Chart 12). In fact, longer-term sovereign yields become virtually unresponsive to rate cuts in stressed conditions owing to the subdued portfolio rebalancing effects I mentioned earlier and consistent with the evidence recorded after the spread of the pandemic and prior to the launch of the PEPP.
As a result, policy measures that operate primarily through the risk-free curve – like rate cuts – are unlikely to be as effective at the current juncture as they are in non-stressed conditions – whereas policy measures that directly intervene on sovereign yields may in fact become more effective as they directly compress relevant premia in this market segment. While we stand ready to cut policy rates in the future as market conditions normalise and if warranted by the medium-term inflation outlook, this evidence tilts the balance towards asset purchases as the more efficient tool in current circumstances.
Moreover, the PEPP has played a crucial role in market stabilisation by attenuating the severe financial stress resulting from the COVID-19 crisis and helped to avert a full-blown market panic. In this way, it has acted as a powerful circuit-breaker that mitigated the adverse knock-on effects of the public health emergency to the broader economy. For instance, the stabilising role of the PEPP on financial conditions has so far reduced the risk of viable firms being shut off from crucial funding markets and thereby forced to declare bankruptcy and engage in mass lay-offs. It has also supported the resilience of sovereign bond markets at a time when fiscal policy-makers confronted the major challenges of financing their response to the public health emergency and creating a backstop for their domestic economies.
Pass-through of a 10 basis point standard rate cut to OIS and sovereign yields in non-stressed and stressed conditions
(percentage points)
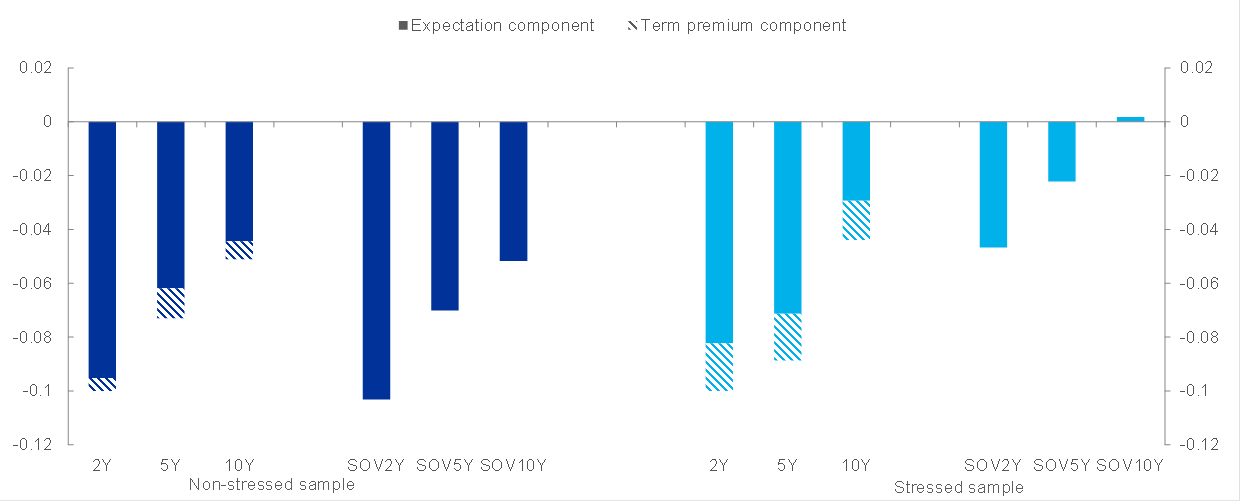
Source: ECB calculations and euro area monetary policy database.
Conclusion
To conclude, the decisive monetary policy measures taken in response to the pandemic emergency have eased financial conditions, averted the most adverse real-financial feedback loops and are supporting confidence and the outlook for growth and inflation.
As always, we will be monitoring the incoming economic and financial data in the coming months. In terms of the flow of information over the summer, it will be unusually difficult for several reasons to extract signals about the medium-term prospects for the economy and the inflation path.
First, while the unlocking of the economy is likely to be associated with a substantial improvement in a variety of near-term growth indicators, the scale of the contraction has been so large that overall activity will remain far below the pre-crisis level and the scale of the initial rebound in these weeks will not necessarily be a good guide to the speed and robustness of the recovery. Second, at the same time, it is plausible that it will take a sustained period of improving economic and public health conditions before the confidence channel that is so important in determining the expenditure plans of households and firms is fully operative. Third, projections about the speed of the recovery also depend on the design and timing of fiscal stimulus programmes. In particular, the outcome of negotiations about the EU recovery fund will be an important factor in determining the future path for the euro area economy.
- [1]I am grateful to Giacomo Carboni, Danielle Kedan and Arthur Saint Guilhem for their contributions to this speech.
- [2]See my blog post entitled “The monetary policy response to the pandemic emergency”, 1 May 2020 and “Eurosystem staff macroeconomic projections for the euro area”, June 2020, European Central Bank.
- [3]For further discussion, see my blog post entitled “Expanding the pandemic emergency purchase programme”, 5 June 2020.
- [4]For more on the tightening of financial conditions, see my blog post from 5 June 2020 (op. cit.).
- [5]See my speech entitled “Monetary Policy and Below-Target Inflation”, 2 July 2019.
- [6]For a more extensive discussion of duration risk, see my speech entitled “The yield curve and monetary policy”, 25 November 2019.
- [7]See my speech entitled “Pandemic central banking: the monetary stance, market stabilisation and liquidity”, 19 May 2020.
- [8]Complementary support is being provided by other policy spheres. First, the easing of capital requirements by supervisory authorities provides banks with an ample buffer to absorb a crisis-related depletion of their capital, diffusing deleveraging pressures. Second, credit guarantee schemes have been put in place by euro area governments, facilitating the flow of funds from financial intermediaries to the private sector.
- [9]The gap between gross and net funding reflects the maturities of the bridge LTROs that were introduced in March of this year and the first operation under TLTRO II, as well as voluntary early repayments of other TLTRO II operations.
- [10]This approach has been popularised recently by Adrian, T., Boyarchenko, N., and Giannone, D. (2019), “Vulnerable growth”, American Economic Review, Vol 109 (4), pp. 1263-89.
- [11]This result draws from a model-based counterfactual exercise in which it is assumed that non-linear real-financial feedback loops materialise in a more adverse manner than was actually the case since the start of the crisis. Simulations are based on a set of models, including the New Multi-Country Model (Dieppe, González Pandiella, Hall and Willman (2013)), the New Area Wide Model II (Coenen, Karadi, Schmidt and Warne (2018)), Darracq Pariès and Kühl (2016), and Darracq Pariès, Kok and Rodriguez Palenzuela (2011). The simulations consider an extreme amplification scenario in which the balance sheets of firms and households deteriorate over the projection horizon, causing banks to incur credit losses and a depletion of capital. In this quantitative analysis, the TLTROs are found to mitigate significantly the macroeconomic impact of adverse amplification mechanisms. For more on the models, see Dieppe, A., Gonzalez Pandiella, A., Hall, S. and Willman, A. (2013), “Limited information minimal state variable learning in a medium-scale multi-country model”, Economic Modelling, Vol 33, pp. 808-825; Coenen, G., Karadi, P., Schmidt, S. and Warne, A. (2018), “The New Area-Wide Model II: an extended version of the ECB’s micro-founded model for forecasting and policy analysis with a financial sector”, Working Paper Series, No 2200, European Central Bank; Darracq Pariès, M. and Kühl, M. (2016), “The optimal conduct of central bank asset purchases”, Working Paper Series, No 1973, European Central Bank; and Darracq Pariès, M., Kok, C. and Rodriguez Palenzuela, D. (2011), “Macroeconomic Propagation under Different Regulatory Regimes: Evidence from an Estimated DSGE Model for the Euro Area”, International Journal of Central Banking, Vol 7 (4), pp. 49-113.
Banca centrale europea
Direzione Generale Comunicazione
- Sonnemannstrasse 20
- 60314 Frankfurt am Main, Germany
- +49 69 1344 7455
- media@ecb.europa.eu
La riproduzione è consentita purché venga citata la fonte.
Contatti per i media