


The impact of Brexit on UK trade and labour markets
Published as part of the ECB Economic Bulletin, Issue 3/2023.
1 Introduction
It has been almost two and a half years since the United Kingdom signed its post-Brexit trade deal with the European Union (EU), which was expected to have multifaceted impacts on the UK economy. The EU-UK Trade and Cooperation Agreement (TCA) was signed on 30 December 2020 and came into effect provisionally on 1 January 2021. Leaving the EU’s Single Market and the EU Customs Union represented a profound change in the economic relationship. This change was expected to have an impact on trade flows between the EU and the United Kingdom, but also on migration flows, foreign direct investment, regulation, the financial sector, science and education, and other areas of the UK economy.
While it will take some time for all the effects to emerge, this article focuses on recent developments in UK trade and labour markets, where the impacts of Brexit have been widely discussed. The coronavirus (COVID-19) pandemic is a confounding factor, but the available data allow a first stocktake of the effects of Brexit. While significant uncertainties regarding the precise magnitudes remain, the available evidence suggests that Brexit has been a drag on UK trade and has contributed to a fall in labour supply, both of which are likely to weigh on the United Kingdom’s long-run growth potential.[1]
2 Developments in UK trade flows since the implementation of the TCA
While the pandemic and supply chain disruptions have affected trade globally over recent years, Brexit had an additional impact on UK trade. The global recession and subsequent recovery in the wake of the pandemic, together with disruptions in global supply chains, have generally increased trade volatility globally over recent years. For the United Kingdom, the extensive and drawn-out negotiations on the withdrawal arrangements and on the future trading relationship generated even greater uncertainty, as also reflected in a sharp depreciation of the country’s exchange rate, which had already negatively affected investment, imports and exports during the period before the United Kingdom’s formal exit from the EU.[2] The United Kingdom’s investment growth rate was low long before Brexit, which also underlies the United Kingdom’s stagnating productivity growth. Following the Brexit referendum, a prolonged period of uncertainty about the EU-UK relationship further dampened investment. Exports have also been affected by the reduced attractiveness of the United Kingdom as an investment destination for foreign companies.[3]
Since January 2021, EU-UK trade has been governed by the EU-UK TCA, which formalised the trade and regulatory relations. The TCA ensures zero tariffs and zero quotas on goods traded between the EU and the United Kingdom. To qualify for tariff-free access, however, UK goods need to meet rule-of-origin requirements, which are set out in detailed annexes to the TCA. Thus, unlike in the Single Market, companies face additional administrative burdens and delays at the border owing to customs and regulatory checks. The United Kingdom and the EU have implemented the agreement at different speeds. While EU countries immediately applied full customs requirements and checks on imports from the United Kingdom, the United Kingdom delayed the introduction of full customs requirements on UK imports from the EU until January 2022, with additional health, safety and security checks delayed until the end of 2023.
UK goods trading volumes with the EU fell significantly after the implementation of the TCA, remaining below their pre-pandemic level until the beginning of 2022. On the import side, despite the delayed application of TCA provisions by the United Kingdom, there was a striking decline in UK imports from the EU over the first months of 2021, which contrasted with a rise in goods imports from non-EU countries (Chart 1, panels a and c). This could point to some substitution between EU and non-EU imports, with goods being redirected away from transits via EU countries. However, different cyclical conditions during the pandemic (owing to differences in case numbers and restrictions) and different exposures to global supply bottlenecks may also have played a major role. As the gap between imports from EU and non-EU partners has closed over recent months, the impact of all these factors appears to have been rather short-lived.[4] On the export side, UK exports to EU countries fell sharply immediately after the introduction of the TCA, as many exporters were struggling to meet the new paperwork requirements for documenting compliance with EU standards (Chart 1, panel b). Subsequently, UK goods exports to the EU recovered somewhat and have since moved broadly in line with exports to non-EU partners, although they remain relatively subdued compared with pre-Brexit trends (chart 1, panel d). Brexit thus remains a major factor. According to a recent survey by the British Chambers of Commerce of more than 1,100 businesses to mark two years since the TCA was signed, 77% of firms trading with the EU said the deal was not helping them to increase sales or grow their business. More than half of the firms reported difficulties in adapting to the new rules for exporting goods (45% for services).[5]
Chart 1
UK trade in goods with EU and non-EU countries
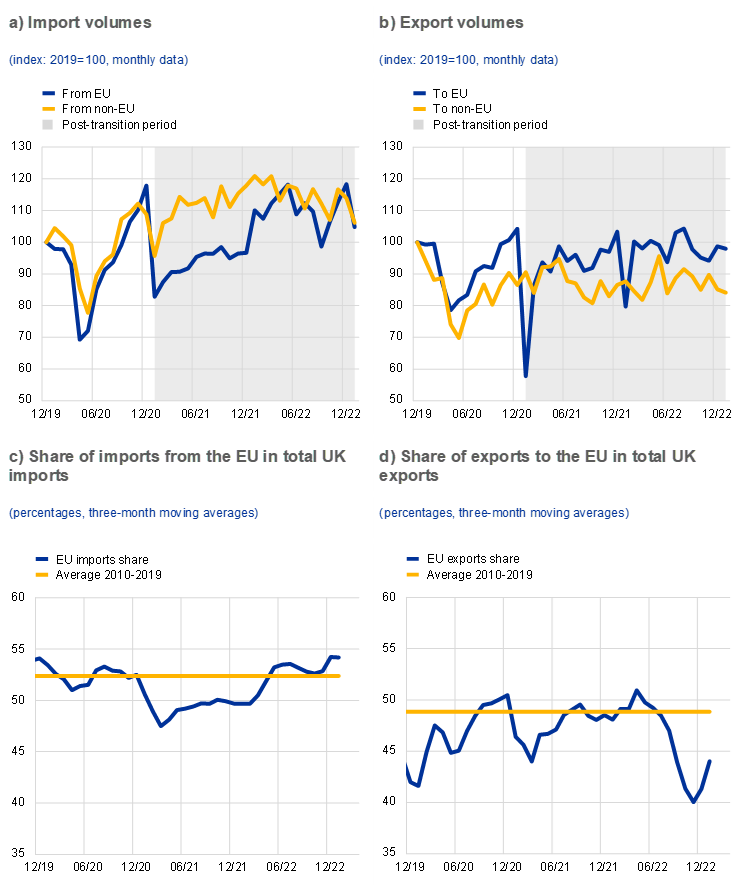
Source: ONS.
Notes: The post-transition period started in January 2021, when the TCA entered into force provisionally. The latest observations are for January 2023.
Services trade with the EU has remained somewhat weaker than trade with non-EU partners. Most of the initially stronger decline in services trade with the EU appeared to be pandemic-related, particularly given the higher share of the travel and transportation sectors in EU trade than in non-EU trade and the travel restrictions during the pandemic (Chart 2). Together with the recovery in tourism, UK services trade has bounced back, well exceeding pre-pandemic levels. This also reflects the post-pandemic increase in travel prices. Other important categories of services exports to the EU, such as financial services, fell further than, or failed to grow as much as, exports to the rest of the world until the end of 2021 and have remained below their pre-pandemic levels. Brexit thus appears to have played some role, possibly also owing to the lack of agreements covering trade in services. In the area of financial services, which account for around 20% of total UK services exports, the TCA’s provisions were limited. The United Kingdom and EU had agreed that, alongside the TCA, they would conclude a Memorandum of Understanding on regulatory cooperation, but this has still not been signed. Since Brexit, the importance of the EU as a UK trading partner has declined, with the EU accounting for 29% of total UK financial services exports in 2022, compared with 37% in 2019.
Chart 2
UK trade in services and UK services exports for selected sectors
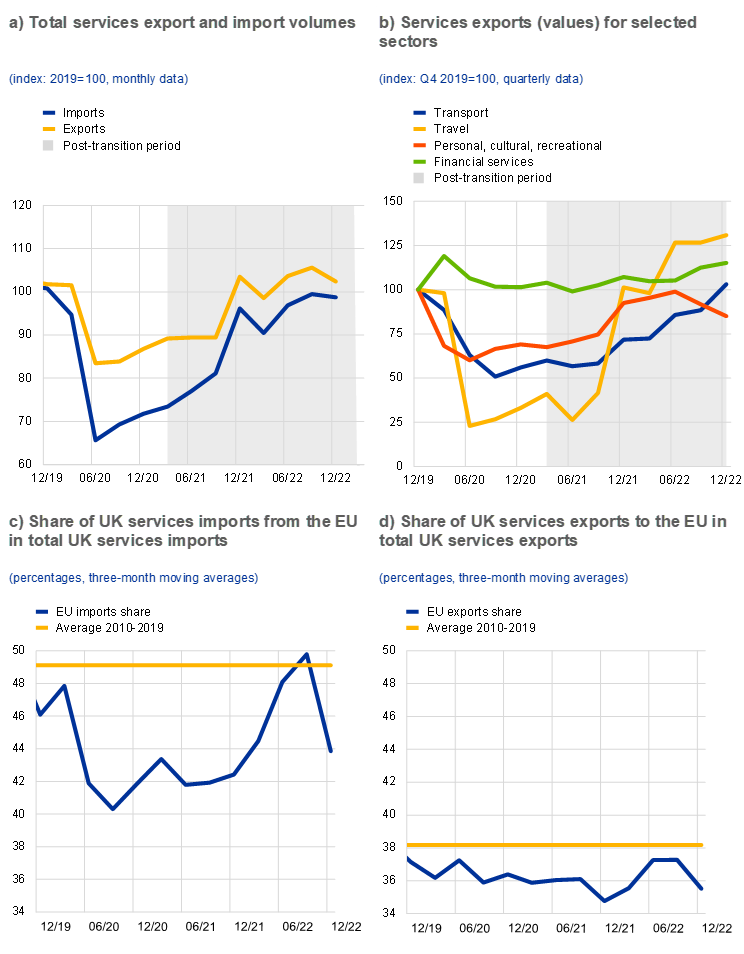
Source: ONS.
Notes: The decomposition of services trade into exports to the EU and non-EU partners and imports from the EU and non-EU partners is only available in terms of values. The latest observations are for January 2023 for volumes and the fourth quarter of 2022 for services export values.
The UK current account deficit has widened since the implementation of the TCA, mostly driven by developments in the goods balance. In the first quarter of 2022, the UK current account deficit reached a record high of 7.7% of GDP, which was due to a worsening in both the trade deficit and the income balance (Chart 3). While most of the recent widening of the trade deficit could be attributed to high energy prices, the deterioration of the goods balance since the implementation of the TCA has generally been the main driver behind the developments in the UK current account. The services balance has remained fairly stable since the beginning of 2021, at around 6% of UK GDP, marking an end to the previously observed trend of rising surpluses in the UK services balance.
Chart 3
UK current account
a) Decomposition of the UK current account
(percentages of GDP)
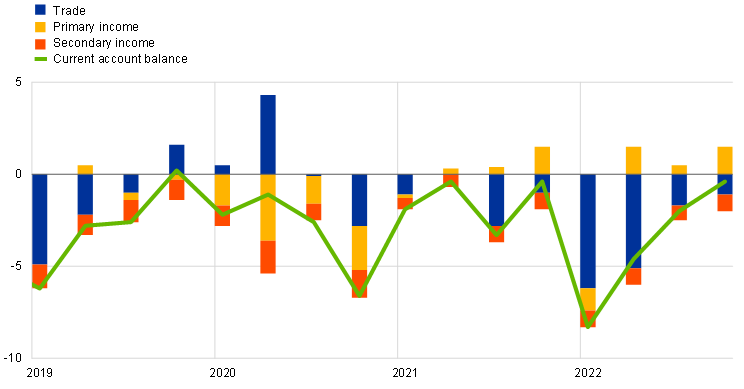
b) Goods and services balances
(percentages of GDP)

Source: ONS.
Note: The latest observations are for the fourth quarter of 2022.
The post-pandemic recovery in UK trade has lagged behind that of other advanced economies. While the United Kingdom saw a collapse in exports that was similar to other countries at the start of the pandemic, it benefited much less from the subsequent recovery in global trade (Chart 4). By the end of 2021, other advanced economies’ exports had rebounded almost to their pre-pandemic levels, while UK exports remained around 10% below that level. As a result, UK trade as a share of GDP fell by 11% between 2019 and the end of 2021 – a significantly stronger decline than that observed in the euro area or the United States. By the end of 2022, the gap between UK exports and those of other advanced countries appeared to have closed, which may indicate that the disturbances linked to the Brexit transition period are dissipating. However, this needs to be interpreted with caution. Temporary catch-up effects from the pandemic and recent changes in UK trade statistics may also account for this development.
Chart 4
Goods export volumes in advanced economies
(index: 2019=100, monthly data)

Source: CPB Netherlands Bureau for Economic Policy Analysis.
Note: The latest observations are for January 2023.
3 Weakness in UK trade compared to other advanced economies: the role of Brexit
Two main approaches have been taken in the literature to isolate the impact of Brexit from pandemic-related effects. Various researchers have used a difference-in-difference approach, using different datasets and specifications. For example, Freeman et al., Du and Shepotylo, and Du et al. compare the evolution of UK-EU trade with UK trade with the rest of the world. Kren and Lawless, by contrast, use EU trade with the rest of the world as a comparison group.[6] Using high-frequency product-level data on trade in goods, a comprehensive set of product-time and product-partner fixed effects are applied to control for changes in trade patterns other than Brexit, in particular the changes in trade flows as a result of the COVID-19 pandemic. Following an alternative approach, Springford provided several updates of estimates of Brexit impacts using a “doppelgänger” method in which an algorithm selects countries whose economic performance closely matched that of the United Kingdom before Brexit.[7]
Taking into account the differences in methodologies, the available empirical evidence suggests that Brexit has reduced UK-EU trade in both directions. Table 1 provides an overview of recent results obtained using various approaches. Estimates of the decline in UK trade with the EU range from around 10% to 25%.[8] As the updates by Springford and Du et al. show, the results also depend on the time horizon being considered. As both UK and EU firms are still adjusting to the new environment, the gap between estimates may narrow again over time. Apart from providing estimates of Brexit effects since 2021, the available studies generally find no evidence of anticipation effects, i.e. a decline in UK-EU trade as a proportion of total UK trade prior to the provisional implementation of the TCA at the start of 2021. Across EU Member States, Brexit has led to a significant decline in trade with the United Kingdom in almost all cases, although at varying magnitudes. The decline has been most noticeable for those countries that historically accounted for a higher share of trade (i.e. trade in both directions with Ireland, exports to Cyprus and Malta, imports from Belgium and the Netherlands).[9] At the product level, it appears that there has been a substantial reduction in the number of products exported from the United Kingdom to the EU. The same is not found for exports of products from the EU to the United Kingdom. Overall, this is broadly consistent with the increased customs requirements on the EU side having a greater impact on low-value trade flows, often stopping such flows completely. At the same time, there has been an increasing concentration of export sales among fewer, larger exporters.
Table 1
A selection of recent (i.e. post-Brexit) estimates of Brexit impacts on EU-UK goods trade
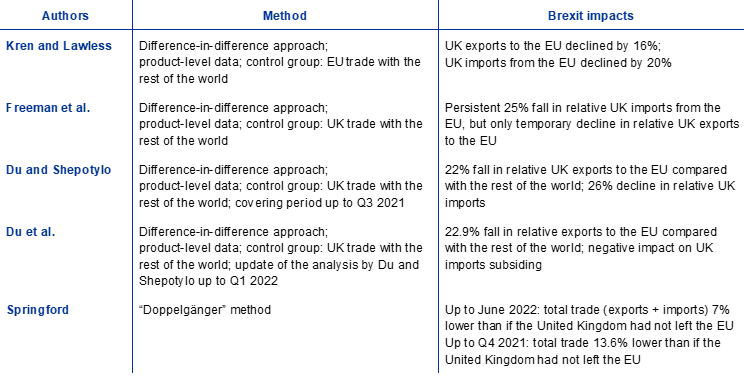
Source: Authors’ compilation.
A comparison of these results with those from analyses performed prior to Brexit suggests that the initial impacts following the TCA have been more severe than expected. Ahead of Brexit, many Brexit scenario simulations were performed with different types of models, assuming different levels of tariffs and non-tariff barriers.[10] For instance, based on a New Keynesian DSGE model, which assumes a free trade agreement scenario for goods trade with the euro area similar to the terms of the TCA, it was typically expected that Brexit would lead to a decrease in total UK exports and imports (in the long run) of roughly 3%, with minor effects on goods exports to the euro area but more sizeable declines in services exports to the euro area.[11] The available evidence so far suggests that the initial adverse impact on UK goods exports has been more sizeable, indicating that UK exporters, at least initially, have been struggling to meet the increased administrative requirements following the introduction of customs checks at the EU border. As developments in services appear to have been strongly driven by pandemic-related factors, further analyses would be needed to disentangle the impact of Brexit from the impact of the pandemic on this sector.[12]
4 Recent developments in the UK labour market
The UK labour market has become increasingly tight since the post-pandemic reopening, which also coincided with a fall in the number of EU migrants working in the United Kingdom. Following the post-pandemic recovery in demand in the second quarter of 2021, UK employers faced an unusually tight labour market, with a historically high number of vacancies and a low unemployment rate. Labour market tightness, measured as vacancies per unemployed person, has shown limited signs of easing, while companies have continued to struggle with recruitment difficulties (Chart 5, panel a).
Chart 5
Recent UK labour market developments
a) Labour market tightness and unemployment
(left-hand scale: percentages; right-hand scale: ratio of vacancies to unemployment, monthly data)

b) Labour demand and supply
(index: February 2020=100, monthly data)
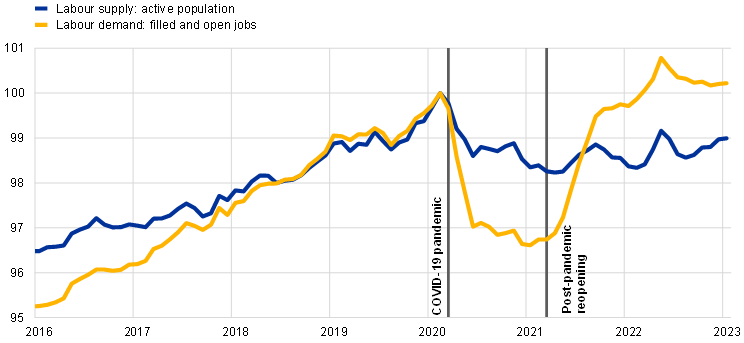
Source: ONS.
Notes: All series are shown as three-month moving averages. Labour market tightness is measured as vacancies per unemployed person. Data refer to UK population above 16 years old. The latest observations are for January 2023.
Weakness in labour supply has been the main driver of UK labour market tightness, while the surge in post-pandemic aggregate demand has played only a limited role. Many other advanced economies also experienced tight post-pandemic labour markets. In the same way as the initial collapse in aggregate demand at the start of the pandemic reduced recruitment of new workers, the reopening of the economy accelerated demand and encouraged companies to rehire staff. However, the persistence and the extent of labour market tightness make the United Kingdom an outlier, comparable only to the US economy.[13] One reason could be the sluggish recovery in UK labour supply, which has lagged behind other advanced economies (Chart 6). During the pandemic, many people became inactive, and, unlike the employment rate, the participation rate in the workforce has not reached pre-pandemic levels as the economy has recovered (Chart 5, panel b). A historical shock decomposition using a Bayesian vector autoregression (BVAR) analysis illustrates that the surge in UK post-pandemic labour market tightness can be attributed mainly to a smaller pool of available workers. While a faster than expected recovery was responsible for the initial rise in demand after the reopening of the economy, the analysis suggests that labour supply played a particularly important role. In contrast, aggregate supply constraints and labour mismatches appear to have been less significant (Chart 7).[14] The tightness of the UK labour market has therefore raised questions about the role of Brexit in UK labour shortages. The next section outlines the potential role of Brexit and changes in immigration policy in explaining these developments in labour supply.
Chart 6
Labour supply in advanced economies
(index: Q1 2020=100, quarterly data)

Sources: Organisation for Economic Co-operation and Development.
Notes: Data for all countries refer to the active population between 15 and 64 years old that is either employed or actively seeking work. The latest observations are for the fourth quarter of 2022.
Chart 7
Labour market tightness, BVAR historical decomposition
(percentage deviation from the mean and percentage point contributions, monthly data)
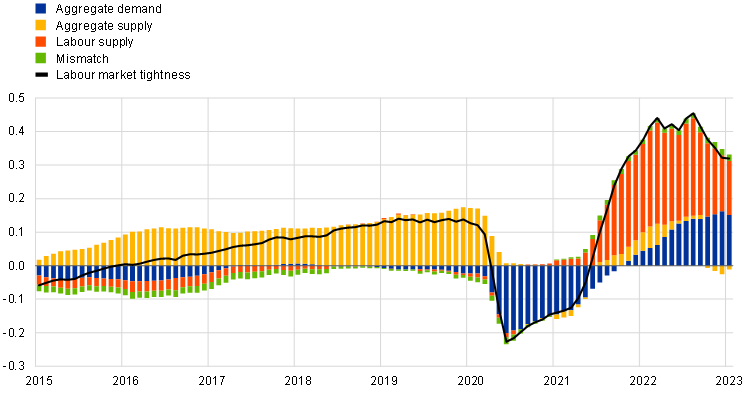
Sources: ONS and ECB staff calculations.
Notes: The chart shows the median posterior distribution of the historical decomposition of labour market tightness in deviation from its initial condition. Based on a BVAR estimation with sign restrictions, estimated using a monthly sample between January 2002 and January 2023. Structural shocks are identified using sign restrictions. In particular, aggregate demand shocks are identified by assuming that GDP and the consumer price index (CPI) move in the same direction, while aggregate supply shocks assume that they move in opposite directions. Labour supply shocks are assumed not to affect aggregate variables (GDP and CPI) on impact and to move tightness and wages in the same direction. Mismatch shocks affect wages and labour market tightness. Labour market tightness is measured in levels, while other variables are measured in month-on-month growth rates. The latest observations are for January 2023.
5 Weakness in UK labour supply: the role of Brexit
The Brexit referendum and the pandemic prompted a slowdown in EU employment growth as many EU workers found it less attractive to work in the United Kingdom. Prior to the 2016 referendum, successive EU enlargements had accelerated the movement of people between the United Kingdom and the rest of the EU.[15] The prospect of the Brexit referendum in June 2016 prompted a decline in EU net migration, as EU citizens found it less attractive to work in the United Kingdom.[16] The decline in new arrivals was accelerated by the onset of the pandemic in early 2020 and by the implementation of the TCA in January 2021.[17] The agreement introduced changes to UK immigration policy and ended automatic free movement for EU nationals not already settled in the United Kingdom. When looking at changes in the employment of EU citizens in the United Kingdom, it is evident that growth in such employment has slowed considerably since the Brexit referendum. A sharp fall at the onset of the pandemic was followed by a slow recovery in EU employment levels (Chart 8).
Chart 8
EU employment before and after the Brexit referendum
(index: Q2 2016=100, quarterly data)
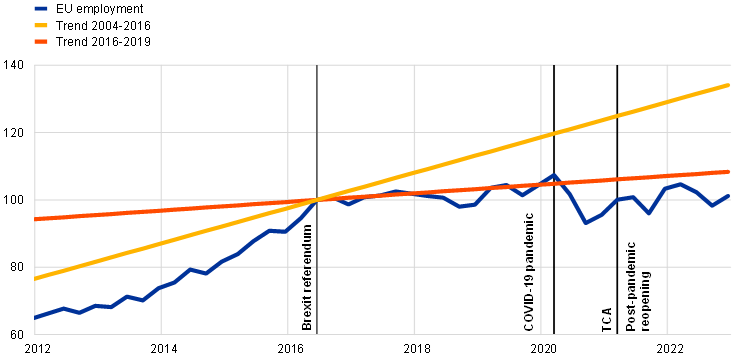
Source: ONS.
Notes: The chart shows employment of EU citizens in the United Kingdom before and after the Brexit referendum. The series is not seasonally adjusted. Data are shown on a quarterly basis and must be interpreted with some caution as they are based on Labour Force Survey responses weighted according to demographic trends from 2018 that pre-date the COVID-19 pandemic. “Trend 2004-2016” refers to the period between the first quarter of 2004 and the second quarter of 2016. “Trend 2016-2019” refers to the period between the third quarter of 2016 and the first quarter of 2020. The latest observation is for the fourth quarter of 2022.
The rise in UK vacancies and labour market tightness has been greatest in sectors that relied most heavily on EU workers, but this can also be attributed to a sharp recovery in demand in the sectors most affected by the pandemic. In the second half of 2021 there were many reports of UK labour shortages, ranging from lorry drivers to healthcare and hospitality workers.[18] At first glance, the sharp rises in vacancies appeared to be limited predominately to the occupations and sectors that relied most heavily on EU workers before the pandemic, as increased demand for labour potentially reflected the reduced supply of workers from the EU. These sectors also experienced a sharper increase in labour market tightness (Chart 9, panels a and b). This might imply a decline in matching efficiency in these industries, owing to an increase in skill and sectoral mismatches between those seeking work and available jobs.[19] The implications of Brexit were underlined by survey data, as, on average, 15% of UK companies cited lack of availability of EU workers as one of the reasons for their recruitment difficulties. This was particularly evident for sectors which had a high share of EU workers before the pandemic, such as accommodation and food services (Chart 10).[20] However, these sectors were also the ones most affected by the pandemic, since EU nationals were overrepresented in contact-intensive industries, which experienced the largest fall in employment during the lockdowns (Chart 9, panel c). Along with Brexit, the rapid recovery in post-pandemic consumer demand can therefore also explain a rapid surge in vacancies and labour market tightness, as firms in these sectors struggled to rehire previously laid-off staff.[21]
Chart 9
Labour market developments in sectors with traditionally high shares of EU workers

Source: ONS.
Notes: The sectors that had the largest share of EU employees in 2015 were accommodation and food service activities (12.8%); manufacturing (10%); administrative and support service activities (9.8%); and transportation and storage (8.5%). “Other sectors” includes water supply, sewerage, waste management and remediation activities; construction; wholesale and retail trade, repair of vehicles; information and communication; financial and insurance activities; real estate activities; professional, scientific and technical activities; public administration and defence; education; human health and social work activities; and arts, entertainment and recreation. Some sectors are excluded owing to insufficient sample representation. Data for vacancies and tightness are shown as three-month moving averages. Data for unemployment are shown at quarterly frequency. The monthly series are not seasonally adjusted. The latest observations are for February 2023 for vacancies, January 2023 for labour market tightness and the fourth quarter of 2022 for employment.
Chart 10
Recruitment difficulties owing to reductions in EU applicants
(percentages of companies)

Source: Business Insights and Conditions Survey (ONS).
Notes: The chart shows responses to the survey, which was performed at irregular intervals, in particular for sector-level data. The series display the share of businesses that reported difficulties recruiting employees and considered a reduced number of EU applicants to be one of the major factors. The latest observations are for 31 December 2022.
The slowdown in EU migration has to some extent been offset by an increase in non-EU migration. International migration was a key element in employment growth in most UK sectors before 2019.[22] Higher-skilled sectors recruited from both EU and non-EU countries, while lower-skilled sectors typically relied heavily on EU workers, given that lower-skilled workers from non-EU countries were generally not allowed to enter the UK labour market.[23] Following the Brexit referendum, the size of the EU migrant labour force began to shrink, while the share of non-EU employees was gradually increasing. The changes in total net migration indicate that by end of 2021, migration flows had returned to, or even surpassed, pre-pandemic levels. However, when only migrants seeking work are considered, the flows are much lower, albeit still relevant for labour market dynamics (Chart 11).[24] This raises the question of whether employers started to switch from EU to non-EU workers or whether the aggregate dynamics conceal asymmetries recorded at a sectoral level.
Chart 11
Net migration to the United Kingdom by nationality
a) Old data collection methodology
(thousands, annual data)

b) New data collection methodology
(thousands, quarterly data)

Source: Centre for International Migration (ONS).
Notes: Panel a) displays annual data, while panel b) shows quarterly values since the second quarter of 2020. Each data point refers to year-end values in a particular quarter. Data on non-EU migration for work purposes in panel b) are approximated by ECB staff on the basis of the share of migration for work purposes in International Passenger Survey data. Such data are not available for EU migration under the new data collection methodology. In 2020 and 2021, study (45%) was the main reason for non-EU migration, while work (26%) and other reasons (29%) each accounted for a similar share. The latest available data show that other reasons accounted for a larger share (39%), probably reflecting an increased inflow of people arriving for humanitarian protection. The old estimates are produced using different methods from the new estimates, implying that comparisons between the two panels should be avoided. It should also be noted that the new estimates are experimental and provisional. These estimates are based on administrative and survey data from different sources, supported by statistical modelling where the data are incomplete. The latest observations are for the second quarter of 2022.
While on average the rise in non-EU arrivals has more than offset the fall in EU migration, the new migration policy has reduced labour supply in some sectors. The new migration rules had a particularly negative impact on labour supply in lower-skilled sectors. The reversal in migration flows could be explained by the new immigration system that liberalised access to the UK labour market for skilled non-EU citizens, while requiring visas for EU nationals who had previously faced no restrictions. Work permits have become attainable only for those above a certain skill and salary level.[25] This made most lower-skilled industries, which had previously relied predominantly on EU workers, ineligible to issue work visas, and prompted an increase in non-EU migration, easing shortages in some sectors and occupations (Chart 12, panel a). Sectors driving the surge in employment of non-EU citizens were, in most cases, not the same as those driving the decline in employment of EU citizens. As new visa conditions made hiring of lower-skilled EU workers more difficult, the absence of these workers became particularly apparent in sectors such as accommodation and food services (Chart 10). Firms in the hospitality industry were thus initially not able to replace workers from the EU, although the industry has observed an increase in non-EU employment over the past year (Chart 12, panel b).[26] In contrast, some other industries, such as health and social work, have not been negatively affected by the new migration rules or have even benefited from the inflow of skilled non-EU workers (Chart 12, panel c).[27] While on average the rise in non-EU employment has offset the fall in EU employment, the new migration policy has reduced labour supply in some sectors.[28] Nevertheless, the evidence available so far suggests that changes in migration flows are only one of multiple factors contributing to an increase in labour market tightness.
Chart 12
UK employment by nationality
(change since December 2019, thousands, monthly data)

Source: HM Revenue and Customs.
Notes: The data are not seasonally adjusted and are shown as three-month moving averages. They include only payroll employment under the Pay As You Earn system and do not include other sources of employment, such as self-employment. However, the data do include individuals who were furloughed as part of the Coronavirus Job Retention Scheme. It should also be noted that these estimates are experimental and provisional. Changes in net UK employment are excluded to highlight the changes in employment of non-UK citizens. The accommodation and food sector represents 8% of total UK employment, while the health and social work sector accounts for 14%. The latest observations are for December 2022.
Brexit can only partially explain the weakness in the UK labour supply recovery, while an ageing population and pandemic effects appear to play an important role in explaining the decline in UK labour force participation. Changes in EU migration are not the only factor behind the recent changes in UK labour supply. Labour force growth had already started to decrease before the pandemic, as the United Kingdom’s “baby boomer” generation began to retire (as also observed in many other advanced economies), resulting in a marked shrinkage in the UK-born working-age population. Population ageing was countered to a certain extent by raising both male and female pension ages and through higher educational attainment, but the impact of these measures had largely dissipated by the onset of the pandemic.[29] Higher inactivity rates among those aged over 50 has contributed considerably to the increase in the inactive population (Chart 13, panel a). Other factors triggered by the pandemic have also contributed to the decline in labour participation. While the pandemic and prolonged waiting times for health services appear to have increased the number of people with long-term health issues among the inactive population, this increase is thought to be predominantly linked to individuals who were already inactive before the pandemic. When looking at flows out of the labour force, early retirement accounts for a much larger share (Chart 13, panel b).[30]
Chart 13
Other factors driving an increase in labour market inactivity
a) Inactive population by age cohort
(change since February 2020, thousands, monthly data)

b) Reasons for flows into inactivity for people aged between 50 and 70 years
(change compared to average for 2016-2019, thousands, annual data)

Source: Longitudinal Labour Force Survey (ONS).
Notes: Data in panel a) are shown as three-month moving averages. Although the UK retirement age is currently 66, the only data available are for everyone above the age of 65. Data in panel b) refer to the change in the number of economically inactive people aged 50 to 70 years grouped by the reason for inactivity compared to the average between 2016-2019. The latest observations are for January 2023 for panel a) and December 2021 for panel b).
6 Conclusions
Almost two and a half years after the United Kingdom’s exit from the EU’s Single Market and the EU Customs Union, there is increasing evidence that Brexit has had negative effects on UK trade and the UK labour market. On the trade side, after controlling for pandemic-related effects, Brexit appears to have caused a significant decline in EU-UK trade in both directions, which, however, may recover to some extent over time, once UK and EU firms have fully adjusted to the new environment. The share of trade in GDP terms has also declined and a number of small and medium-sized UK companies have withdrawn from external trade with the EU. Regarding the labour market, there is evidence that the end of free movement for EU citizens has also contributed to the recent surge in labour shortages, particularly in sectors with lower-skilled workers. However, there have also been other, and potentially more important, drivers of the decline in UK labour force participation. Considerable uncertainty remains regarding the long-run impacts, including the extent to which the slowdown in EU trade and EU migration could weigh on potential labour supply and future productivity.
For further discussion on the impact on potential growth, see “Monetary Policy Report”, Bank of England, February 2023.
See, for instance, Graziano, A.G., Handley, K. and Limão, N., “Brexit uncertainty and trade disintegration”, The Economic Journal, Vol. 131, No 635, April 2021, pp. 1150-1185. For a review of developments in UK import demand and the balance of payments since the referendum, see the article entitled “Understanding post-referendum weakness in UK import demand and UK balance of payments risks for the euro area”, Economic Bulletin, Issue 3, ECB, 2021. Instead of benefiting from the sharp depreciation of the pound sterling, exports also suffered, given the high uncertainty and firms’ anticipation of the need to decouple.
See Driffield, N. and Karoglou, M., “Brexit and Foreign Investment in the UK”, Journal of the Royal Statistical Society Series A: Statistics in Society, Vol. 182, No 2, October 2018, pp. 559-582.
This development, however, needs to be interpreted with some caution, as data on goods imports from the EU were inflated in the first half of 2022 by delayed customs declarations from the second half of 2021. More generally, when interpreting recent developments in UK trade, it is important to note that in January 2022 HM Revenue and Customs implemented a data collection change affecting data on imports from the EU into the United Kingdom. This followed a similar data collection change in January 2021 for data on exports of goods to the EU from the United Kingdom. The Office for National Statistics (ONS) applied adjustments to 2021 EU imports to compare import and export statistics on a like-for-like basis. The full time series for imports from the EU still contains a discontinuity from January 2021.
See “The Trade and Cooperation Agreement: Two Years On – Proposals for Reform by UK Business”, British Chambers of Commerce, 2022.
See Freeman, R., Manova, K., Prayer, T. and Sampson, T., “UK trade in the wake of Brexit”, Discussion Paper, No 1847, Centre for Economic Performance, April 2022; Du. J. and Shepotylo, O., “TCA, Non-tariff Measures and UK Trade”, ERC Research Paper, No 98, Enterprise Research Centre, June 2022; Du, J., Satoglu, E.B. and Shepotylo, O., “Post-Brexit UK Trade: An Update”, Insight Paper, Centre for Business Prosperity, Aston University, November 2022; and Kren, J. and Lawless, M., “How has Brexit changed EU-UK trade flows?”, ESRI Working Paper, No 735, Economic and Social Research Institute, October 2022.
See Springford, J., “The cost of Brexit to June 2022”, Insight, Centre for European Reform, December 2022. For more details on the methodology, see Springford, J., “What can we know about the cost of Brexit so far?”, Centre for European Reform, June 2022.
Results from a preliminary internal analysis performed in the context of the EU-UK network using aggregate data also lie within this range.
See Kren and Lawless, op. cit., Table 4.
For a summary of results of earlier analyses, see “A review of economic analyses on the potential impact of Brexit”, Occasional Paper Series, No 249, ECB, October 2020. Pre-Brexit studies were typically concerned with longer-run steady-state effects and most envisaged some stronger disruptions in advance of the referendum.
See Pisani, M. and Vergara Caffarelli, F., “What will Brexit mean for the British and euro-area economies? A model-based assessment of trade regimes”, Temi di Discussione (Working Papers), No 1163, Banca d’Italia, January 2018.
There has been no recent analysis of Brexit impacts on services trade. Du and Shepotylo studied the impacts of the 2016 Brexit referendum on services trade in the United Kingdom and Ireland for the period up to the second quarter of 2020, finding that Brexit was already having adverse impacts on UK services trade ahead of the end of the transition period. See Du, J. and Shepotylo, O., “Feeding the Celtic Tiger – Brexit, Ireland and Services Trade”, Research Paper, Aston Business School, May 2021.
See also Gomez-Salvador, R. and Soudan, M., “The US labour market after the COVID-19 recession”, Occasional Paper Series, No 298, ECB, July 2022.
We introduce a BVAR model for the UK labour market that features structural identification via sign restrictions. The model includes four variables: output, inflation, labour market tightness and wages. With this set of variables, we aim to identify four shocks: an aggregate demand shock, an aggregate supply shock, a labour supply shock and a mismatch shock. A positive demand shock represents an upward shift in the demand curve, which pushes up output and inflation. A positive aggregate supply shock reflects changes in productivity or potential capacity in the economy, increasing output and reducing inflation through lower marginal costs for firms. A positive labour supply shock refers to an exogenous increase in labour supply which increases the number of participants in the labour market, leading to an increase in the number of job seekers. This makes it easier for firms to fill vacancies, leading to a decrease in labour market tightness and wages and an increase in output. A positive mismatch shock refers to exogenous changes in the process of matching jobs and workers, shifting the job creation curve upward and increasing both labour market tightness and wages in the economy.
The rapid increase in the movement of people can be attributed to several factors, such as the United Kingdom’s decision to immediately welcome nationals from the new Member States in 2004, the flexibility of the UK labour market, the appeal of London and the English language, and the attractiveness of UK universities. See Sumption, M., Forde, C., Alberti, G. and Walsh, P.W., “How is the End of Free Movement Affecting the Low-wage Labour Force in the UK?”, Report, The Migration Observatory at the University of Oxford and ReWAGE, August 2022.
The discouragement of EU workers can mainly be explained by the political and legal uncertainty related to Brexit, but also by the declining value of the pound sterling and the relatively better economic performance of other EU economies.
The pandemic-related exit of EU citizens partially reflected their high share of employment in high-contact services sectors, which were prone to furloughs and layoffs. In addition, the United Kingdom performed comparatively badly in terms of health sector capacities during the first wave of the pandemic.
For instance, severe shortages of lorry drivers affected the supply of retail goods, food products and fuel at petrol stations and restricted the capacity of UK ports. Shortages of butchers and workers in the meat processing industry forced farms to cull thousands of animals. In addition, there have been instances of severe recruitment difficulties in hospitality, construction, agriculture, and business and professional services.
See also “Monetary Policy Report”, Bank of England, February 2023.
Other sectors with above-average values were: manufacturing; transport and storage; water supply, sewerage, waste management and remediation activities; real estate activities; and education. For results from the Business Insights and Conditions Survey, see “Business insight and impact on the UK economy: 9 February 2023”, statistical bulletin, ONS, February 2023.
Changes in employment do not reflect the 11.7 million jobs furloughed under the Coronavirus Job Retention Scheme, which applied from 1 March 2020 to 30 September 2021.
Workers from outside the United Kingdom accounted for 70% of the increase in employment between 2004 and 2019. The contribution from EU employment was slightly above 35%.
Some exceptions for employer-sponsored long-term visas were allowed for shortage occupations and for young people under the age of 26, while unsponsored long-term visas were available for “Global Talent”, entrepreneurs and Commonwealth citizens. Some non-EU workers were also eligible for temporary work visas. See Sumption, M. and Strain-Fajth, Z., “Work visas and migrant workers in the UK”, Briefing, The Migration Observatory at the University of Oxford, September 2022.
While net migration was positive in 2022, the sharp increase in non-EU inflows also reflects other factors, such as people arriving for humanitarian protection (from Ukraine and Hong Kong) and a post-pandemic surge in international students.
The new migration system introduced in January 2021 allows prospective economic migrants to apply for either a “Skilled Worker visa”, if they already have a job offer above a certain salary and skill threshold, or a “Seasonal Worker visa”, which is intended for short assignments in the agricultural and food-production sectors. The loss of free movement has therefore been offset by the more liberal regime for skilled work visas, primarily benefiting non-EU workers.
Initially, the biggest declines in EU employment were in accommodation and food services and in administrative and support services. In both sectors, employers relied heavily on EU citizens before Brexit and have not resorted to the work visa system since the pandemic, because relatively few of the jobs concerned meet the skill and salary criteria for work visas and because these employers have little experience of using the visa system in the past. See Sumption, M., Forde, C., Alberti, G. and Walsh, P.W., “How is the End of Free Movement Affecting the Low-wage Labour Force in the UK?”, op. cit. In 2022 these sectors recorded an increase in non-EU employment, which could be attributed to inflows of non-EU workers through the Youth Mobility Scheme, humanitarian protection visas or as dependants to the main applicants. Their flexible work rights made them likely to seek employment in low-skilled occupations. See “Migration Advisory Committee (MAC) annual report, 2022”, corporate report, Migration Advisory Committee, January 2023.
The increase in non-EU workers was driven primarily by the health sector, as the high share of roles eligible for skilled work visas helped with a switch from lower levels of EU migration towards non-EU recruitment. Health sector employers are also larger on average and have more experience of using visa schemes.
Analysis comparing pre-pandemic counterfactuals to the actual outturns points to a net loss of workers accounting for 1% of the labour force. See Portes, J. and Springford, J., “The Impact of the Post-Brexit Migration System on the UK Labour Market”, Discussion Paper Series, No 15883, IZA Institute of Labor Economics, January 2023.
See Saunders, M., “Some reflections on Monetary Policy past, present and future”, speech at the Resolution Foundation, 18 July 2022.
See Boileau, B. and Cribb, J., “The rise in economic inactivity among people in their 50s and 60s”, IFS Briefing Note, No BN345, Institute for Fiscal Studies, June 2022.