
Past and future of the ECB monetary policy
Speech by Vítor Constâncio, Vice-President of the ECB, at the Conference on “Central Banks in Historical Perspective: What Changed After the Financial Crisis?”, organised by the Central Bank of Malta, Valletta, 4 May 2018
This is the full text of a speech delivered in abridged form at the Central Bank of Malta on 4 May.
Ladies and Gentlemen,
It is a pleasure to be here today and participate in this celebratory event for the 50th anniversary of the Central Bank of Malta. In accordance with the conference theme, I would like to take this opportunity to adopt a historical perspective and offer some reflections on monetary policy in the euro area over the past two decades. I will start with a review of the ECB journey from 1999 to date, to highlight the evolution of the practice of monetary policy in the euro area over this period. I will then draw some lessons from this experience, both for economic thinking and monetary policy making.
The ECB journey
As you all know, the Treaty on the European Union defines the contours of monetary policy in the euro area. According to Article 127 of the Treaty, price stability is the primary objective of monetary policy in the euro area. It is only without prejudice to the objective of price stability that monetary policy can support the general economic policies in the Union. This high-level mandate enshrined in the Treaty is the cornerstone of all ECB decisions and has remained unchanged over its two decades of existence.
Within the boundaries of the Treaty, however, the practice of monetary policy in the euro area has undergone a process of transformation over time. While the transformation has often been gradual, four key phases can be clearly identified.
First Phase: Monetary policy beginning and adjustment (1999-2003)
The first phase starts with the launch of the single currency and lasts until the revision of the monetary policy strategy in May 2003, when the weight of the monetary pillar and the “dominant role of money” were demoted and the framework got closer to the flexible inflation targeting regime adopted by many other central banks around the world.
In the preparation for monetary union, a document published in 1997 by the ECB predecessor, the European Monetary Institute, explained why both a monetary aggregates targeting strategy and an inflation targeting regime were not considered fully appropriate for the euro area.[1] The first regime, which was followed by the Bundesbank, in a tradition that understandably exerted a crucial influence on the initial ECB decisions, was refused for the practical reason that money demand functions at the European level would not be stable enough to allow for a reliable calibration of a M3 target. The refusal of pure inflation targeting was justified by the theoretical reason that it did not allow a role for money.
One of the first decisions of the Governing Council, already in 1998, was to announce the adoption of a “stability-oriented monetary policy strategy” to attain the goals set out in the Treaty. The strategy was a sort of hybrid based on the two main strategies previously examined and characterised by the following key elements, as described in the ECB’s Monthly Bulletin of January 1999: “The strategy consists of three main elements: (i) a quantitative definition of the primary objective of the single monetary policy, namely price stability; and the “two pillars” of the strategy used to achieve this objective: (ii) a prominent role for money, as signaled by the announcement of a reference value for the growth of a broad monetary aggregate; and (iii) a broadly based assessment of the outlook for future price developments and the risks to price stability in the euro area as a whole.”
There was clearly a dominant first pillar with a reference value initially set at 4.5% growth rate for M3. The text further explained: “To signal the prominent role it has assigned to money, the Governing Council has announced a quantitative reference value for monetary growth as one pillar of the overall stability oriented strategy”. So, some trace of technical monetarism[2] was implicitly present. In 2006, explaining the origin of the “two pillars”, Otmar Issing quoted former President Wim Duisenberg’s reply to a question by a journalist in 1999: “it is not a coincidence that I have used the words that money will play a prominent role. So, if you call it the two pillars, one pillar is thicker than the other is or stronger than the other, but how much I couldn’t tell you”.[3]
The reference value for the monetary aggregate M3 was considered a relevant variable for inflation assessment and was related to the theoretical approach of technical monetarism in that money predicts inflation and differs from credit or other aggregates. The reference value for M3 annual growth was calculated to be 4.5% and was used to produce a monetary overhang: the difference between actual M3 growth and the reference value, with higher numbers representing higher risks for medium term inflation.
The monetary policy framework announcement sparked a lively debate in the academic community, regarding the differences between the ECB approach and the inflation targeting regime.[4] There were criticisms about the ambiguity of having two seemingly different approaches, one close to monetary targeting (the reference value) and another related to a public commitment of a quantified inflation target (less than 2%), an element of utmost importance in an inflation targeting regime.
The sobering experience of the following few years with the framework, determined the need for clarifications and ultimately for a revision of the strategy. Since 2001 the growth of M3 started to accelerate to values well above the 4.5%, registering 10.9% in December 2001 and in December 6.6% in 2002[5]. It thus suggested significant risks for inflation that the behavior of prices did not show, even when considering meaningful lags. In fact, the money demand function became clearly unstable since 2001 and did not justify the use of a concept like the reference value referring to the medium-term of up to two years which is the operational horizon for monetary policy decisions.[6] The continuous need to try to explain away the growing monetary overhang without corresponding inflation in the horizon, was turning into an embarrassing exercise.
Consequently, in May 2003, the ECB published a review of the monetary policy framework including the following elements. First, the medium-term target for inflation was redefined to a value “below but close to 2%”; second, the presentation of the monetary policy decisions would start with the “economic analysis to identify short- to medium-term risks to price stability”; third, the monetary analysis would “mainly serve as a means of cross-checking, from a medium- to long-term perspective, the indications coming from the economic analysis; fourth, the review of the reference value on an annual basis was dropped. While still at 4.5%, the reference value has, in fact, not been mentioned or used since then. The monetary pillar became thinner.
Finally, in June 2004 the ECB started publishing its staff macroeconomic projections for the euro area. In my assessment, the decisions taken in 2003 and 2004 were important steps towards a higher degree of transparency and accountability and made the ECB strategy even more aligned with inflation targeting. I therefore believe that the ECB’s monetary policy strategy can be seen as consistent with the broad features of flexible inflation targeting as described in Svensson (2008). It includes: first, an announced numerical inflation target; second, monetary policy decisions that make the inflation forecast published by the central bank, converge to this numerical target, and third, a high degree of transparency and accountability.[7] Naturally, this does not mean that all central banks do not look at what is happening with monetary aggregates, especially credit, as they have information content. In the same way, central banks also follow general financial conditions. In both cases, however, central banks cannot extract quantitatively precise calibration on what will happen to inflation from those monetary and financial variables.
Second Phase: Monetary policy until the financial crisis (2003-2007)
The period spanning from the revision of the monetary strategy to the beginning of the crisis in 2007 coincided with the build-up of macroeconomic imbalances in several member countries. With hindsight, the ECB has been criticised for not helping prevent that development. I do not agree with such criticism as it ignores that a single monetary policy cannot cater for heterogeneity across member states.
Rates were increased in December 2005 as there was evidence that strong growth was contributing to a rise in inflation above 2%, with a rate of 2.5% in the third quarter of that year. Curiously, the interest rate decision was criticised at the time by a number of commentators[8] and even by some policy institutions. However, the IMF’s economic outlook of April 2005 considered that monetary policy in the euro area “should remain firmly on hold”.[9] A similar recommendation was issued by the OECD in November 2005.[10] With the benefit of hindsight, most observers now agree that the tightening decision in December 2005 was appropriate.
Let me emphasise however, that this conclusion does not imply that monetary policy interest rates are the best tool to respond to financial imbalances with what is called “leaning against the wind” policy. I do not believe that monetary policy should be normally used to prevent the build-up of financial imbalances. The main reason is that, due to the imperfect synchronisation of financial and business cycles, leaning against the wind would pose an intertemporal trade-off in achieving price stability.[11] More precisely, “leaning against the wind” requires intentionally producing deviations from price stability over the short- to medium-term, as a precautionary move against the risk of a future financial crisis. Its benefit would be to help prevent potentially larger deviations from price stability over the medium- to long-term, once the financial crisis occurs. The risks of this approach are to increase the amplitude of business cycle fluctuations and hinder the credibility of the central bank regarding its inflation objective, while only marginally reducing the probability of financial crises.
My conclusion is that the costs of “leaning against the wind” are likely to exceed benefits as I illustrated in a recent intervention applying the methodology developed by Lars Svensson to the euro area.[12] Macroprudential policy should be the main policy tool to respond to the build-up of financial imbalances. In this respect, the fact that monetary policy “gets in all the cracks” of the financial system was seen as an advantage by Jeremy Stein. However, it can easily become a significant inconvenience if it creates an unnecessary recessionary episode or when in a monetary union, a financial instability episode is not generalised across all countries.[13]
Indeed, some influential authors have pointed out that a tightening of monetary policy could, in some cases, even boost the bubbly component of stock prices, or increase house price imbalances through debt deflation effects.[14] This requires strong macroprudential policies to complement monetary policy in order to achieve both price and financial stability.
The Third Phase: Global financial crisis and Great Recession (2008-2013)
The third phase marks an abrupt change in euro area monetary policy. It can be identified as a result of the financial crisis of 2007, and especially its intensification after the bankruptcy of Lehman Brothers in September 2008. However, in July 2008, overreacting to a reading of 4% in headline inflation related to oil price developments we took the controversial decision to increase the policy rate to 4.25%. Following the dramatic effects of the Lehman bankruptcy, rates were subsequently cut three times to a level of 2.5% in December 2008. A broad policy of liquidity provision to the banking sector replacing auctions by the fixed rate full allotment regime was introduced in October and kept until this day.
The operational approach was to calibrate each measure to address the specific market impairment prevailing at that point. For example, liquidity was provided at much longer maturities than usual to help alleviate tensions exacerbating the maturity mismatch on the banking sector’s balance sheet. The list of eligible collateral was also expanded to ease the shortages that emerged during the crisis.
A direct implication of the activity of eased liquidity provision to the market was the increase in the size of the ECB balance sheet. The increase in financial institutions’ demand for ECB liquidity led to a progressive, and sizable, increase in bank reserves. This was accentuated by the effects of the SMP programme under which the ECB boldly intervened since 2010 with purchases of government bonds of countries where monetary policy transmission had been severely impaired as a result of excessive market pressures. Between 2007 and mid-2012, the size of the ECB’s balance sheet more than doubled. Clearly, the larger balance sheet was then not the objective of our non-standard measures, but rather the result of the lender of last resort function to the market. Indeed, as the funding situation in the banking sector started improving in mid-2012, the ECB balance sheet slowly began to contract without any adverse effects.
Some commentators were nevertheless concerned by the increasing size of the ECB balance sheet. Based on the high long-run correlation between inflation and money growth, they interpreted the huge growth in the ECB monetary base as a signal of future high inflation risks. These fears obviously disregarded three things: first, no theory of inflation is directly related with the central bank’s balance sheet; second, the relationship between the monetary base and the broad monetary aggregates is unstable and, in fact, during that period monetary aggregates did not increase in response to the expansion of central bank liquidity; third, that the crisis implied a shock to money demand that totally disrupted any potential relationship between monetary aggregates and inflation. This assessment has been vindicated by subsequent developments. Almost ten years after the initial increase in size of the ECB balance sheet, the problem in the euro area remains one of too low, rather than too high, inflation.
In the opposite direction, concerns were also voiced about the reduction in the ECB’s balance sheet size beginning in 2012 and a possible link to the recession and low inflation period that followed. This view is compounded by the criticism of the two policy rate increases in April and July of 2011, taking it from 1% to 1.5%. This episode and the double dip in growth deserve therefore further comment. Those rate increases came on the wake of developments in the first half 2011, showing economic growth slightly above 2% and with inflation attaining 2.75 % in the second quarter. We were also overly influenced by growth forecasts which turned out to be excessively optimistic. Blanchard and Leigh, who also point out that many other forecasting institutions made recurring errors on euro area growth during this period, make an independent validation of this hypothesis in their 2013 paper.[15] The authors argue that this is due to an underestimation of fiscal multipliers, which in turn led to an underestimation of the contractionary effects of the fiscal consolidation plans announced in early 2010.
With hindsight, it is now clear that increasing interest rates during this phase was premature. The economy weakened markedly after the summer, on the wake of the acute market pressures on the sovereign debt of Spain and Italy that led to a second round of interventions in the sovereign bond markets under the Securities Market Programme (SMP). The two consecutive rate hikes were quickly reversed in November and December of that same year. In view of the long lags of monetary policy effects, it is obvious that the quick succession of increases and reductions of policy rates cannot be responsible for the recessionary episode of that period. What really was responsible for the recession of 2012/2013 was the coordinated fiscal consolidation in which all member states engaged. A working paper published by the European Commission estimated that collective fiscal consolidation led to cumulative deviations from the baseline growth in 2011-2013 from 8% in Germany to 18% in Greece.[16] Another paper finds a loss deviation from baseline between 14% to 20%, for the euro area GDP during the same period.[17]
Monetary policy continued to help the situation when, at the end of 2011, the ECB introduced two three-year longer-term refinancing operations implemented in December 2011 and February 2012 amounting to EUR 1 trillion. This measure and the correction of the two rate hikes contributed to attenuate the severity of the 2012 recession.[18] The announcement of the Outright Monetary Transactions (OMT) programme in 2012 further contributed to preventing an even worse deterioration of economic conditions by removing redenomination risk, which had become an important source of macroeconomic uncertainty. The programme facilitated an ease of tension in all financial markets, which was accompanied by a slow, but progressive return of spreads towards normal levels. Altogether, with the second round of sovereign bond purchases in 2011, the liquidity supplied at end-2011 and the OMT announcement, the ECB put an end to the euro area acute existential crisis.
The Fourth Phase: ultra-low inflation and QE (2014-today)
This brings me to the fourth and current phase of monetary policy in the euro area. In 2013, the euro area recovery had not yet gained traction. In spite of the ultra-low level of interest rates, renewed deflationary risks emerged with a progressive fall of inflation towards levels significantly below 2 percent. In contrast with the previous five years, financial disruptions could no longer be responsible for the economic slowdown. The coincident reduction of output and inflation suggested that the renewed economic weakness was driven by a negative aggregate demand shock. In turn, the negative demand shock could be the delayed result of the fiscal policy tightening since 2010, or possibly the consequence of weakened economic sentiment after two recessions.[19]
Maintaining price stability in the face of insufficient aggregate demand and downward inflationary pressures required a more expansionary monetary policy stance. In response to these developments, a new phase in non-standard measures was launched, including increasing the balance sheet with asset purchases. The new non-standard policies were not merely expected to undo any remaining financial market impairments, but to further ease the monetary policy stance at a point where policy rates had reached their lower bound. In July 2013, in response to the contagion of increased bond yields resulting from the “taper tantrum” in the U.S., the ECB had already introduced the non-standard policy of forward guidance, indicating its intention to keep interest rates at prevailing or lower levels “for an extended period of time”. As inflation continued to decelerate from October 2013, falling under 1%, a comprehensive package of expansionary measures[20] was announced in June 2014 including: a cut in policy rates and a negative deposit facility rate; two asset purchase programmes for asset backed securities (ABS) and covered bonds (CBPP), and a facility to provide longer-term funding to banks for new loans, contingent on bank credit supply behaviour, which we refer to as targeted longer-term refinancing operations (TLTRO). In January 2015, the large-scale asset purchase programme (APP) was extended to include purchases of sovereign bonds.
A growing number of studies about the impact of APP suggest that the programme was effective in lowering spreads on long-maturity assets and thereby boosting inflation and growth.[21] These studies also highlight that the APP announcement contributed to a re-anchoring of inflation expectations by reversing their previously observed decline. From a simpler perspective, we can state today that three years of large-scale asset purchases have eliminated the risk of prolonged deflation. This fact is incontrovertible and should be admitted by both the early APP critics and those who claimed it was unnecessary.[22] Nevertheless, we should remain aware that the precise channels of transmission of Quantitative Easing (QE) are still imperfectly understood and they do not relate to technical monetarism. I think that making progress in our theoretical understanding of QE remains an important research priority for central banks, especially in view of the possibility that nominal interest rate will be more persistently low in the future, and thus that the effective lower bound constraint will be hit more frequently.
A particular aspect of QE programmes that needs to be investigated further regards its distributional effects. As an instrument of monetary policy accommodation, the APP led to an increase in economic activity, which was especially beneficial for those individuals who, as a result, found a job after being unemployed. At the same time, the APP increased the value of financial assets and thus led to capital gains for the holders of those assets. Improving our understanding of the relative strength of these distributional effects is also an important priority for central banks. Ongoing work at the ECB suggests that the decline in unemployment that followed the introduction of the APP had a disproportionately positive impact on low-income households.[23] The net overall impact of APP has therefore reduced income inequality. Furthermore, as a result of housing price increases associated with the economic recovery, the same positive outcome took place with respect to wealth distribution.
Implications for the future
The ECB journey that I have recalled here can give rise to two obvious questions. The first one relates to economic analysis: were the mainstream macroeconomic models used before the crisis appropriate to help guide policy decisions, or should these be changed? The second question relates to the monetary policy strategy: should lessons’ learnt in the journey be reflected in a change of central banks’ monetary policy strategies?
Implications for macroeconomics and monetary theory
Let me start with the first question. The shortcoming of mainstream macroeconomics and of the type of Dynamic Stochastic General Equilibrium (DSGE) models that prevailed before the crisis, are by now quite well known.[24]
Besides extending DSGE models to include macro-financial linkages, the ECB decided to develop a new Multi-Country model starting from the premise that, in the words of Olivier Blanchard, “policy models” cannot be expected to have the same tight structure as “theory models”.[25] A semi-structural approach along the lines of the Federal Reserve’s FRB/US model has been adopted.[26] We can therefore put more emphasis on the model’s ability to provide sound quantitative predictions. When introducing financial frictions, we have relied on a reduced form representation that is consistent with different theoretical micro-foundations. This more flexible, semi-structural approach allows us to model a wide range of banking and financial variables, going from bank lending spreads to term premia, without taking a stance on the theoretical fundamental debate about how they are linked to the macroeconomy.[27]
A crucial theoretical aspect which requires improvement is related to the Phillips curve, the most commonly used empirical model of inflation that faces several estimation problems as it uses several unobservable variables.[28] It started as a relationship between wage growth and unemployment and later, prices or inflation substituted wages. In 1967-8, Phelps and Friedman introduced expectations as a variable that shifted the previously considered stable relationship. Jointly with this change, Friedman added the concept of a fixed Natural Rate of Unemployment (NARU), determined only by supply factors, to which the economy would tend in the long-term. The difference between actual unemployment and this long-term unemployment rate became the variable used as proxy for demand pressure in the market of goods and services, seen as the main theoretical cause of inflation. Inflation was an excess demand phenomenon and demand could be controlled by monetary policy — via monetary aggregates for Friedman or with interest rates, as believed today. In practice, estimates of a Non-Accelerating Inflation Rate (NAIRU) are what is obtained instead of the unobservable long-term NARU, which are doubtfully deemed to be the same.
In the late 1970s, two different research approaches emerged, thus characterised by Robert Gordon[29]: “The left fork in the road,… is the resurrection of Keynesian economics in the form of a …. Phillips Curve (PC) model that incorporates long-run neutrality and an explicit role of supply shocks in shifting the Phillips Curve up or down, together with an interpretation of the influence of past inflation as reflecting generalized inertia rather than expected inflation. The right fork in the road of the post-1975 evolution, features an approach developed by Kydland, Prescott and Sargent, and more recently by Galì and Gertler and others. Inflation depends on forward-looking expectations, and expectations respond rationally to actual and expected changes in monetary and fiscal policy. This two-way game has no room for supply shocks or inertia”. This second approach produces what is called the New Keynesian Phillips Curve (NKPC) that basically focuses on the output gap and expectations and is a crucial part of the DSGE models, where the interest rate is all-powerful to control demand and therefore inflation.
Gordon and others forged ahead with the first approach, adding variables representing supply shocks (as prices depend on demand and supply factors), inertia represented by long lags of inflation and a time-varying NAIRU determined by a simple stochastic process. To this day, using this so-called “triangle approach”, Gordon continues to obtain very good results in predicting inflation out-of-sample[30]. In 2013, Gordon shows that his model “can estimate coefficients up to 1996 and then in a 16-year-long dynamic simulation, with no information on the actual values of lagged inflation, predict the 2013 value of inflation to within 0.5 percentage point. The slope of the PC relationship between inflation and the unemployment gap does not decline by half or more as in the recent literature, but instead is stable.”
This last aspect is particularly important as it highlights one of the puzzles found in the second approach of the NKPC, since Roberts[31] obtained the result of a 50% decline in the slope coefficient for the U.S. in 2006. As is to be expected, the value of that coefficient depends on the entire specification of the regression. When it does not use supply-side variables, assumes inflation lags with coefficients that add to 1, and a constant NAIRU, as in the NKPC specified by Roberts, it is natural that the low inflation environment of the period shows up in a declining slope coefficient.
The problem is that the NKPC did not perform empirically well from the start. Many ad-hoc remedies have been tried in order to make it work, even when they did not conform to the pure theoretical paradigm of the model. First, lags of inflation were introduced by Galì and Gertler (1999) to create the so-called hybrid NKPC.[32] This hybrid model has faced many difficulties in predicting inflation with acceptable accuracy, even when embedded in DSGE models. As I mentioned in another intervention[33]: “As King and Watson (2012)[34] highlight when using the labour income share or unit labour costs the models do not capture that the last 15 years do not show a co-movement of inflation with the significant decline of those ULCs”. Gürkaynak, Kisacikoglu and Rossi (2013)[35] also illustrate the subpar performance of DSGE models to forecast inflation. In their encompassing survey, Mavroeidis, Plagborg-Møller and J. Stock (2014)[36], also conclude that, “we are unable to pin down the role of expectations in the inflation process sufficiently accurately for the results to be useful for policy analysis”.
Many other transformations have been attempted to make variants of the hybrid model perform better. One way is to focus on core inflation on which the missing supply factors may be less important. Another approach is to take expectations from consumer surveys or professional forecasters, which of course are not microfounded.[37] In some estimates, the price of oil or the full price of imports is introduced as an ad-hoc element within the paradigm. Time-varying coefficients and NAIRUs are also used. So, pragmatically adjusted, hybrid NKPCs can be made to work, especially for core inflation. This specification is quite distant from the initial pretensions of the NKPC and from rationale of DSGE models where everything is microfounded and subject to rational expectations. The two strands of the literature identified by Robert Gordon seem to have undertaken some convergence.
An important source of the Phillips curve’s poor performance can be the mis-measurement of the output gap and the NAIRU. An important part of the under-prediction of inflation in recent years may be the result of an underestimation of the slack in the economy. This is illustrated by the fact that we better predictions of inflation can be obtained when the broad concept of unemployment is used (e.g. U6, which is at 16% for euro area) instead of the usual measure of unemployment (standing at 8%). Usual measures of slack can vary substantially across methods and chosen variables, although they tend to agree on the timing of peaks and troughs.
The fact that economic activity is multidimensional suggests that there might be advantages in using large dynamic models to estimate it. For instance, ECB staff used a dynamic factor model that performs a trend/cycle decomposition of real activity variables and core inflation.[38] Using different sets of variables and trend assumptions, they get different measures of the output gap. One way to discriminate among different estimates of the output gap is to check their ability to forecast inflation. It turns out that the variants associated with a continuation of a positive growth trend, implying a wider output gap, are the ones that produce better inflation forecasts. The best variant from this perspective implies that the output gap was as large as -6% in 2014 and 2015, on average, an estimate which is considerably more negative than most official estimates, hovering between -2 and -3% for those years.[39] Results for 2017 still continue to show a quite meaningful negative output gap, instead of one already close to zero as reported by several international institutions. This points to the great uncertainty behind the estimation of the output gap, the same being true about the concept of an unemployment gap more directly involving the NAIRU.
In any case, what matters is that it is possible to find specifications that can be used as fairly good inflation forecasting tools. Either NKPC or Traditional Keynesian Phillips Curves (TKPC) can achieve that. For instance, in their estimations of the Non-Accelerating Wage Rate of Unemployment (NAWRU), the European Commission has used the NKPC for 21 countries and the TKPC for 7 countries.[40]
In recent ECB work about understanding the low inflation environment, a variant of the hybrid NKPC for core inflation was used but with the inclusion of import prices, lagged inflation and expectations taken from surveys.[41] Using that pragmatic specification, acceptable forecasting results are obtained and we find that the slope has been increasing in recent years. This is a source of confidence that our policy, having contributed to the recovery, will in the end contribute to achieve our inflation goal.
Another question related to the PC, beyond the forecast of inflation, refers to the interpretation and use of the NAIRU that can be extracted from it. It is common to see it as equivalent to the Friedman’s NARU, a long-term structural rate of unemployment totally dependent on supply-side factors like demography, technology, institutions that shape market rules, etc. This view then endorses the use of estimated NAIRUs for several policy decisions: for instance, using that particular value as a measure of structural unemployment that enters into the calculation of potential output and the structural budget deficit with all its implication for fiscal policy. Trusting just one number to conduct policy can be dangerous. In their seminal paper, Staiger, Stock and Watson (1997) estimated standard deviations for the NAIRU and concluded that these were very large.[42] The standard deviations are not usually calculated and/or disclosed in estimates of NAIRU but we can rely that they are normally quite large. This recommends caution in using NAIRU estimates for strict policy decisions.
A second aspect to underline is that it is difficult to accept that estimated NAIRUs are long-term constants determined exclusively by supply-side factors. This would correspond to the natural rate hypothesis (NRH) put forward by Friedman. This view of separating trend from cycle or supply from demand shocks has repeatedly been challenged, for example in the hysteresis hypothesis proposed by Blanchard and Summers.[43] Recently, Blanchard even questioned whether the NRH should be rejected which in the end he refrains from doing while instilling a high degree of doubt and caution in its use. The main argument behind hysteresis is that there are various transmission channels that may induce a long-lasting impact of economic fluctuations due to aggregate demand. Unfortunately, it is very difficult to detect this hypothesis on empirical grounds from an aggregate economic viewpoint. However, some micro-evidence appears to support it, such as the decreased employability of long-term unemployed, as they lose skill and morale, or the decline in R&D activities and investment of firms during recessions.
One change in the NARU long-term assumption is to accept that it changes over time, albeit slowly and indeed much more sluggish than what is normally used in estimates of NAIRU that even show yearly changes. About these time-varying NARUs and NAIRUs, Farmer refuses the whole concept[44]: “Defenders of the Natural Rate Hypothesis might choose to respond to these empirical findings by arguing that the natural rate of unemployment is time varying. But I am unaware of any theory which provides us, in advance, with an explanation of how the natural rate of unemployment varies over time. In the absence of such a theory the NRH has no predictive content. A theory like this, which cannot be falsified by any set of observations, is closer to religion than science.” In the same vein, Solow once quipped “a natural rate that wanders permanently is not natural, is epiphenomenal”.
The major point behind the previous discussion is that estimated NAIRUs are not good proxies of structural unemployment. Already in 1998, Estrella and Mishkin[45] showed that the NAIRU use in monetary policy “… depends critically on redefining NAIRU as a short-term concept and distinguishing it from a long-term concept like the natural rate of unemployment…something that is not typically done in the literature. Furthermore, …the view that the NAIRU concept implies that the monetary authorities should try to move the economy towards the NAIRU, thus to some treating it as a target, is both incorrect and misguided”. Indeed, the casual identification of the NAIRU with the level of long-term structural unemployment has pernicious consequences, either in using to calculate potential output or the structural budget deficit. Being a short term concept, the NAIRU estimates since 2007, for instance, seem, to a large extent, to be driven by macro-economic developments rather than by shifts in structural labour market characteristics. ECB staff have recently replicated and updated an earlier study of the European Commission (EC) to illustrate this point. The study relates the European Commission’ s NAIRU estimates to four structural labour market indicators (unemployment benefits, replacement rates, labour tax wedges, union density, and active labour market policies) and three macro-economic indicators (total factor productivity growth, the share of construction in GDP and the real interest rate).[46] As shown in the chart, the structural indicators explain only a small fraction of the changes in NAIRU, whereas the macro-economic indicators appear to explain the bulk of its variation. Another paper, reaching the same conclusion and using a broader set of variables is Heimberger et al.
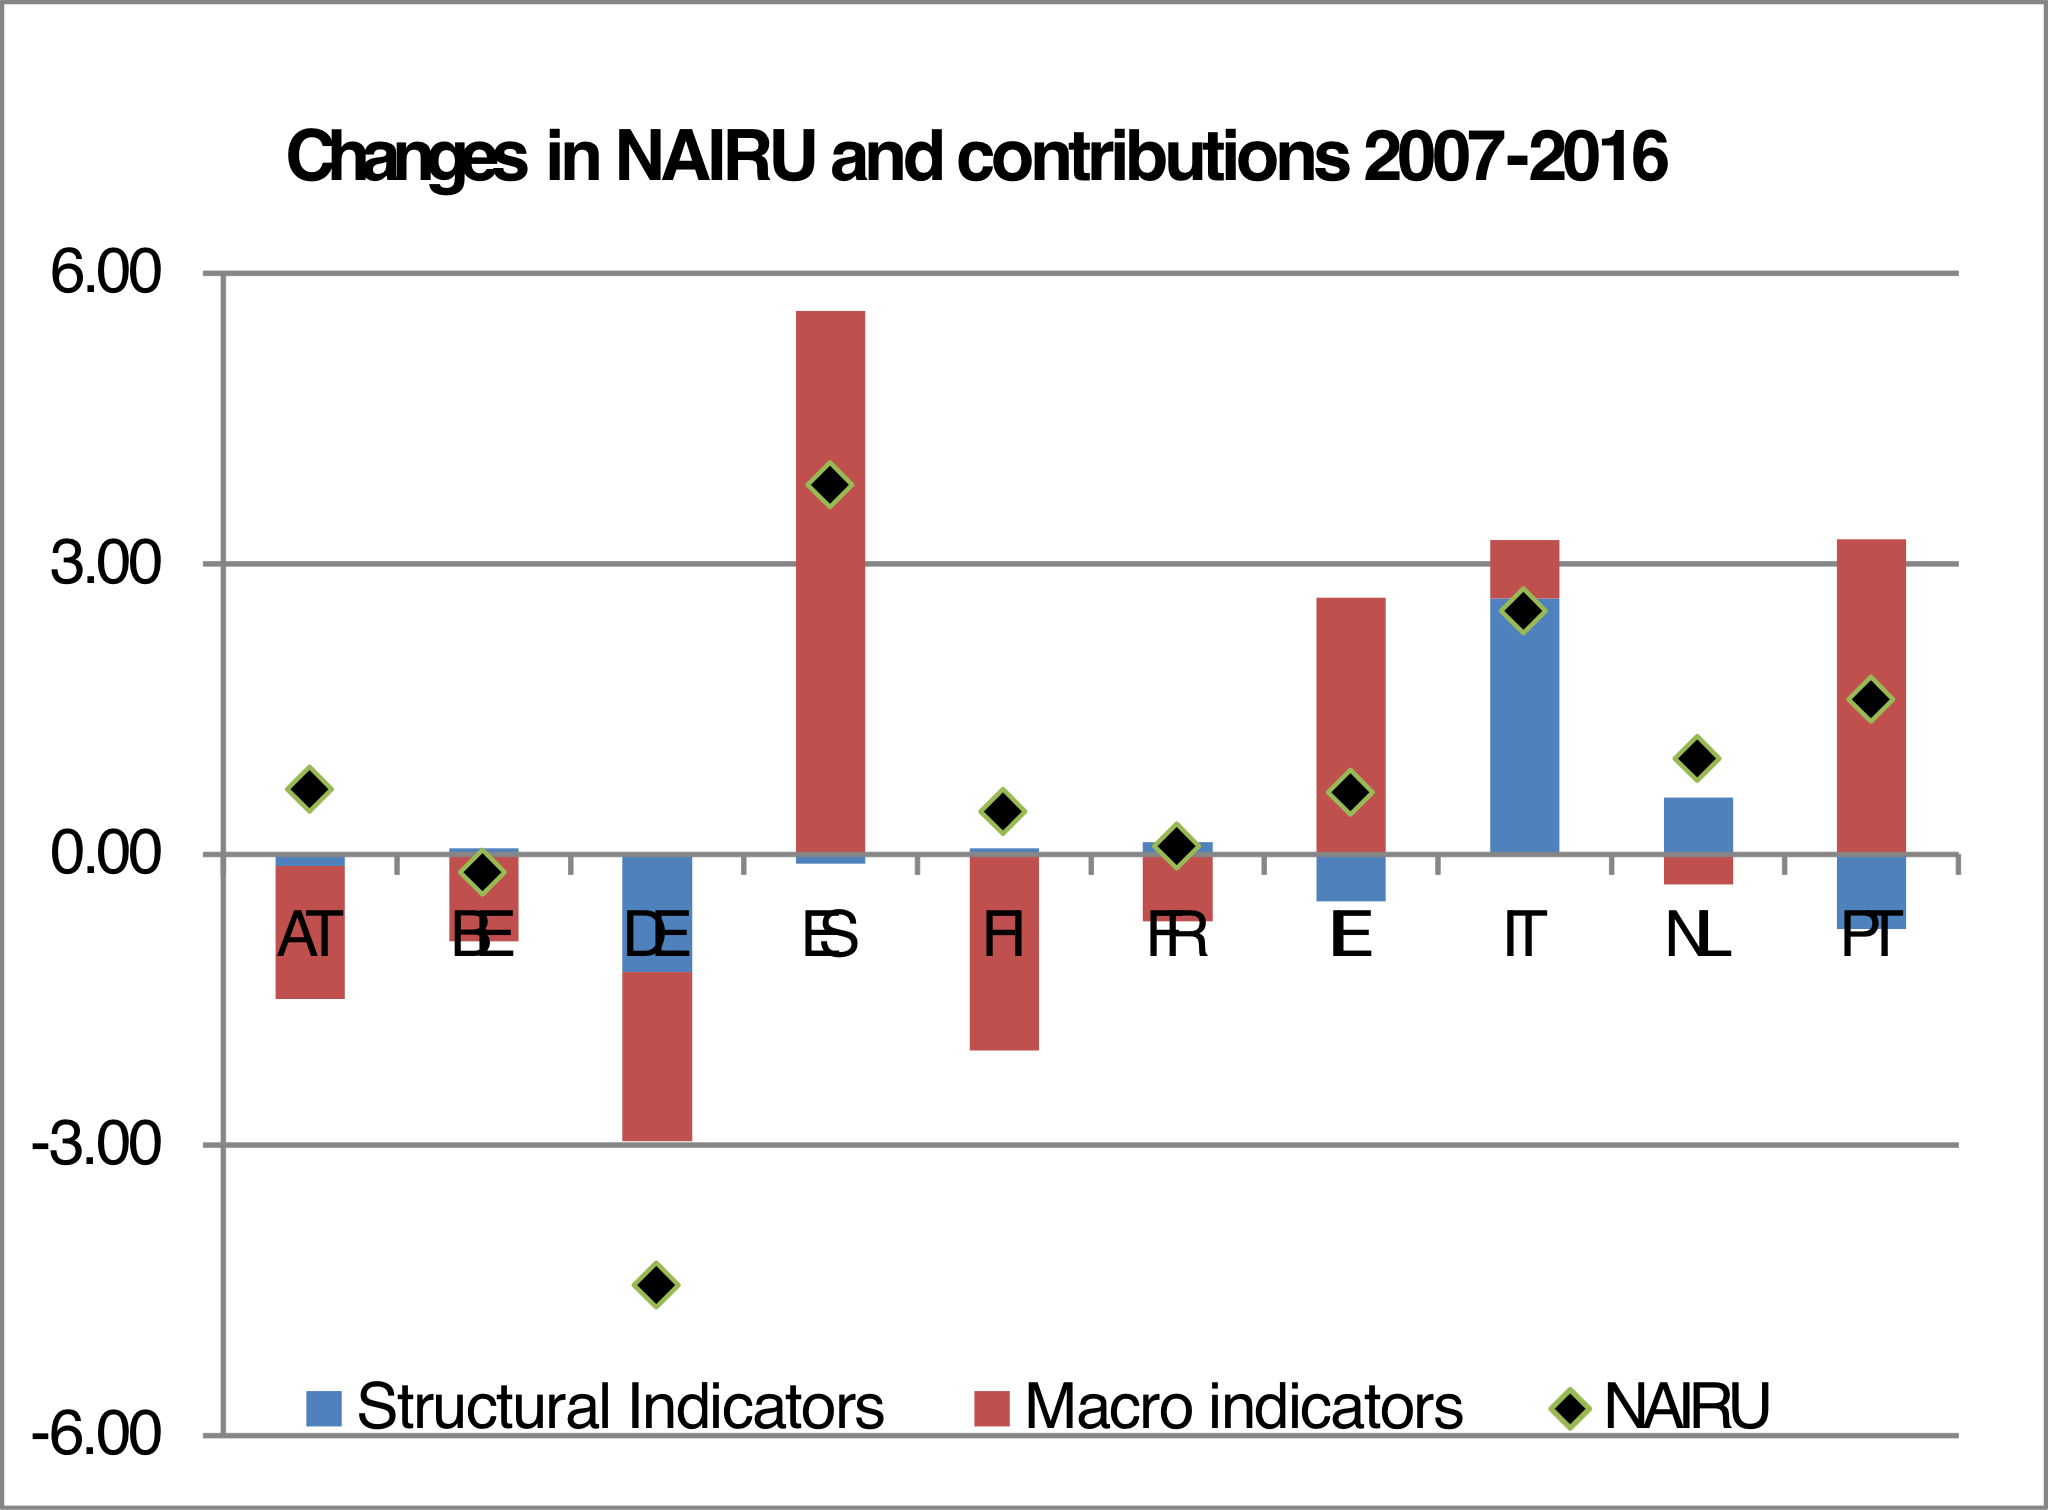
Overall, this evidence suggests that the shifts in unemployment rates observed since 2007 were mostly triggered by the macro-economic cycle and not by an increase of structural unemployment as allegedly indicated by very high NAIRU levels. This means that the estimated NAIRU from Phillips curves is not a good representation of structural unemployment.
Confirming this, an Economic Paper published by the European Commission uses a concept of Structural Unemployment Rate (SUR) to substitute the NAWRU[47] in the calculation of the structural budget deficit. A subsequent Discussion Paper integrated the concept of SUR as a sort of anchor in the estimation of NAWRUs, that are therefore less pro- cyclical and less sensitive to data corrections.[48] These analyses produce meaningful changes on fiscal policy stance indicators when compared with the previous straight estimates of NAWRUs.
In view of all the uncertainty, policy-makers should seriously consider the possibility of dropping the NRH as a long-term stable concept that can be estimated from Phillips curves and used in policy decisions. This does not imply abandoning the idea behind the Phillips curve as a pure forecasting device with a positive slope coefficient indicating that strong growth of aggregate demand, given time, will increase inflation. What should be refused is the idea that there is a unique identifiable level of unemployment, corresponding to a level of stable structural unemployment, above which expansionary macro policy exclusively accelerates inflation.
Monetary Policy Strategy in The Future
While our quest for better analytical tools continues, a broader question concerns whether there is a need to also change central banks’ monetary policy strategies. Many commentators have started discussing whether these should undergo a more complete overhaul, rather than eventually returning to the pre‐crisis status quo.[49]
I think that the position to take in this debate hinges on the assessment of the recent experience with non-standard monetary policy measures. If non-standard measures were considered to be ineffective, then interest rates would really be the only available tool to achieve price stability. In other words, we would conclude that, once interest rates reach their effective lower bound, central banks are, de facto, powerless. The inconvenient truth behind that view is that it would crucially require reducing to literally zero the likelihood of hitting the effective lower bound ever again in the future.
A substantial overhaul of current strategies would in the end be necessary. Options that have been proposed in this context include the abolition of cash, to eliminate the arbitrage opportunity which prevents policy rates from going negative, and a higher inflation target to reduce the likelihood of hitting the lower bound even after large, adverse shocks.[50] In my view, on the issue of the abolishment of cash, “a prudent policy-maker would advise to be very cautious before proceeding with this radical proposal, even if digitalisation may gain ground and finally prevail – as we start to observe in some countries”.[51]
Regarding proposals to increase inflation targets, I think they are in general problematic, in view of the difficulties of managing the transition without losing credibility. Notwithstanding this, I would have no theoretical objections to a mild correction as proposed by many economists. My reaction is similar to what Janet Yellen replied in June 2017 to a question about the letter to the Federal Reserve signed by 22 prominent American economists[52] in favour of increasing the inflation target: “…this is one of our most critical decisions and one we are attentive to evidence and outside thinking. It's one that we will be reconsidering at some future time. … It needs to be a balanced assessment. But I would say that this is one of the most important questions facing monetary policy around the world in the future. And we very much look forward to seeing research by economists that will help inform our future decisions on this."
An interesting alternative proposal has recently been made by Bernanke, the former chairman of the Federal Reserve.[53] In a nutshell, the idea is to switch to a temporary price level target during episodes in which the interest rates effective lower bound is binding. Under a price level target, the central bank aims to stabilise the price level, rather than inflation, and it therefore ensures that any low-inflation episode is compensated by a period of relatively high inflation.[54] Outside the zero lower bound, the central bank would continue to target a standard inflation objective. The main advantage of this proposal is that it clearly communicates the horizon over which a period of inflation below trend would have to be compensated. Relative to other proposals, the fact that for most of the time, the central bank would continue to target the inflation rate also facilitates communication with the public. Nevertheless, I am not sure whether the practical difficulties of implementing the policy would prevent markets and the public from fully understanding it, which may make the proposal an unrealistic option to be adopted by a central bank in the future.
I have a positive assessment of the experience with non-standard measures, from large scale open market operations of asset purchases to negative rates, and I am glad that they now permanently belong to the ECB’s toolkit of instruments to address particular stressful situations. Even outside those special conditions, it is somewhat doubtful that monetary policy can remain effective just by going back to the traditional approach of very small central bank balance sheets and the targeting of overnight money market rates, for a number of reasons.
First, the importance of banks in funding non-financial firms has declined everywhere, including in the euro area. There has been a dramatic change, as non-bank financing sources have become much more important since the onset of the financial crisis. Total assets of investment funds in percentage of total bank assets increased from 16% in 2007 to 44% last year. The percentage of bank loans in the total stock of firms’ external financing in 2017 was just above 12% (or 15%, if intra-company loans and trade credit are excluded from total external financing). For the same year, if only the stock of debt instruments is considered (excluding equity sources), bank loans represented only 28% of total debt financing (or 45%, if net of intra-sectoral financing). Before the crisis, back in 2007, bank loans represented 37% of total debt financing (or 60%, if net of intra-sectoral financing).[55]
Second, other structural changes in the financial system are also important in this context: the increased role of secured money market transactions; the importance of a broad set of market rates beyond the overnight rate, in view of imperfections in arbitrage; the growing relevance of market-based finance; and finally, the scarcity of safe assets that affects the functioning of markets and the management of collateral.
These developments are behind proposals to keep central bank’s balance sheet with significant size to allow the use of a programme like the Fed’s reverse repo programme (RRP) where its stock of government securities is available for repo operations against cash.[56] The programme would be used to involve more counterparties and affect several interest rates, thereby contributing to a better transmission of monetary policy, in view of the limits to arbitrage hampering the pass-through from short- to long-term interest rates. Recent internal work at the ECB also detects similar pass-through imperfections in European markets. Furthermore, by keeping a significant balance sheet, albeit much smaller than the present levels creates short-term safe assets. This would foster financial stability: the unsuccessful attempts by the financial system to engineer “safer” private assets, as we saw before the crisis would be unnecessary.
Both arguments deserve careful consideration for the design of future monetary policy after the present normalisation phase. Maintaining a much smaller but still significant balance sheet may be necessary to allow targeting a broader set of interest rates. Another related dimension refers to central bank counterparties. Central banks have traditionally granted access to monetary policy operations exclusively to credit institutions. Nevertheless, non-banks are beginning to play a greater role in the European financial landscape, and are likely to take an even greater role as the capital markets union deepens and broadens financial markets in Europe. Such a consideration is not neutral for market rates in the euro area. Secured money market rates, when backed by high quality collateral, have traded several times below the ECB deposit facility rate, which normally sets a floor for short-term money market rates. In part, this discount is explained by non-banks’ activities that – not having access to central bank facilities – are accepting interest rates below the deposit facility rate in their repo activity. The discount is, of course, also attributed to the APP which has reduced the availability of high quality collateral at the same time as market demand for that collateral has increased. Nonetheless, understanding these drivers is crucial for the central bank when making decisions about future counterparty eligibility and the choice of money market rates to target to ensure an effective monetary policy transmission.
These are, however, questions for the long-term future of monetary policy. At present, we have started a very cautious withdrawal of monetary accommodation. The caution is justified by the subdued inflation dynamics since the second half of 2017 and the recent levels of headline inflation: 1.4 % in March, following 1.1% in February, with underlying inflation at just 1%. The ongoing robust recovery that the euro zone is experiencing is a source of optimism for the immediate future. The euro area is much more resilient to possible external financial shocks.[57] Yet, a great deal still remains to be achieved. The euro area is a highly integrated economic and financial area which needs to be managed through common decisions. However, it lacks powerful instruments in domains other than monetary policy, ranging from private risk sharing in a true capital markets union with a European safe asset, to a strong centralised fiscal stabilisation function to deal with asymmetric and symmetric shocks.
The creation of such instruments would also ensure that the fiscal policy mistakes made in 2011-12 would not be repeated so that we do not suffer from avoidable double dip recessions. Over the business cycle, we also need co-ordinated fiscal policies to ensure that the overall fiscal policy stance is sufficiently countercyclical, thereby contributing to economic stabilisation. Until now, the burden of countercyclical stabilisation has been mainly left to monetary policy. This situation is not sustainable, particularly in the context of a recessionary episode that should come at some point. Monetary policy will certainly require the help of strong fiscal policy that will then need to be in place. Governments need to act now and take advantage of the ongoing recovery to make the necessary institutional adjustments.
Conclusion
Let me conclude.
In my remarks today, I have reviewed the different phases of monetary policy since the introduction of the euro and have described how the financial crisis has affected the conduct of monetary policy. Like in other jurisdictions, the deployment of large scale asset purchase programmes is the most relevant change observed since the financial crisis. These new unconventional instruments, along with forward guidance, negative rates and reverse repos belong now to the monetary policy toolkit to be used whenever necessary. From now on, the ECB will have no excuse not to fulfil its mandate, either in fighting against deflation or in addressing the impairment of the single monetary policy transmission by intervening in the sovereign bond market. The ECB made the journey from a central bank still under the partial influence of the simple monetary aggregates approach, to join the community of central banks of other major jurisdictions using flexible inflation targeting regimes and asset purchases as non-standard measures. It is therefore prepared to continue to deliver on the priority of price stability for euro area citizens, while contributing to favourable growth conditions and financial stability in a world in which market-based finance is ever more complex and dominant. In sum, the ECB is now a modern, effective and prepared central bank to serve the goals of monetary union.
REFERENCES
Altavilla, C., G. Carboni and R. Motto (2015), “Asset purchase programmes and financial markets: lessons from the euro area”, ECB Working Paper 1864.
Alves, N. and C.R. Marques (2004), “Money in the ECB’s monetary policy strategy: a reassessment”, Banco de Portugal, mimeo, December 2004, later published as Banco de Portugal Working Paper No. 20/2007 “Is the euro area M3 abandoning us?“.
Bernanke, B. (2017), “Monetary Policy in a New Era”, conference on Rethinking Macroeconomic Policy, Peterson Institute for International Economics, 12-13 October 2017.
Beyer, A. and R. Farmer (2002), “Natural rate doubts”, ECB Working Paper 121.
Blanchard, O. and L. Summers (1986), “Hysteresis and the European Unemployment Problem”, NBER Macroeconomics Annual, Vol. 1.
Blanchard, O., G. Dell’Ariccia and P. Mauro (2010), “Rethinking Macroeconomic Policy”, Journal of Money, Credit and Banking, 42:199–215 and
Blanchard, O. and D. Leigh (2013), "Growth Forecast Errors and Fiscal Multipliers", American Economic Review, 103(3): 117-20.
Blanchard, O., E. Cerutti and L. Summers (2015), “Inflation and activity − two explorations and their monetary policy implications”, ECB Forum on Central Banking on Inflation and Unemployment in Europe, Sintra 2015.
Blanchard, O. (2017), “The Need for Different Classes of Macroeconomic Models”, Peterson Institute for International Economics Real Time Economic Issues Watch, 12 January 2017.
Blanchard, O. (2017), “Should we reject the natural rate hypothesis?”, Peterson Institute for International Economics Working Paper 17/14.
Brayton, F. and P. A. Tinsley (1996), "A guide to FRB/US: a macroeconomic model of the United States", Finance and Economics Discussion Series 96-42, Board of Governors of the Federal Reserve System.
Breckenfelder J., F. De Fiore, P. Andrade, P. Karadi and O. Tristani (2016), "The ECB's asset purchase programme: an early assessment", ECB Working Paper Series 1956.
Ciccarelli, M and C. Osbat (ed) (2017), “Low inflation in the euro area: Causes and consequences“, ECB Occasional Paper 181.
Coibion, O. and Y. Gorodnichenko, (2015), “Is the Phillips Curve Alive and Well after All? Inflation Expectations and the Missing Disinflation”, American Economic Journal: Macroeconomics, 7(1):197-232.
Constâncio, V. (2014), “A new phase of the ECB’s monetary policy”, speech at the ECB workshop on non-standard monetary policy measures, Frankfurt 6 October 2014.
Constâncio, V. (2015), “Understanding Inflation Dynamics and Monetary Policy,” panel remarks at the Annual Economic Policy Symposium, Federal Reserve Bank of Kansas City.
Constâncio, V. (2016), “Challenges for future monetary policy frameworks: A European perspective”, speech at the 19th Annual International Banking Conference “Achieving Financial Stability: Challenges to Prudential Regulation”, Federal Reserve Bank of Chicago, 4 November 2016.
Constâncio, V (2017), “The future of monetary policy frameworks”, lecture at the Instituto Superior de Economia e Gestão, Lisbon.
Constâncio, V. (2017), “Inequality and macroeconomic policies”, speech at the Annual Congress of the European Economic Association, Lisbon 22 August 2017.
Constâncio, V. (2017), “Growth, adjustment and resilience in the euro area”, at the Forum Villa d’Este, Cernobbio, 2 September 2017.
Constâncio, V. (2017), “Developing models for policy analysis in central banks”, speech at the Annual Research Conference, Frankfurt am Main 25-26 September 2017.
Constâncio, V. (2018), “Financial stability risks and macroprudential policy in the euro area”, speech at the ECB and Its Watchers XIX Conference, Frankfurt am Main, 14 March 2018.
Constâncio, V. (2018) Presentation of ECB Annual Report 2017 to the Committee on Economic and Monetary Affairs of the European Parliament, Brussels, 9 April 2018.
De Grauwe, P. (2005), “Monetarists cry wolf on eurozone inflation”, Opinion, Financial Times.
Duffie D. and A. Krishnamurthy (2016), “Pass-through efficiency in the FED’s new monetary policy setting”, presented at the Annual Economic Policy Symposium, Federal Reserve Bank of Kansas City;
ECB (2011), “The monetary policy of the ECB”, third edition, May.
EMI (1997) “The single monetary policy in stage three: elements of the monetary policy strategy”.
Estrella, A. and F. Mishkin (1998), “Rethinking the role of NAIRU in Monetary policy: the implications of model formulation and uncertainty”, Federal Reserve Bank of New York.
European Commission (2014), “The production function methodology for calculating potential growth rates & output gaps”, Economic Papers 535, page 7.
European Commission (2015), “Structural unemployment vs. NAWRU: implications for the assessment of the cyclical position and the fiscal stance”, Economic Papers 552.
European Commission (2017), “NAWRU estimation using structural labour Market indicators” Discussion Paper 069.
Farmer, R. (2013), “The Natural Rate Hypothesis: An idea past its sell-by date”, NBER Working Paper No. 19267 and Bank of England Quarterly Bulletin, September Q3, pp 244-256, 2013;
Galì, J. and M. Gertler (1999), “Inflation dynamics: a structural econometric analysis”, Journal of Monetary Economics. 44:195-222;
Galì, J., M. Gertler and D. López-Salido (2005), “Robustness of the estimates of the hybrid new Keynesian Phillips Curve", Journal of Monetary Economics, 52:1107-18.
Gaspar, V., F. Smets and D. Vestin (2007), “Is the time ripe for price level path stability?”, ECB Working Paper 818;
Galì, J. and L. Gambetti (2015), “The Effects of Monetary Policy on Stock Market Bubbles: Some Evidence”, American Economic Journal: Macroeconomics 2015, 7(1): 233–257.
Gerlach, S. and L. E.O. Svensson (2000), “Money and Inflation in the Euro Area: A Case for Monetary Indicators?”, NBER Working Paper No. 8025, published later in the Journal of Monetary Economics 50 (2003) 1649-1672.
Gordon, R. (2009), “The history of the Phillips Curve: consensus and bifurcation”, Economica 78(309):10-50.
Gordon, R. (2013), “The Phillips curve is alive and well: inflation and the NAIRU during the slow recovery”, NBER Working Paper 19390.
Greenwood R., S. Hanson, and J. Stein (2016), “The Federal Reserve's Balance Sheet as a Financial-Stability Tool”, 2016 Economic Policy Symposium Proceedings, Jackson Hole: Federal Reserve Bank of Kansas City.
Gürkaynak, R.S., B. Kisacikoglu, and B. Rossi (2013), “Do DSGE Models Forecast More Accurately Out-of-Sample than VAR Models?”, CEPR Discussion Paper, July 2013.
Heimberger, P., J. Kapeller, and B. Schütz (2016), ““What’s ‘structural’ about unemployment in Europe: on the determinants of the European Commission’s NAIRU estimates”, ICAE, University of Linz, Working Paper No 47.
IMF World Economic Outlook, April 2005.
Issing, O. (2006), “The ECB’s Monetary Policy Strategy: Why did we choose a two Pillar Approach?”, contribution to the 4th ECB Central Banking Conference, Frankfurt, November.
Jarociński M. and M. Lenza (2016), “An inflation-predicting measure of the output gap in the euro area”, ECB Working Paper 1966, forthcoming article in the Journal of Money, Credit and Banking.
Jasova M., C. Mendicino and D. Supera (2018), "Rollover Risk and Bank Lending Behavior: Evidence from Unconventional Central Bank Liquidity", mimeo.
King, R. and M.W. Watson (2012), “Inflation and unit labour costs”, Journal of Money, Credit and Banking, 44(s2):11-149.
Krugman, P. (2014), “Inflation targets reconsidered”, ECB Forum on Central Banking, May 2014.
Lenza, M. and J. Slacalek (2017), "The effects of unconventional monetary policy on inequality in the euro area", mimeo, European Central Bank.
Lorenzoni, G. (2009), “A Theory of Demand Shocks”, American Economic Review, 99: 2050–84 as an example of models in which a drop in consumer sentiment can lead to demand shocks.
Mavroeidis, S., M. Plagborg-Møller and J. Stock (2014), “Empirical Evidence on Inflation Expectations in the New Keynesian Phillips Curve”, Journal of Economic Literature 52(1):124-188, March 2014.
OECD Economic Outlook, Vol 2005, issue 2.
Orlandi, F. (2012), “Structural Employment and its Determinants in EU Countries”, European Commission Economic Papers 455.
Quint, D. and O. Tristani (2017), “Liquidity provision as a monetary policy tool: The ECB’s non-standard measures after the financial crisis”, Journal of International Money and Finance, 80:15-34.
Rannenberg, A., C. Schoder and J. Strasky, (2015), “The macroeconomic effects of the European Monetary Union’s fiscal consolidation from 2011 to 2013: a quantitative assessment”, IMK Working Paper 156.
Roberts, J.M. (2006), “Monetary Policy and inflation dynamics”, International Journal of Central Banking 2:193-230.
Rünstler, G. and M. Vlekke (2018), “Business, Housing and Credit Cycles”, Journal of Applied Econometrics, 33(2):212-226.
Schmidt, S. (2011), “The cost channel, indeterminacy, and price-level versus inflation stabilization”, The B.E. Journal of Macroeconomics, 11(1).
Schüler, Y., P. Hiebert and I. Jaccard (2017), “Contrasting financial and business cycles: Stylized facts and candidate explanations”, mimeo Bundesbank and ECB.
Staiger, D., J.H. Stock, and M.W. Watson (1997), “The NAIRU, unemployment and monetary policy” Journal of Economic Perspectives 11:33-49.
Stark, J., “The Irresponsible ECB”.
Stein, J. (2013), “Overheating in Credit Markets: Origins, Measurement, and Policy Responses”, speech at the "Restoring Household Financial Stability after the Great Recession: Why Household Balance Sheets Matter" research symposium sponsored by the Federal Reserve Bank of St. Louis.
Svensson, L.E.O. (1999), “Price-Level Targeting versus Inflation Targeting: A Free Lunch?”, Journal of Money, Credit and Banking, 31(3):277-295.
Svensson, L.E.O. (2008), “Inflation targeting”, in The New Palgrave Dictionary of Economics, Second Edition, 2008.
Svensson, L.E.O., (2010), "Inflation Targeting," in: Benjamin M. Friedman and Michael Woodford (ed.), Handbook of Monetary Economics, Edition 1, Volume 3, Chapter 22, pp 1237-1302.
Svensson, L.E.O. (2017c), “Leaning Against the Wind: Costs and Benefits, Effects on Debt, Leaning in DSGE Models, and a Framework for Comparison of Results,” International Journal of Central Banking 13:385-408.
Svensson, L.E.O. (2017), “Cost-Benefit Analysis of Leaning against the Wind”, Journal of Monetary Economics, 90:193–213.
Tarullo, D (2017), “Monetary policy without a theory of inflation”, Hutchins Center at Brookings Institution Working Paper No.33.
The Oxford Review of Economic Policy Volume 34, Issue 1-2, Spring-Summer 2018.
Veld, J. (2013), “Fiscal consolidations and spillovers in the Euro area periphery and core”, EU Commission European Economy Paper, Economic Papers 506, October 2013, Table 5, pages 10 and 11.
[1] See EMI (1997) “The single monetary policy in stage three: elements of the monetary policy strategy”.
[2] I use the expression “technical monetarism” to designate the operational approach relying on a target for a monetary aggregate precisely calibrated to achieve the desired level of inflation. The word Monetarism has been used in a more general doctrinal way, referring to a set of beliefs about a particular vision of the way market economies work.
[3] See Issing, O. (2006), “The ECB’s Monetary Policy Strategy: Why did we choose a two Pillar Approach?”, contribution to the 4th ECB Central Banking Conference, Frankfurt, November.
[4] See ECB (2011), “The monetary policy of the ECB”, third edition, May. For a detailed review of the theoretical features of inflation targeting, see Svensson, L.E.O., (2010), "Inflation Targeting," in: Benjamin M. Friedman and Michael Woodford (ed.), Handbook of Monetary Economics, Edition 1, Volume 3, Chapter 22, pp 1237-1302.
[5] December year-on-year percentages.
[6] Already in 2000, Gerlach and Svensson had concluded that “the prominent “first pillar” in its (ECB) monetary strategy, contains little information about future inflation”. See, Gerlach, S. and L.E.O. Svensson (2000), “Money and Inflation in the Euro Area: A Case for Monetary Indicators?”, NBER Working Paper No. 8025, published later in the Journal of Monetary Economics 50 (2003) 1649-1672. See also, Alves, N. and C.R. Marques (2004), “Money in the ECB’s monetary policy strategy: a reassessment”, Banco de Portugal, mimeo, December 2004, later developed into a Working Paper No. 20, 2007 “Is the euro area M3 abandoning us?“.
[7] Svensson, L.E.O. (2008), “Inflation targeting”, in The New Palgrave Dictionary of Economics, Second Edition, 2008.
[8] See for instance De Grauwe, P. (2005), “Monetarists cry wolf on eurozone inflation”, Opinion, Financial Times.
[9] IMF World Economic Outlook, April 2005.
[10] OECD Economic Outlook, Vol. 2005, Issue 2.
[11] See Rünstler, G. and M. Vlekke (2018), “Business, Housing and Credit Cycles”, Journal of Applied Econometrics, 33(2): 212-226; Schüler, Y., P. Hiebert and I. Jaccard (2017), “Contrasting financial and business cycles: Stylized facts and candidate explanations”, mimeo Bundesbank and ECB.
[12] Svensson, L.E.O. (2017c), “Leaning Against the Wind: Costs and Benefits, Effects on Debt, Leaning in DSGE Models, and a Framework for Comparison of Results,” International Journal of Central Banking 13:385-408. Svensson, L.E.O. (2017), “Cost-Benefit Analysis of Leaning against the Wind”, Journal of Monetary Economics, 90:193–213. For a calculation of costs and benefits applied to the euro area see Constâncio, V. (2018), “Financial stability risks and macroprudential policy in the euro area”, speech at the ECB and Its Watchers XIX Conference, Frankfurt am Main, 14 March 2018.
[13] Stein, J. (2013), “Overheating in Credit Markets: Origins, Measurement, and Policy Responses”, speech at the "Restoring Household Financial Stability after the Great Recession: Why Household Balance Sheets Matter" research symposium sponsored by the Federal Reserve Bank of St. Louis.
[14] See Galì, J. and L. Gambetti (2015), “The Effects of Monetary Policy on Stock Market Bubbles: Some Evidence”, American Economic Journal: Macroeconomics 2015, 7(1): 233–257; Svensson, L.E.O. (2017), “Cost-Benefit Analysis of Leaning against the Wind”, Journal of Monetary Economics, 90: 193–213.
[15] Blanchard, O. and D. Leigh (2013), "Growth Forecast Errors and Fiscal Multipliers", American Economic Review, 103(3): 117-20.
[16] See Veld, J. (2013), “Fiscal consolidations and spillovers in the Euro area periphery and core”, EU Commission European Economy Paper, Economic Papers 506, October 2013, Table 5, pages 10 and 11.
[17] Rannenberg, A., C. Schoder and J. Strasky, (2015), “The macroeconomic effects of the European Monetary Union’s fiscal consolidation from 2011 to 2013: a quantitative assessment”, IMK Working Paper 156.
[18] See for instance Jasova M., C. Mendicino and D. Supera (2018), "Rollover Risk and Bank Lending Behavior: Evidence from Unconventional Central Bank Liquidity", mimeo; Quint, D. and O. Tristani (2017), “Liquidity provision as a monetary policy tool: The ECB’s non-standard measures after the financial crisis”, Journal of International Money and Finance, 80:15-34.
[19] See Lorenzoni, G. (2009), “A Theory of Demand Shocks”, American Economic Review, 99: 2050–84 as an example of models in which a drop in consumer sentiment can lead to demand shocks.
[20] See Constâncio, V. (2014), “A new phase of the ECB’s monetary policy”, intervention at the ECB workshop on non-standard monetary policy measures, Frankfurt 6 October 2014.
[21] See e.g. Altavilla, C., G. Carboni and R. Motto (2015), “Asset purchase programmes and financial markets: lessons from the euro area”, ECB Working Paper No 1864; Breckenfelder J., F. De Fiore, P. Andrade, P. Karadi and O. Tristani (2016), "The ECB's asset purchase programme: an early assessment”, ECB Working Paper Series 1956.
[22] See for instance the article by Jürgen Stark, former member of the ECB board.
[23] See Constâncio, V. (2017), “Inequality and macroeconomic policies”, speech at the Annual Congress of the European Economic Association, Lisbon 22 August 2017. Based on work by Lenza, M. and J. Slacalek (2017), "The effects of unconventional monetary policy on inequality in the euro area", mimeo, European Central Bank.
[24] See the whole issue of the The Oxford Review of Economic Policy Volume 34, Issue 1-2, Spring-Summer 2018.
[25] See Blanchard, O. (2017), “The Need for Different Classes of Macroeconomic Models”, Peterson Institute for International Economics Real Time Economic Issues Watch, 12 January 2017.
[26] Brayton, F. and P. A. Tinsley (1996), "A guide to FRB/US: a macroeconomic model of the United States", Finance and Economics Discussion Series 96-42, Board of Governors of the Federal Reserve System.
[27] See Constâncio, V. (2017), “Developing models for policy analysis in central banks”, speech at the Annual Research Conference, Frankfurt am Main 25-26 September 2017.
[28] For an insightful reflection from a policy-maker, see Tarullo, D. (2017), “Monetary policy without a theory of inflation” Hutchins Center at Brookings Institution Working Paper No.33.
[29] See the insightful description by Gordon, R. (2009), “The history of the Phillips Curve: consensus and bifurcation”, Economica 78(309):10-50.
[30] See Gordon, R. (2013), “The Phillips curve is alive and well: inflation and the NAIRU during the slow recovery”, NBER Working Paper 19390.
[31] See Roberts, J.M. (2006), “Monetary Policy and inflation dynamics”, International Journal of Central Banking 2:193-230.
[32] Galì, J. and M. Gertler (1999), “Inflation dynamics: a structural econometric analysis”, Journal of Monetary Economics. 44:195-222; see also Galì, J., M. Gertler and D. López-Salido (2005), “Robustness of the estimates of the hybrid new Keynesian Phillips Curve", Journal of Monetary Economics, 52:1107-18.
[33] See Constâncio, V. (2015), “Understanding Inflation Dynamics and Monetary Policy,” panel remarks at the Annual Economic Policy Symposium, Federal Reserve Bank of Kansas City.
[34] King, R. and M.W. Watson (2012), “Inflation and unit labour costs”, Journal of Money, Credit and Banking, 44(s2):11-149.
[35] Gürkaynak, R.S., B. Kisacikoglu, and B. Rossi (2013), “Do DSGE Models Forecast More Accurately Out-of-Sample than VAR Models?”, CEPR Discussion Paper, July 2013.
[36] Mavroeidis, S., M. Plagborg-Møller and J. Stock (2014), “Empirical Evidence on Inflation Expectations in the New Keynesian Phillips Curve”, Journal of Economic Literature 52(1):124-188, March 2014.
[37] Coibion, O. and Y. Gorodnichenko, (2015), “Is the Phillips Curve Alive and Well after All? Inflation Expectations and the Missing Disinflation”, American Economic Journal: Macroeconomics, 7(1):197-232.
[38] See Jarociński, M. and M. Lenza (2016), “An inflation-predicting measure of the output gap in the euro area,” ECB Working Paper 1966, forthcoming article in the Journal of Money, Credit and Banking.
[39] See Jarociński, M. and M. Lenza (2016), “An inflation-predicting measure of the output gap in the euro area,” ECB Working Paper 1966, forthcoming article in the Journal of Money, Credit and Banking.
[40] See European Commission (2014), “The production function methodology for calculating potential growth rates & output gaps”, Economic Papers 535, page 7.
[41] See Ciccarelli, M. and C. Osbat (ed) (2017), “Low inflation in the euro area: Causes and consequences“, ECB Occasional Paper No. 181.
[42] Staiger, D., J.H. Stock, and M.W. Watson (1997), “The NAIRU, unemployment and monetary policy” Journal of Economic Perspectives 11:33-49.
[43] Blanchard, O. and L. Summers (1986), “Hysteresis and the European Unemployment Problem”, NBER Macroeconomics Annual, Vol. 1. and Blanchard, O., E. Cerutti and L. Summers (2015), “Inflation and activity − two explorations and their monetary policy implications”, ECB Forum on Central Banking on Inflation and Unemployment in Europe, Sintra 2015.
[44] Blanchard, O. (2017), “Should we reject the natural rate hypothesis?”, Peterson Institute for International Economics Working Paper 17/14; Farmer, R. (2013), “The Natural Rate Hypothesis: An idea past its sell-by date”, NBER Working Paper No. 19267 and Bank of England Quarterly Bulletin, September Q3, pp 244-256, 2013; see also an earlier paper Beyer, A. and R. Farmer (2002), “Natural rate doubts” ECB Working Paper 121.
[45] Estrella, A. and F. Mishkin (1998), “Rethinking the role of NAIRU in Monetary policy: the implications of model formulation and uncertainty”, Federal Reserve Bank of New York.
[46] This regression approach follows the analysis in Orlandi, F. (2012), “Structural Employment and its Determinants in EU Countries”, European Commission Economic Papers 455. Using a broader set of variables, another paper that illustrates that European Commission estimates of the NAIRU are not a good proxy of structural unemployment is Heimberger, P., J. Kapeller, and B. Schütz (2016), “What’s ‘structural’ about unemployment in Europe: on the determinants of the European Commission’s NAIRU estimates”, ICAE, University of Linz, Working Paper No 47.
[47] See European Commission (2015), “Structural unemployment vs. NAWRU: implications for the assessment of the cyclical position and the fiscal stance”, Economic Papers 552.
[48] See European Commission (2017), “NAWRU estimation using structural labour Market indicators”, Discussion Paper 069.
[49] For a more in-depth discussion see Constâncio, V (2017), “The future of monetary policy frameworks”, lecture at the Instituto Superior de Economia e Gestão, Lisbon. See also Duffie, D. and A. Krishnamurthy (2016), “Pass-through efficiency in the FED’s new monetary policy setting”, presented at the Annual Economic Policy Symposium, Federal Reserve Bank of Kansas City; Greenwood R., S. Hanson and J. Stein (2016), “The Federal Reserve's Balance Sheet as a Financial-Stability Tool”, 2016 Economic Policy Symposium Proceedings. Jackson Hole: Federal Reserve Bank of Kansas City.
[50] See for instance Blanchard, O., G. Dell’Ariccia and P. Mauro (2010), “Rethinking Macroeconomic Policy”, Journal of Money, Credit and Banking, 42: 199–215 and Krugman, P. (2014), “Inflation targets reconsidered”, ECB Forum on Central Banking, May 2014.
[51] Constâncio, V. (2016), “Challenges for future monetary policy frameworks: A European perspective”, speech at the 19th Annual International Banking Conference “Achieving Financial Stability: Challenges to Prudential Regulation”, Federal Reserve Bank of Chicago, 4 November 2016.
[52] Availabe at http://populardemocracy.org/news-and-publications/prominent-economists-question-fed-inflation-target.
[53] Bernanke, B. (2017), “Monetary Policy in a New Era”, conference on Rethinking Macroeconomic Policy, Peterson Institute for International Economics, 12-13 October 2017.
[54] Svensson, L.E.O. (1999), “Price-Level Targeting versus Inflation Targeting: A Free Lunch?”, Journal of Money, Credit and Banking, 31(3):277-295. Gaspar, V., F. Smets and D. Vestin (2007), “Is the time ripe for price level path stability?”, ECB Working Paper 818; Schmidt, S. (2011), “The cost channel, indeterminacy, and price-level versus inflation stabilization”, The B.E. Journal of Macroeconomics, 11(1).
[55] See presentation of the ECB Annual Report 2017 to the Committee on Economic and Monetary Affairs of the European Parliament, Introductory Remarks by Vítor Constâncio, Vice-President of the ECB, Brussels, 9 April 2018.
[56] Duffie, D. and A. Krishnamurthy (2016), “Pass-through efficiency in the FED’s new monetary policy setting” and Greenwood, R., S. Hanson and J. Stein (2016), “The Federal Reserve’s balance sheet as a financial stability tool”, both presented at the Annual Economic Policy Symposium, Federal Reserve Bank of Kansas City.
[57] See Constâncio, V. (2017), “Growth, adjustment and resilience in the euro area”, at the Forum Villa d’Este, Cernobbio, 2 September 2017.
Banca centrale europea
Direzione Generale Comunicazione
- Sonnemannstrasse 20
- 60314 Frankfurt am Main, Germany
- +49 69 1344 7455
- media@ecb.europa.eu
La riproduzione è consentita purché venga citata la fonte.
Contatti per i media