
ECB Environmental statement 2022
Foreword

The European Union is committed to achieving a 55% reduction in greenhouse gas emissions (relative to 1990 levels) by 2030 and becoming the world’s first climate‑neutral continent by 2050. We at the ECB take these efforts very seriously, including as regards the way that we carry out our day-to-day activities. As a European institution, we want to play our part in this transition and are actively working towards further reducing our own carbon footprint, in line with the goals of the Paris Agreement.
In 2021 we stepped up our climate commitments and strengthened our environmental objectives and measures for the period 2022-24 and beyond. We are now aiming to reduce our carbon emissions by 46.2% (relative to 2019 levels) by 2030. To help us achieve this ambitious objective, we have set further targets for ourselves and adopted new measures in seven strategic areas (including energy, procurement and biodiversity).
2021 marked the 11th anniversary of the ECB’s registration with the European Eco‑Management and Audit Scheme (EMAS), which has allowed us to significantly reduce our environmental impact. It also saw us take resolute action to continue fostering environmental protection: we established new approaches to business travel and meetings in order to keep travel-related emissions low, learning lessons from the pandemic, and we upgraded our cycling infrastructure on site in order to encourage a more sustainable commute to work. Furthermore, we made progress in our efforts to phase out natural gas in favour of biogas as a renewable heating source – a measure which complements our ongoing commitment to 100% renewable electricity in our premises. With this publication, we have also begun reporting on additional elements of our carbon footprint in order to increase transparency and accountability for environmental impacts along our value chain. Our thorough footprint analysis has helped us to identify further areas for improvement, supporting progress towards our carbon-reduction targets, which are aligned with the Paris Agreement.
Lastly, 2021 saw the establishment of our climate change centre, which helps to shape and steer the ECB’s strategy in this area, with a focus on how our institution can tackle this challenge as part of its mandate.
While I am proud of how far we have come on our environmental journey, I am already looking ahead, searching for ways to achieve our 2030 targets and contemplating the journey that we as ECB staff are embarking on for the benefit of our planet.
Michael Diemer
Chief Services Officer
1 The year in figures
Figure 1
2021 highlights

Source: ECB.
Figure 2
2021 in figures
(2021 figures and percentage changes relative to 2020 and 2019)
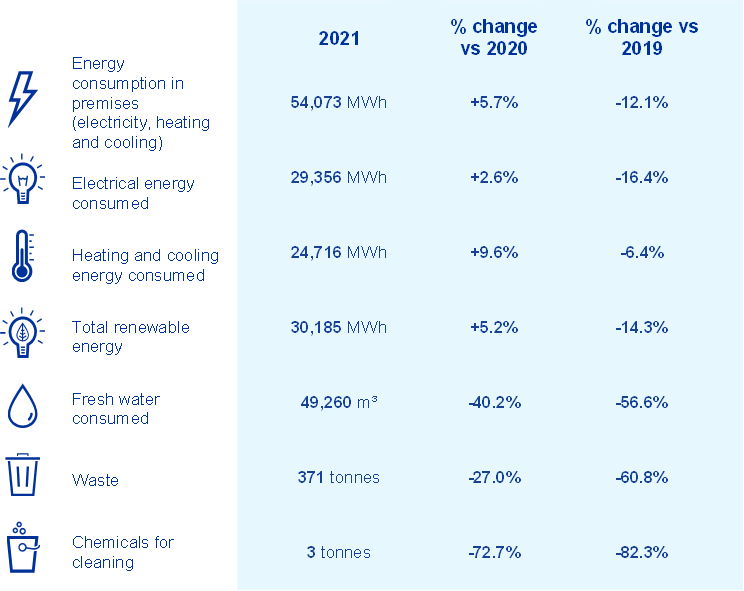
Source: ECB.
Notes: Average environmental data per workplace can be found in Chapter 7. These are less representative of the ECB’s environmental performance in 2021, given the limited on-site presence on account of the coronavirus (COVID-19) pandemic.
These developments are described in more detail in Chapter 6.
2 The ECB at a glance
The euro area’s central banking system, which is known as the Eurosystem, comprises the ECB and the national central banks (NCBs) of the relevant countries, and its primary objective is to maintain price stability. The ECB is also responsible for the prudential supervision of credit institutions in the euro area and certain other participating states under the Single Supervisory Mechanism (SSM), which also includes the national supervisory authorities of the countries in question.
The ECB’s tasks and activities in its fields of competence are outlined in its Annual Report and the yearly report on its supervisory tasks. These reports also include information on climate change-related work at the ECB within the scope of its mandate and areas of competence. This year, the ECB’s Annual Report features a new chapter outlining all of our sustainability-related activities and initiatives. As a result, our environmental reporting framework has been expanded to include social and governance-related considerations in an integrated format.
This Environmental Statement focuses on the ECB’s organisational footprint – i.e. impacts related to its premises and general operations (such as the consumption of energy and materials, as well as travel-related activities). It details the ECB’s environmental performance in 2021, as well as describing significant achievements and steps taken to reduce the ECB’s environmental impact as an organisation.
More information about the ECB and its tasks, as well as the European System of Central Banks (ESCB) and the Eurosystem, can be found here on its website.
2.1 ECB premises
This section presents details of the three buildings that fall within the scope of the ECB’s environmental management system (EMS).[1]
Main building

Officially inaugurated in November 2014, the ECB’s main building is located in the Ostend district of Frankfurt am Main. The majority of the ECB’s workplaces are in this building.
This building exceeds the requirements of Germany’s 2007 Federal Energy-Saving Directive (“Energiesparverordnung”) by 29% owing to its design and associated sustainability features. It is characterised by the following key environmental features:
- the facade of the high-rise tower features an energy-efficient triple layer;
- the facades and the roof of the Grossmarkthalle are insulated in an energy‑efficient manner;
- natural ventilation is ensured by operable facade elements, electric sun shading and low-energy lighting, providing optimal working conditions with maximum daylight;
- rainwater is collected and used for irrigation and sanitary areas;
- waste heat generated by the computer centre is used to heat offices;
- geothermal energy is used for the heating and cooling of the premises.
The greening of the area around the main building added to Frankfurt’s “green lung” by linking the ECB’s landscaped grounds with the neighbouring urban parks and the city’s green belt. Furthermore, the ECB has also taken steps to foster biodiversity on its grounds, which are described in more detail in Section 6.6.
More information about the main building and its sustainability features can be found here.
City centre (Eurotower and Japan Center)
The Eurotower and the Japan Center are located in the city centre and have been rented by the ECB since 1998 and 2014 respectively. These provide nearly half of the ECB’s total workplaces, housing banking supervision staff.
In 2020 the Eurotower achieved gold certification under the Leadership in Energy and Environmental Design (LEED) initiative, thanks to improvements to its technical infrastructure between 2015 and 2016. These included:
- installation of energy-efficient sun-shading systems;
- insulation of the concrete core;
- installation of new combined heat and power plants;
- updating of air conditioning systems to improve energy efficiency;
- increased energy efficiency for the lifts;
- establishment of an LED lighting system in the offices.
Measures aimed at further increasing the energy efficiency of the ECB’s premises and objectives in this regard are described in more detail in Section 6.2.
3 Environmental management at the ECB
3.1 Organisational context

The COVID-19 pandemic continued to have an impact on the ECB’s operations and day-to-day activities in 2021. Travel restrictions and social distancing requirements limited the presence of staff on site and necessitated remote working throughout the year. Despite the limited on-site presence, the ECB’s buildings and their technical systems remained in normal operation to ensure the smooth functioning of the buildings and the servicing of areas used by staff working on site. Additionally, technical systems remained in operation in order to comply with building maintenance requirements, as well as health and safety standards. Consequently, although reductions were observed, relatively high levels of energy usage continued to be required for building maintenance, operational activities and precautionary hygiene measures.
The ECB is aware that, owing to its remote working arrangements, certain environmental impacts, such as those resulting from energy consumption, have partly shifted from the ECB’s premises to the homes of ECB staff. Emissions stemming from staff commutes and business travel decreased significantly in 2021, as meetings and other work were largely conducted online. In order to avoid a strong rebound in such emissions after the pandemic, the ECB is working on internal guidelines to limit the environmental impact of meetings and is planning to revise its business travel policy in 2022. Additionally, the ECB has expanded the boundary of its Scope 3 carbon footprint in order to better measure and manage such impacts along its value chain (see Section 4.2 and Section 5.2 for more details).
The changes to the organisational context (including associated risks and opportunities, as well as stakeholder expectations) will provide an important basis for the development of the ECB’s environmental management system, as well as its objectives and measures.
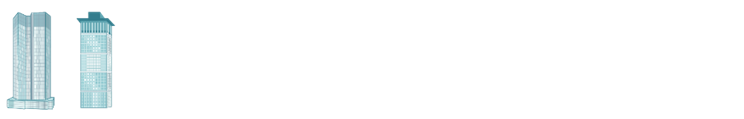
3.2 Environmental policy

The ECB’s general intentions and approach as regards its environmental performance and objectives are described in its environmental policy. That policy was adopted in 2007, before being revised in 2013 to emphasise the role of staff awareness and behavioural changes. Editorial amendments were then made in 2019.
Staff (both internal and external alike) are encouraged to actively integrate the environmental policy and its requirements into their everyday tasks by implementing measures which have a positive impact on the ECB’s environmental performance.
Figure 3
The ECB’s environmental policy
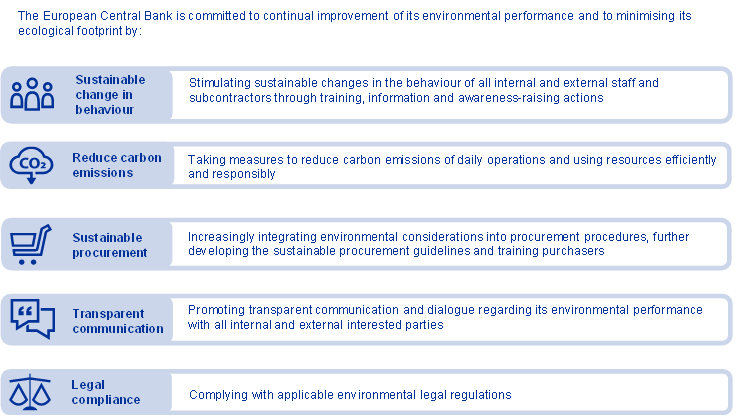
3.3 Environmental management organisation

The Green ECB team is responsible for monitoring all aspects of the EMS and coordinating the corresponding activities, which are conducted by various stakeholders. The team is led by an Environmental Coordinator and an Environmental Officer, who are appointed by the ECB’s Executive Board and supported by environmental experts. Environmental Representatives facilitate the implementation of the EMS across all ECB business areas and are appointed by their senior management. The Environmental Coordinator and Officer report to the Executive Board via the Chief Services Officer on matters pertaining to the EMS and its performance.
Figure 4
Organisational structure of the EMS
Table 1
Roles and responsibilities

In addition, the Green ECB team also contributes to the corporate sustainability workstream of the ECB’s climate change centre (CCC) – a new unit established in 2021 that brings together all of the ECB’s activities in the area of climate change, seeking to foster a structured approach to the coordination and strategic planning of such activities. The CCC’s work is organised around six thematic areas that encompass all ongoing climate change-related activities across the ECB: financial stability and prudential policy; macroeconomic analysis and monetary policy; financial market operations and risk management; EU and international policy and financial regulation; data; and corporate sustainability. Furthermore, the CCC also facilitates the sharing of information about other cross-cutting work on climate change in the areas of research, market infrastructure and payments, law and banknotes.[2]
Since 2010, the ECB’s EMS has been registered with the European Eco‑Management and Audit Scheme (EMAS)[3] and certified on the basis of environmental management norm ISO 14001. The EMS covers organisational activities at the ECB’s main building, the Japan Center and the Eurotower. The governance framework for the EMS is laid down in the ECB’s Environmental Management Handbook, which contains processes and operational procedures to ensure that the EMS is maintained and implemented in accordance with all applicable standards.
In accordance with EMAS and ISO 14001, the EMS is subject to both internal and external controls to prevent and monitor deviations from the environmental governance framework. Internal environmental audits are conducted annually by the Environmental Officer (assisted by external experts), while external audits are conducted by accredited environmental verifiers.
4 Relevant changes to the EMS
The ECB has taken concrete steps to scale up its initiatives in the field of climate change within the scope of its mandate and areas of competence. For the EMS, this entailed an update to the ECB’s carbon-reduction goals, in line with the Paris Agreement, using science-based methods to set emission-reduction targets in accordance with leading climate science.[4] Additionally, following a materiality assessment carried out in 2021, the ECB has extended its carbon footprint boundary in order to report on additional environmental impacts as part of its Scope 3 emissions. This will allow the ECB to monitor environmental impacts within its value chain more effectively and drive further improvements.
4.1 Enhanced environmental objectives and measures
As a European institution, the ECB is committed to taking the necessary steps to protect the environment and fight climate change in terms of its day-to-day activities. Within the framework of the EMS, the ECB took steps in 2021 to align its carbon‑reduction objectives with the Paris Agreement’s goal of limiting global temperature increases to 1.5°C above pre-industrial levels. This translates to a 46.2% reduction in total reported carbon emissions by 2030 relative to a 2019 baseline.
The ECB’s Environmental Management Programme 2022-24 has been updated to reflect this ambitious new carbon-reduction target, including new and updated environmental objectives in the areas of energy, material efficiency, green procurement and awareness-raising.
Figure 5
New environmental objectives
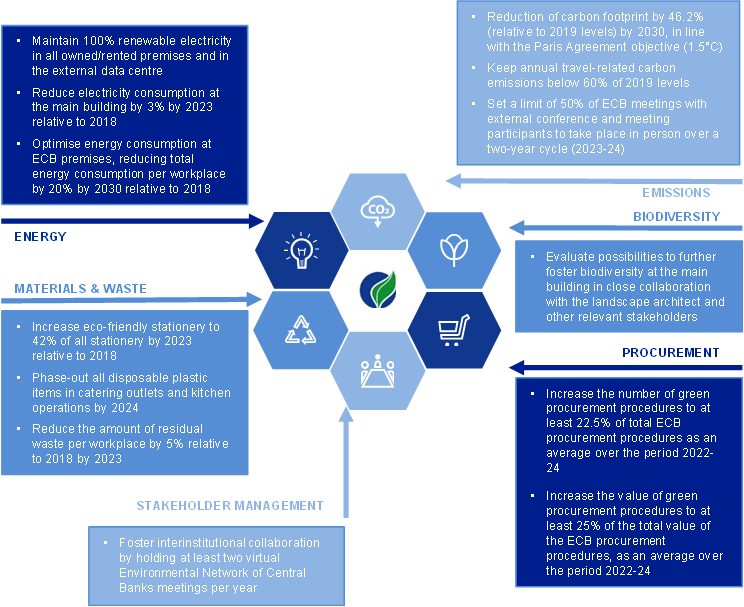
A more detailed overview of all environmental objectives and measures can be found in Chapter 5 and Chapter 6.
4.2 Updates to the ECB’s carbon footprint boundary
In order to manage climate risks more effectively and identify opportunities for improvement along the value chain, the ECB’s carbon footprint boundary was expanded in 2021, seeking to increase transparency regarding the ECB's environmental impact (with a focus on indirect emissions) and achieve closer alignment with the Greenhouse Gas Protocol Corporate Value Chain (Scope 3) Standard[5] and interinstitutional guidelines drawn up by GIME[6].
The extended carbon footprint boundary will be applied retroactively as of 2019 in order to serve as a baseline for the updated targets. As a result of that extension and the inclusion of new Scope 3 categories, the ECB’s reported carbon footprint for the baseline year 2019 has more than doubled. The main changes relate to (i) the inclusion of travel by conference participants, (ii) the incorporation of emissions related to the construction of the ECB’s main building (amortised over a 25-year period) and (iii) the inclusion of well-to-tank (WTT) emissions and a radiative forcing index (RFI) in the calculation of travel-related emissions.
Figure 6 provides an overview of the ECB’s new carbon footprint boundary following the Scope 3 extension. The extension to the reporting of indirect (Scope 3) emissions is described in detail in Section 5.2.
Figure 6
The ECB’s carbon footprint boundary
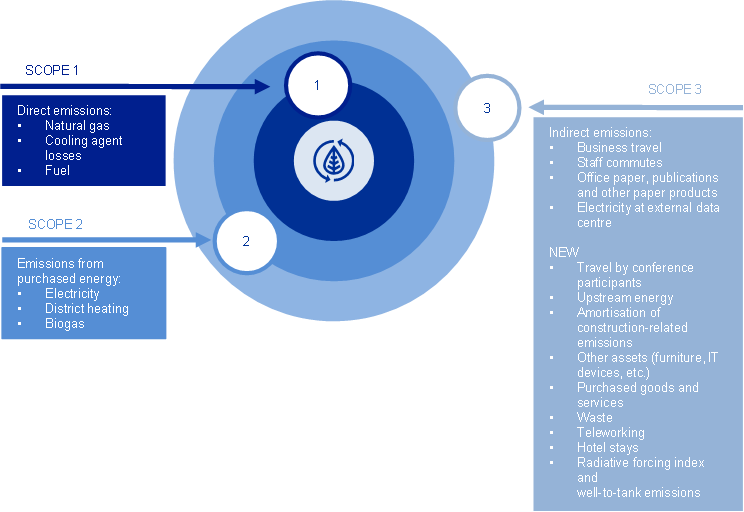
Source: ECB.
Notes: The sizes of the three circular layers do not correspond to their respective shares in the ECB’s carbon footprint. In accordance with the Greenhouse Gas Protocol, Scope 1 emissions are direct emissions resulting from owned or controlled sources, whereas indirect emissions from the generation of purchased energy are reported under Scope 2. Scope 3 emissions are indirect (up- and downstream) emissions not included in Scope 2 that occur in the value chain of the reporting organisation.
It should be noted that, given the nature of Scope 3 emissions, the ECB will have to work continuously with counterparts to improve data quality and identify opportunities for reductions, as these impacts are significantly harder for the ECB to influence directly. The level of uncertainty surrounding the ECB’s carbon footprint (including as regards the expansion of Scope 3) was assessed in 2021 to ensure transparency and identify possible opportunities for improvement. Details of that assessment can be found in Section 7.3.
5 The ECB’s carbon footprint
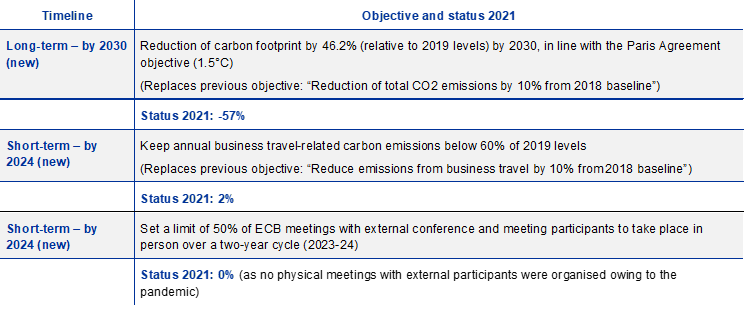
Notes: “New” = the objective has been introduced or updated with the new EMP. Developments in 2021 are strongly influenced by the pandemic and related factors, such as travel restrictions.
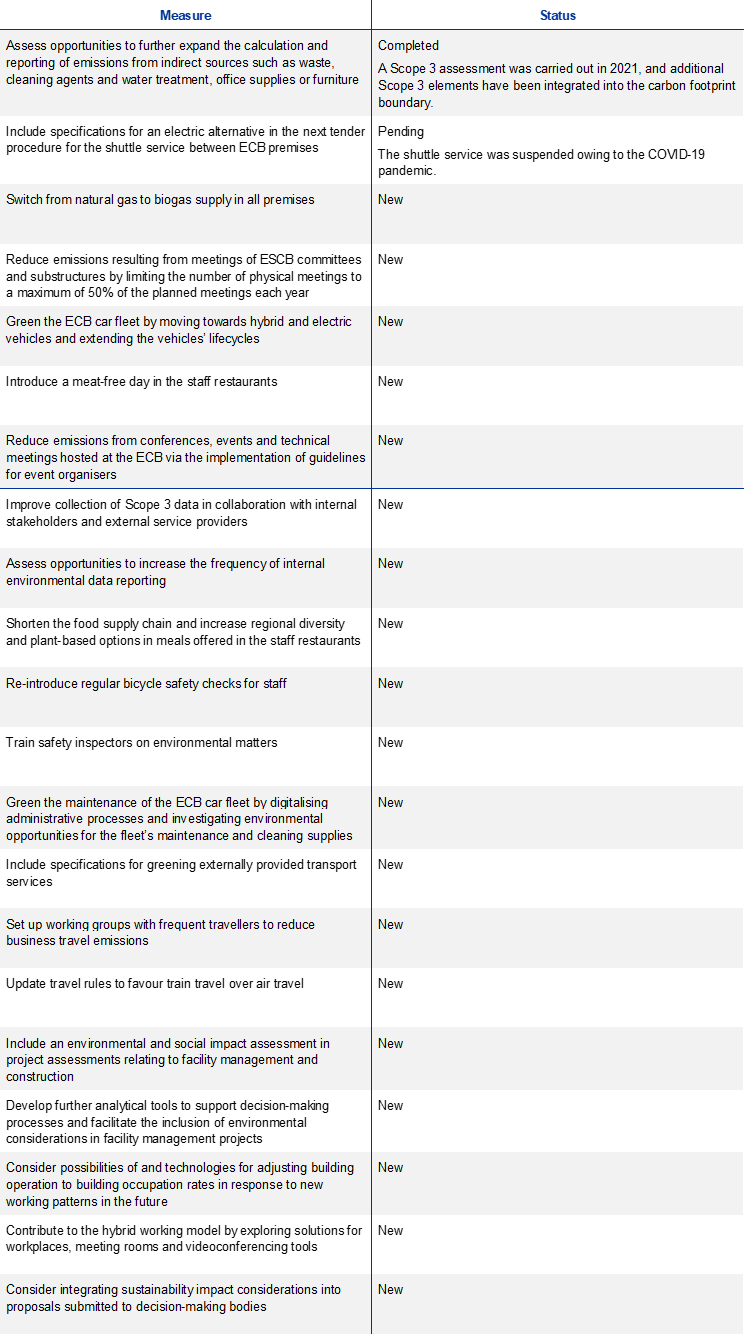
Note: “Completed” = measure completed; “In progress” = measure in progress; “Pending” = measure still to be implemented; “New” = measure was introduced with the new EMP.

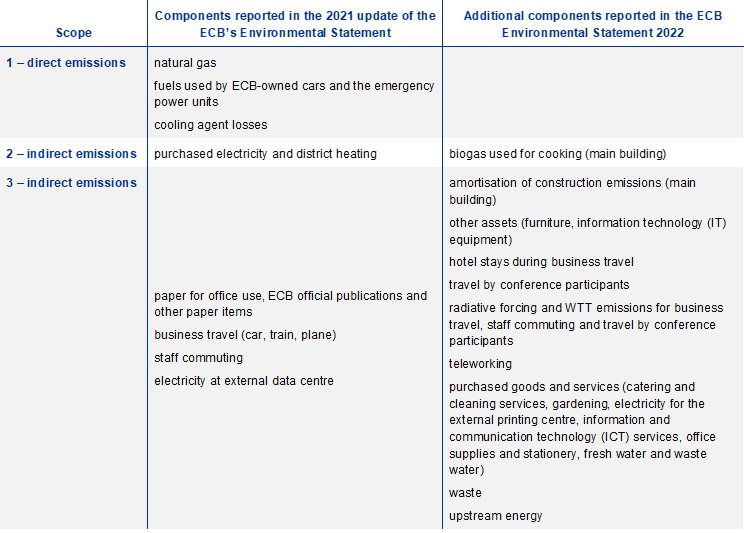
The Greenhouse Gas Protocol provides the framework for calculating the ECB’s carbon emissions and allocating direct and indirect emissions to Scopes 1, 2 and 3.
The components of the three different scopes are outlined in Table 2. The Scope 3 extension is described in detail in Section 5.2.
Table 2
Components of the ECB’s carbon footprint before and after the Scope 3 extension
As Chart 1 shows, total CO2 emissions have declined since 2019, mainly owing to a significant decline in Scope 3 emissions as a consequence of the COVID-19 pandemic and the subsequent suspension of most travel-related activities. Scope 1 and 2 emissions remained relatively stable between 2019 and 2021, owing to the baseload required to maintain and operate the ECB’s buildings. Further details are provided in the following sections. Overall, the ECB’s reported carbon emissions decreased by 10.7% between 2020 and 2021.
Chart 1
Total CO2 emissions: Scopes 1, 2 and 3
(tonnes of CO2 equivalent)
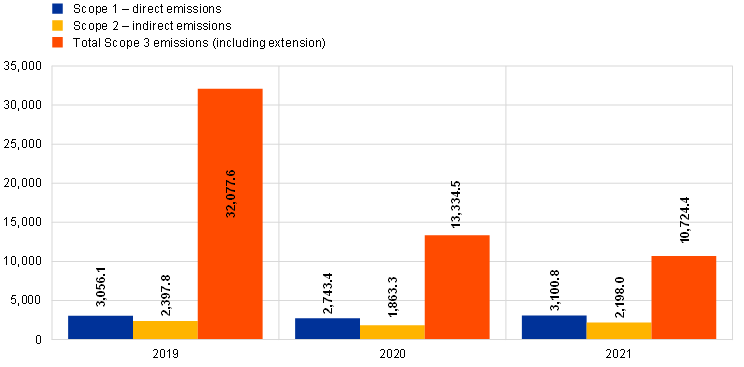
Source: ECB.
Notes: Values for 2019 and 2020 have been adjusted to increase alignment with the reporting guidelines of the Greenhouse Gas Protocol. Scope 1 values have been changed from 3,111.4 to 3,056.1 tonnes of CO2 equivalent for 2019 and from 2,759.7 to 2,743.4 tonnes for 2020. The Scope 2 value for 2019 has been changed from 2,397.7 to 2,397.8 tonnes. Scope 3 values have been changed from 5,250.6 to 32,077.6 tonnes for 2019 and from 1,275.7 to 13,334.5 tonnes for 2020 owing to the extension of the Scope 3 boundary.
Since 2018 the ECB has offset its reported greenhouse gas emissions via the purchase of Gold Standard-certified carbon credits that support sustainable projects on a global scale. The projects fund energy-efficient cooking stoves to reduce the use of raw materials and support local communities, landfill gas extraction to generate electricity from waste, and borehole installations to improve local access to clean drinking water and increase regional employment. In 2021 surplus credits purchased in previous years were utilised to offset the ECB’s residual 2020 carbon emissions.
In 2022 the ECB aims to conduct a public procurement procedure to offset its residual carbon emissions corresponding to the year 2021. While offsetting can help the ECB to balance emissions that cannot feasibly be reduced during a given year, the avoidance and reduction of emissions remain the ECB’s strategic priorities.
5.1 Emissions related to the operation of ECB premises
Scope 1 emissions (direct emissions) and Scope 2 emissions (indirect emissions from purchased energy) are directly related to the operation of the ECB’s premises and mainly stem from the consumption of energy for heating and cooling and the consumption of fuel. In 2021 Scope 1 and 2 emissions represented 33.1% of the ECB’s total carbon footprint. Their relative shares have decreased as a result of the extension of the Scope 3 carbon footprint boundary. Upstream emissions from all energy suppliers are reported under Scope 3 (see Section 5.2 for further information). Scope 2 emissions related to electricity consumption are zero, as, since 2016, the ECB has sourced 100% of the electricity for its premises from renewable sources.[7] Nonetheless, increased energy efficiency continues to be a priority for the ECB’s environmental management system.
Chart 2
CO2 emissions: Scopes 1 and 2
(tonnes of CO2 equivalent)
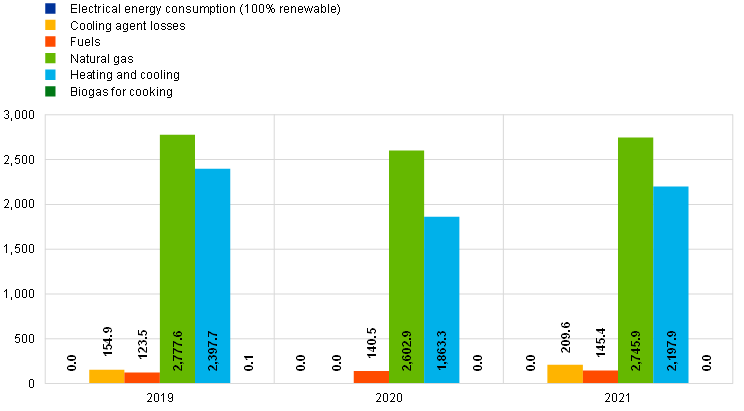
Source: ECB.
Notes: Emissions from natural gas have been adjusted from 2,832.9 to 2,777.6 tonnes of CO2 equivalent for 2019 and from 2,619.2 to 2,602.9 tonnes for 2020 on the basis of an improvement in the monitoring and reporting process. Emissions from biogas for cooking are shown for the first time for 2021.
5.2 Indirect emissions
Developments in Scope 3 emissions for 2021 are described in Chapter 6. Overall, Scope 3 emissions accounted for 66.9% of the ECB’s carbon footprint in 2021. Prior to the changes in the reporting boundary, Scope 3 only covered emissions related to business travel, staff commuting and paper consumption. This section describes additional categories with an environmental impact that were included in the ECB’s reported carbon footprint as a result of the Scope 3 extension.
Business travel and hotel stays
While the ECB already reported emissions from business travel prior to the carbon footprint extension, the expanded scope now also includes WTT emissions[8] for all fossil fuel-based transport and takes into account an RFI[9] factor for air travel. By measuring radiative forcing and WTT impacts, the ECB is following best practice and aims to provide a holistic overview of emissions from its travel activities. Furthermore, this emissions category now also includes emissions from hotel stays.
In 2021 business travel remained highly restricted, as it had been for the majority of 2020, which led to another substantial reduction in business travel emissions (by 78.5% compared with 2020). To avoid a strong rebound in business travel in the future, the ECB has set an objective of capping annual travel-related CO2 emissions at 60% of 2019 levels from 2022 to 2024. In 2021, owing to the pandemic-related travel restrictions, these emissions were only 2.4% of 2019 levels.
For further information, see Section 6.9.
Conference participants’ travel
Emissions from travel by conference participants (now also including radiative forcing and WTT emissions) to ECB conferences and events have been re-included in the ECB’s carbon footprint as part of the overall revision of its carbon footprint boundary in order to achieve greater transparency regarding value chain-related emissions. The impact of this activity had been reported in the ECB’s Environmental Statements until 2018, but this reporting was then discontinued, owing to (i) a high probability of double-counting of business travel by delegates, (ii) the substantial amount of estimation required in the calculation and (iii) the limited influence the ECB has on how external delegates choose to travel. Despite the persistence of issues with data quality, possible double-counting and limited influence, the ECB has decided to include these emissions again and to explore opportunities to limit strong rebound effects beyond 2020 and 2021. The developments during 2021 are described in Section 6.9.
Staff commuting and teleworking
Given that the ECB’s workforce largely worked remotely during 2020 and 2021, and recognising the fact that some energy consumption has shifted from the ECB’s premises to the homes of members of staff, emissions from teleworking have been included in the ECB’s carbon footprint boundary in the staff commuting category. An estimation of emissions from the electricity consumption of a basic workstation in 2020 was used in the 2021 update of the ECB’s Environmental Statement. In 2021 the ECB carried out a detailed staff survey to better estimate emissions from teleworking, taking into account emissions from energy consumption related to office equipment, lighting, heating and cooling. Furthermore, the survey also aimed to better estimate the development of emissions from staff commuting during the pandemic. Based on the survey responses, it is estimated that emissions from teleworking amounted to 65.9 tonnes of CO2 equivalent in 2019, 807.3 tonnes in 2020 and 1,002.5 tonnes in 2021. The large increase in teleworking emissions in 2020 and 2021 was a result of the shift from on-site to remote working during the pandemic. Staff commuting emissions amounted to 2,843.2 tonnes of CO2 equivalent in 2019, 1,644.8 tonnes in 2020 and 1,281.0 tonnes in 2021.[10] However, owing to the limitations of a survey-based approach and the various assumptions made when analysing the information gathered, the conclusions and the scale of the environmental impacts associated with commuting and teleworking should be interpreted with caution.
The survey approach is described in more detail in Section 6.9.
Waste
While amounts of waste were already reported in previous Environmental Statements, the ECB now reports on emissions from waste, thanks to the availability of more precise information on the treatment and disposal of different types of waste. Emissions from waste generated on the ECB’s premises were steadily reduced between 2019 and 2021, culminating in a decrease of 10.9% in 2021 compared with 2020. For further information, see Section 6.5.
Purchased goods and services
This category comprises emissions from catering and cleaning services, external printing services, ICT services, gardening services, office supplies and stationery, paper consumption for office use, ECB publications and other paper items, electricity consumed at the external data centre and fresh and waste water.
The emissions from catering are based on the lifecycle of food items used for the preparation of meals, including aspects such as transport, while fuel consumption is used as a proxy for gardening services. Emissions from printing services cover electricity consumption and paper-related emissions. In addition to paper consumption, the ECB now also reports on emissions from office supplies and stationery. Owing to a lack of data, emissions from cleaning services are calculated on the basis of the cost of the services. Emissions from ICT services are based on the duration of videoconferences conducted by ECB staff.
Overall, emissions from purchased goods and services accounted for an estimated 8.8% of total Scope 3 emissions in 2021. Emissions from purchased goods and services fell by 20.4% in 2021 compared with 2020.
Emissions from fresh and waste water decreased continuously from 2019 to 2021. Emissions declined by 45.5% from 2019 to 2020 and by 36.6% from 2020 to 2021.
For further information, see Section 6.3 and Section 6.4.
Amortisation of construction emissions
Total emissions from the construction of the main building are estimated to amount to 111,426 tonnes of CO2 equivalent based on estimates of emissions related to the building materials used. Given an amortisation timeline of 25 years, the yearly contribution to Scope 3 emissions amounts to 4,457 tonnes. Emissions from the construction of the rented premises in the city centre are not taken into account in the carbon footprint since the ECB does not own these buildings and they are more than 25 years old.
Furniture and IT assets
Furniture and IT assets include office furniture (chairs and work desks) and IT equipment such as desktop computers, laptops, phones and printers. The associated emissions are calculated on the basis of the amount and types of these products following an amortisation approach for the lifecycle of the respective assets. In 2021 these emissions amounted to 974.9 tonnes of CO2 equivalent.
Upstream energy
This category includes upstream emissions from all Scope 1 and Scope 2 energy suppliers. In total, these emissions accounted for 17.2% of the ECB’s Scope 3 emissions in 2021.
Chart 3
CO2 emissions: Scope 3
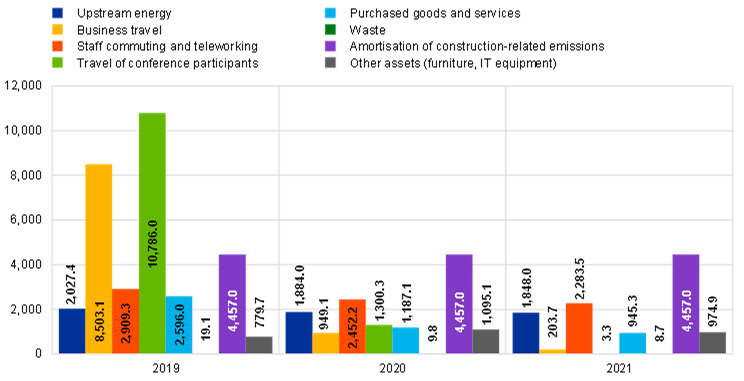
Source: ECB.
Chart 4
Scope 3: Contributions to CO2 emissions
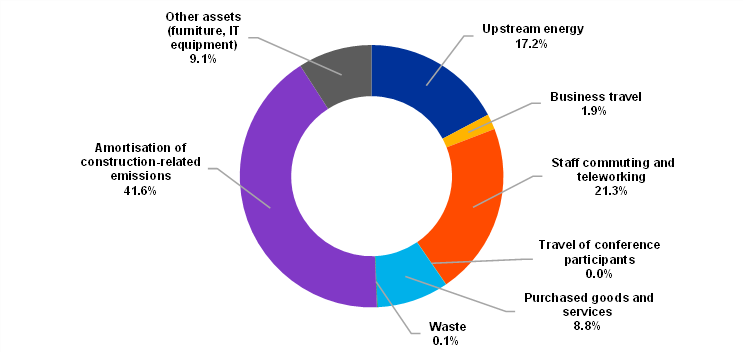
Source: ECB.
In addition to the CO2 emissions outlined above, other emissions resulting from the ECB’s operations are also monitored and reported. These include amounts of sulphur dioxide (SO2), nitrogen oxides (NOX) and particulate matter (PM) emitted by the vehicle fleet, emergency power unit test runs and natural gas consumption. The corresponding figures can be found in Chapter 7.
6 Environmental aspects and impact of the ECB’s activities
6.1 Assessment of environmental aspects
Direct and indirect environmental aspects are assessed on the basis of two criteria: the ECB’s ability to influence them and their significance for the ECB’s environmental performance.[11] Just as it had been in 2020, the impact of the COVID-19 pandemic was highly visible in 2021. Given the limited numbers of employees present on site, the environmental data for 2021 were again lower than they had been prior to the pandemic. At the same time, those 2021 data also illustrated the baseline consumption that is needed to keep the ECB’s buildings running. Remote working continued to be the norm in 2021, with energy consumption by teleworking staff being included in the ECB’s carbon footprint boundary as an indirect environmental aspect. Two other additional aspects were also included: losses from cooling agents (direct aspect) and travel by conference participants (indirect aspect). For 2022, it is anticipated that emissions from travel by conference participants, business travel and staff commutes will increase again as a result of the gradual lifting of pandemic-related mobility restrictions. However, the ECB is aiming to keep these emissions below pre-pandemic values and has therefore established concrete reduction objectives and supporting measures as part of its new Environmental Management Programme (as described in Section 4.1).
Figure 7
Assessment of the ECB’s direct environmental aspects

Source: ECB.
Note: Emissions from cooling agent losses have been added as a new direct environmental aspect for the main building and city centre premises.
Figure 8
Assessment of the ECB’s indirect environmental aspects
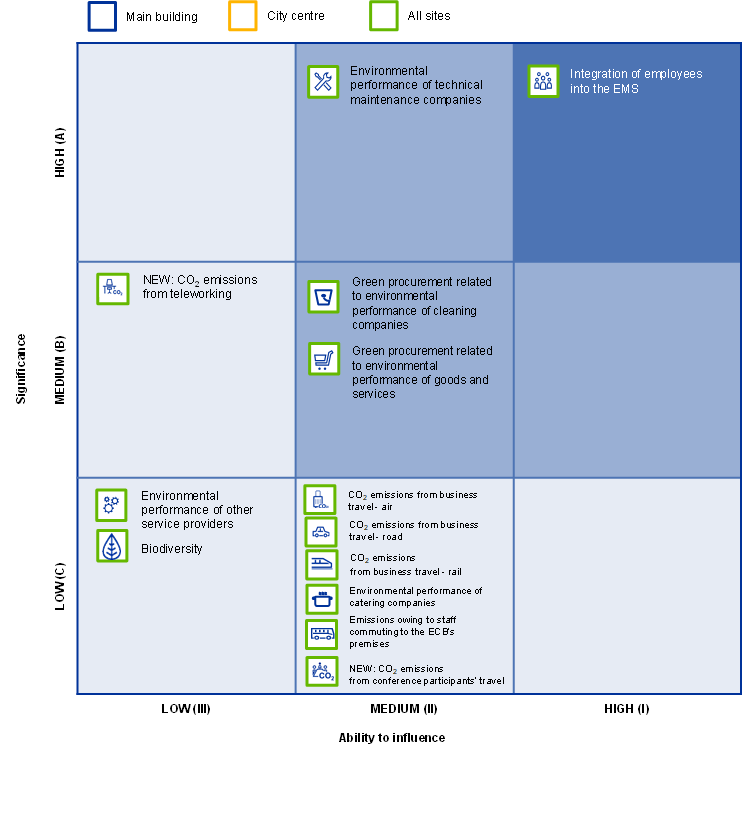
Source: ECB.
Notes: Owing to the increase in teleworking during the pandemic, emissions from teleworking have been added as a new indirect environmental aspect. The low levels of occupancy at the ECB’s premises in 2021 reduced demand for on-site catering services, so the environmental significance of catering services was reduced from medium to low. The ability to influence staff commutes was raised from low to medium, owing to increased opportunities to manage related impact via the internal teleworking policy during the pandemic.
6.2 Energy efficiency

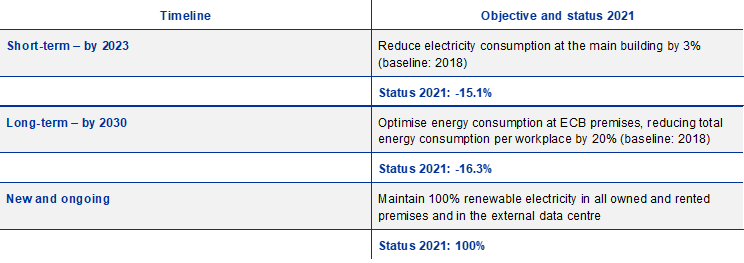
Notes: “New” = the objective was introduced with the new EMP. The 2021 status was influenced by the limited on-site presence on account of the pandemic.

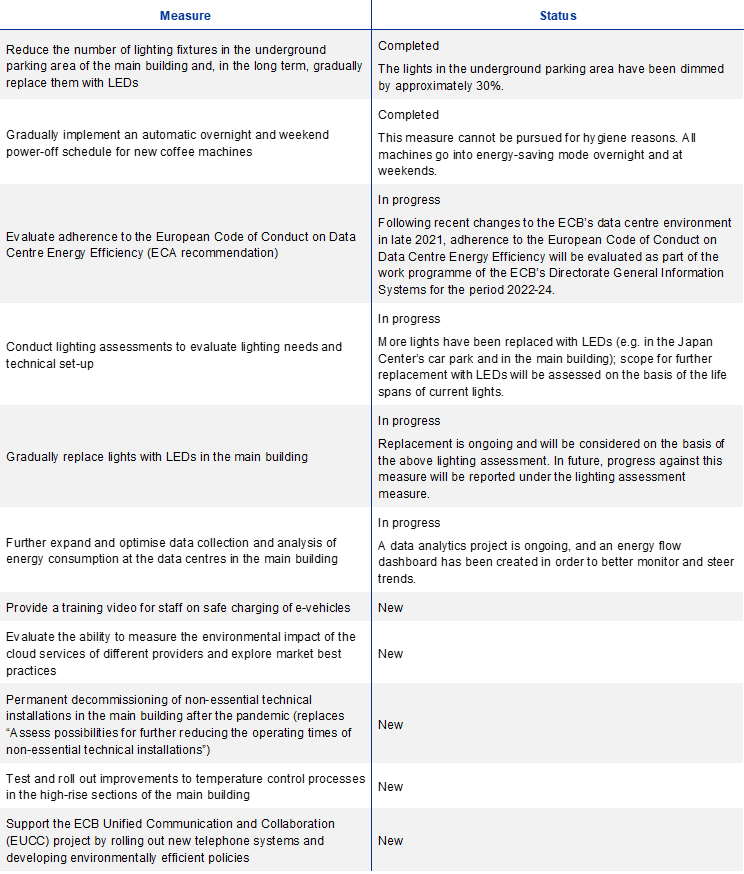
Note: “Completed” = measure completed; “In progress” = measure in progress; “Pending” = measure still to be implemented; “New” = measure was introduced with the new EMP.

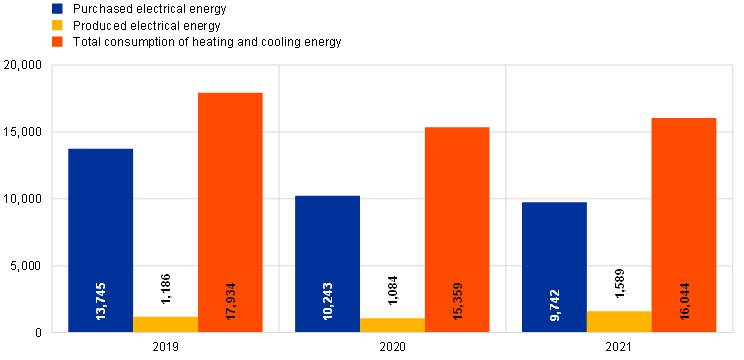
In 2021, energy consumption at the ECB’s premises was up by 5.7% relative to 2020, but it was still 12.1% lower than it had been in 2019. Despite low levels of occupancy in all ECB premises in 2021, the buildings had certain minimum energy requirements on account of building maintenance, precautionary hygiene measures and the servicing of areas used by ECB staff who continued to work on site. At the same time, it is recognised that some of that energy consumption was shifted to employees’ homes, with such consumption being estimated and reported under staff commutes and teleworking-related emissions.
In order to further reduce energy consumption at the ECB’s premises, several energy efficiency measures have been implemented, such as the replacement of lighting with LED lamps in the main building and the Japan Center. In addition, the ECB is seeking to identify further potential savings by participating in a local energy efficiency network.
In 2021, consumption of electrical energy and heating/cooling energy at the main building increased by 4.3% and 20.5% respectively relative to the previous year. One reason for this increase was the low outside temperature, with Frankfurt having an average outside temperature of 10.5°C (compared with 12.1°C in 2020 and 11.7°C in 2019). This led to an increase in the consumption of district heating. Consumption of biogas in the kitchen of the main building fell by 34.1% relative to 2020 on account of the limited catering services on site.
Although the automated building system has adapted to the changing circumstances caused by the pandemic, all areas apart from the conference and meeting rooms remained in operation in 2021. However, occupancy levels remained low in 2021, as access was limited to critical roles which had to be performed on site. This was also reflected in the number of meals served at the ECB’s staff restaurants, with 38,869 being served in 2021, compared with 90,671 in 2020.
In 2021, efforts were made to improve the automatic collection and monitoring of environmental data by creating an energy consumption dashboard. That dashboard shows climate-corrected energy consumption at frequent intervals and predicts energy consumption trends, thereby enabling more effective analysis of such trends. Furthermore, assessments are ongoing to check whether it is environmentally sound to replace further existing lighting with LED lamps. To reduce energy consumption during periods of low occupancy, an alternating schedule was introduced for the two ventilation systems in the basement and on the roof of the high-rise section, and an assessment will be made as to whether this measure can be continued beyond the pandemic.

For the city centre buildings, consumption of electrical energy remained stable relative to 2020, while energy consumption for heating and cooling increased by 4.5%.
Despite low levels of occupancy at the Eurotower, the building was only completely closed for a short period of time in 2021. To ensure the circulation of fresh air, ventilation systems continued to operate, while the building’s heating and cooling systems were operated in an energy-efficient manner. The consumption of natural gas for heating increased by 1.7% relative to 2020. Two cogeneration plants are in operation at the Eurotower, reducing the amount of energy purchased by using natural gas to generate electrical and heating energy.
Occupancy levels at the Japan Center were also limited. The building’s ventilation system was operated at a low level to meet hygiene requirements. In order to ensure successful energy and environmental management at the Japan Center, an innovative monitoring system (including new measurement and control technology) is due to be introduced within the next two years. Measures such as the gradual replacement of lighting with LEDs are being implemented in order to increase energy efficiency (with the lights in the Japan Center’s underground car park having already been replaced). Further energy efficiency measures are planned for the future. For instance, three cooling machines will be replaced with more energy-efficient models in 2022 and the fourth cooling machine will be replaced in 2023. This is expected to lead to a significant reduction in energy consumption for cooling.
Chart 5a
Energy consumption – main building
(MWh)
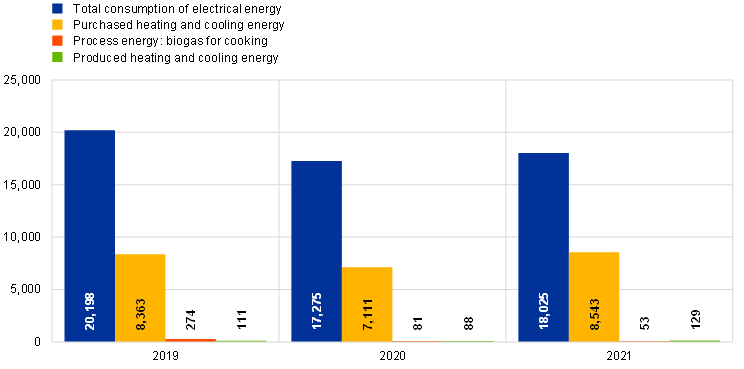
Source: ECB.
Chart 5b
Energy consumption – city centre buildings
(MWh)
Source: ECB.
Notes: Energy consumption at the external data centre is no longer included in this chart, as related emissions have been allocated to “purchased goods and services” as part of the expansion of Scope 3. For more information, see Section 5.2.
For more information on greenhouse gas emissions associated with energy consumption, see Section 5.1.
6.3 Material efficiency

Note: “New” = the objective has been introduced with the new EMP; “In progress” = objective in progress.

Note: “Completed” = measure completed; “In progress” = measure in progress; “Pending” = measure still to be implemented; “New” = measure was introduced with the new EMP.
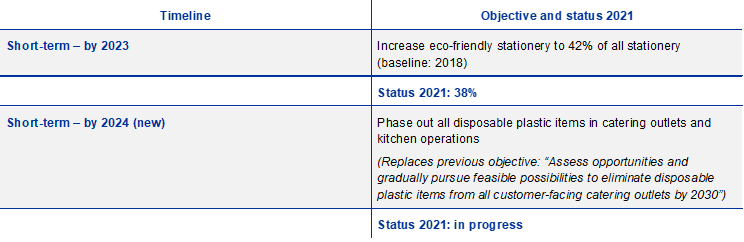
As part of its updated objectives, the ECB is aiming to phase out all disposable plastic items in catering outlets and kitchen operations by 2024 (going beyond the previous objective, which focused on customer-facing areas). Prior to March 2020, various individual packaging-reduction measures were successfully introduced and implemented in the catering areas. In response to the COVID-19 pandemic, some single-use items (such as takeaway containers and cups) were reintroduced for hygiene reasons as a temporary measure. However, these items were made from biodegradable materials, such as sugar cane. In addition, the reusable deposit system that was introduced for coffee cups in 2019 was extended to bowls and cutlery. The ECB plans to go back to limiting the use of disposable tableware and plastic packaging to the extent possible as hygiene measures are eased and have no disposable plastic items in any catering-related areas by 2024. In an effort to raise awareness among staff about the carbon footprints of their food choices, the CO2 emissions of the various dishes were displayed on canteen menus in 2021 as a pilot project, and caterers took part in initiatives such as the WWF Earth Hour and the European Week for Waste Reduction.
The consumption of publications, office paper, cleaning agents, office supplies and chemicals used for water treatment and cooling is described in the following sections. For details of related greenhouse gas emissions, see Section 5.2 (subsection on purchased goods and services).
6.3.1 Publications

Paper consumption for official ECB publications increased slightly in 2021, rising by 0.13 tonnes relative to the year before, but remained low compared with pre‑pandemic levels. As Chart 6 shows, paper consumption for official publications fluctuates from year to year, as it is highly dependent on the number and scale of external communication campaigns. The high level of consumption in 2019 was due to the introduction of the new €100 and €200 banknotes and the publication of related information material.
Chart 6
Paper consumption for official ECB publications
(tonnes)

Source: ECB.
Notes: In last year’s report, a figure of 0.53 tonnes was provided for 2020. In fact, that amount covered both 2020 (0.20 tonnes) and 2021 (0.33 tonnes).
6.3.2 Office paper

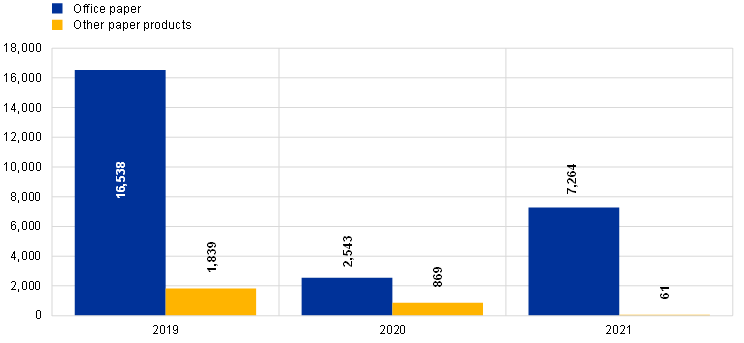
The fact that remote working was the default in 2021 further supported the digitalisation of processes across the organisation. The ECB undertook efforts to achieve further digitalisation of paper-based documentation (e.g. by continuing to roll out digital signatures across the organisation) in order to reduce paper consumption. Moreover, the ECB also reduced the environmental footprint of its paper consumption by using recycled paper, which accounted for 99.3% of all paper consumed. Consumption of office paper increased in 2021, but remained at a low level relative to 2019.
Other paper products (such as letterheads, calendars and notepads) make up less than 1% of total consumption, and their consumption decreased by 93.0% compared with the previous year. The production of business cards and notepads has been moved in house, which enables the ECB to better manage requests for such products (for instance, by only printing as many business cards as are needed).
Chart 7
Consumption of office paper and other paper products
(thousands of sheets (A4 equivalent))
Source: ECB.
6.3.3 Cleaning agents

The ECB continued to use biodegradable microbiological cleaning agents in 2021. Hand and surface disinfectant also remained in use for decontamination purposes. The overall consumption of cleaning agents at the main building and the city centre buildings declined by 66.5% and 80.3% respectively in 2021 relative to the previous year. However, this decrease was related to the fact that large quantities of cleaning agents had been procured in the previous year, limiting the quantity that needed to be ordered in 2021. The actual use of cleaning agents remained constant across 2020 and 2021, since areas were cleaned with the same frequency. Additional environmental measures were implemented in cooperation with the cleaning service provider by gradually replacing cleaning carts, carpets and other items with equivalent products made from recycled materials. Additionally, deliveries of detergent and carpet cleaning processes were optimised in order to reduce related emissions.
Chart 8
Consumption of cleaning agents
(tonnes)
Source: ECB.
6.3.4 Office supplies

To support the identification and use of environmentally friendly stationery, environmental labels are included in the ECB’s stationery catalogue. In 2021, 38% of all items in the catalogue were classified as eco-friendly stationery.
Furthermore, the ECB’s internal catalogue for reusable stationery has also contributed to a decrease in new external orders. The catalogue was updated in 2021, and ECB staff were encouraged to check whether desired items could be found in that catalogue before ordering new items. Moreover, staff were again made aware of the possibility of returning unused stationery and other office materials to the logistics storeroom so that these items could be reused. ECB employees were also informed about the environmental impact of ordering stationery and office supplies and how they could reduce it. A targeted campaign to limit new stationery orders was conducted in the context of an internal relocation exercise.
The ECB donates decommissioned IT equipment (laptops, monitors, phones, printers, etc.) to charities for reuse or recycling. Furthermore, 2021 also saw the conclusion of the ECB’s Plants-for-Printers campaign, with more than 150 desktop printers being phased out in the course of the year. This allowed the ECB to meet its material efficiency objective of having 0.5 printers for every 10 workplaces with a delay of just one year, achieving 0.4 printers per 10 workplaces.
6.3.5 Chemicals for water treatment and cooling agents

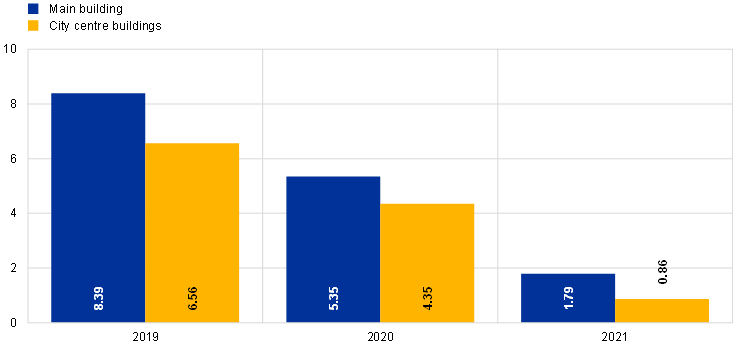
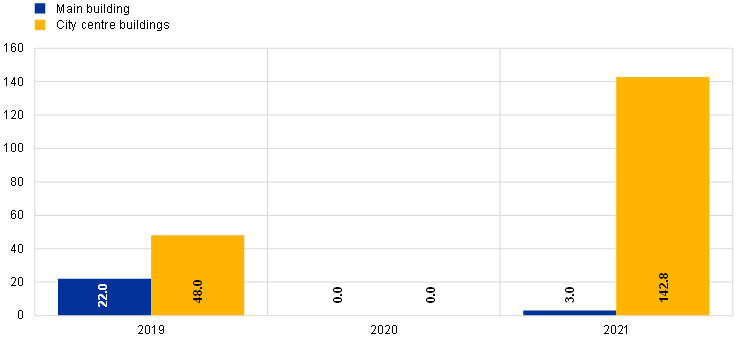
The use of chemicals for water treatment remained constant in the main building in 2021, but it increased by 16% in the city centre buildings relative to 2020. At the same time, however, 2020 saw the Japan Center using leftover stocks from 2019, which partly explains the differences between the consumption levels in 2020 and 2021.
Although cooling systems are regularly inspected and maintained, 145.8 kg of cooling agent leakages were detected in 2021 (142.8 kg at the Eurotower and 3 kg in the main building). A detailed investigation of the root causes of those leakages is ongoing and preventive measures will be taken to avoid similar incidents in the future.
Chart 9
Chemicals used for water treatment
(tonnes)

Source: ECB.
Chart 10
Cooling agent losses
(kilograms)
Source: ECB.
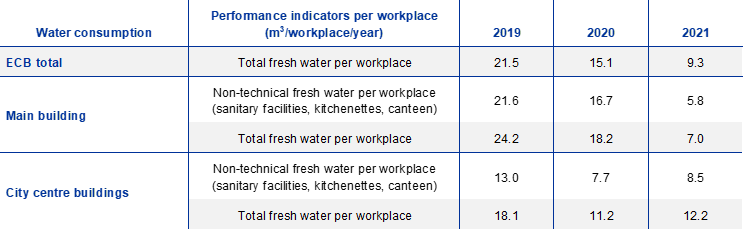
6.4 Water and waste water

The low occupancy rates of the various buildings resulted in a significant decrease in water consumption. However, regular flushing of the water pipes was carried out in order to comply with hygiene regulations. In 2021 a water filtration system was installed to recycle water from cleaning services. It is estimated that the water can be recycled up to 100 times through the use of microorganisms, and this could lead to a saving of approximately 25,000 litres of water annually.
Water consumption at the ECB consists of both technical and non-technical water. Technical water is used for the buildings’ climate control, while non-technical water is used in sanitary facilities, kitchenettes and canteens. At the main building, non‑technical water is also used for the irrigation of green areas. This difference needs to be taken into account when comparing the water consumption of the city centre premises and the main building.

At the main building, the low occupancy rate resulted in a significant (62.5%) decrease in fresh water consumption in 2021 relative to the previous year (with consumption of technical water falling by 22.3% and consumption of non-technical water falling by 66.1%). The maintenance of green areas accounts for a considerable percentage of the ECB’s non-technical water consumption. However, the ECB replaces some of this with rainwater collected from the roof of the Grossmarkthalle, which is used both for irrigation and for sanitary facilities on the lower floors. When interpreting the reduced water consumption relative to the previous year, it must be borne in mind that the summer months were significantly warmer and drier in 2020 than in 2021. Accordingly, more fresh water had to be used in 2020 for the irrigation of outdoor areas. In 2021 measures were also implemented to reduce outdoor water consumption. For example, irrigation bags were installed for trees, and lawns were not watered during the summer months.

At the city centre premises, total fresh water consumption increased by 6.4% relative to 2020. Consumption of technical fresh water increased by 0.1%, while consumption of non-technical water rose by 9.4%. The increased water consumption in the Eurotower can be attributed primarily to the regular flushing of water pipes to meet hygiene requirements.

Chart 11a
Water consumption – main building
(m³)
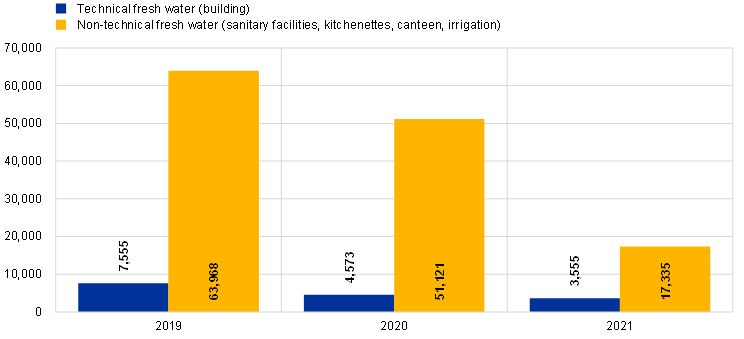
Source: ECB.
Chart 11b
Water consumption – city centre buildings
(m³)
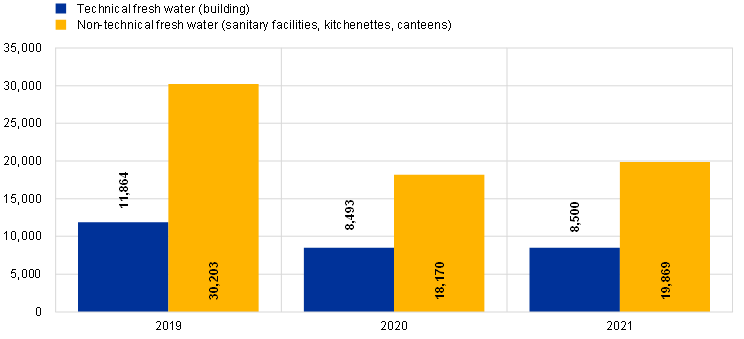
Source: ECB.
For more information on greenhouse gas emissions associated with water and waste water, see Section 5.2 (subsection on purchased goods and services).
6.5 Waste and recycling

Note: The strong decrease in 2021 was due to the limited on-site presence during the pandemic.

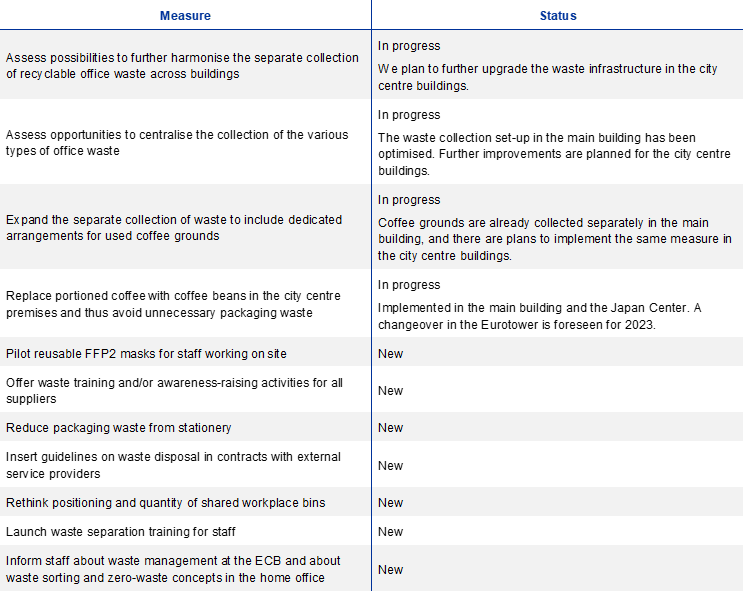
Note: “Completed” = measure completed; “In progress” = measure in progress; “Pending” = measure still to be implemented; “New” = measure was introduced with the new EMP.
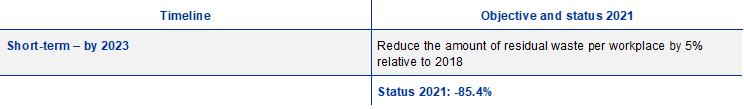
Waste avoidance, waste reduction and increases in recycling rates all have an important role to play in terms of minimising the ECB’s environmental impact. The ECB has set itself a target of reducing its residual waste by 5% per workplace by 2023 relative to 2018 levels. To achieve this target, various measures have been taken to raise awareness among staff and external service providers about proper waste separation and recycling and to improve the waste infrastructure on the ECB’s premises, and further improvement measures are planned.
Hygiene and safety requirements related to the COVID-19 pandemic generated additional waste on the ECB’s premises, such as packaging waste and personal protective equipment (gloves, face masks, test kits, etc.). However, total waste amounted to 370.6 tonnes, a decline of 27.0% compared with the previous year, mainly owing to the low occupancy levels of the ECB buildings.
Non-hazardous waste[12] accounted for almost 83% of total waste generation in 2021, corresponding to 307 tonnes. Materials such as plastic packaging, organic waste, residual waste, paper and cardboard, and confidential paper waste are included in this category.
Hazardous waste made up the remaining 17%, corresponding to 63.6 tonnes. That hazardous waste comprised 38.6 tonnes of electronic waste and 25.0 tonnes of other hazardous waste (which consisted mainly of batteries). IT waste increased from 18 tonnes in 2020 to 35.7 tonnes in 2021, owing to, among other things, the changes made in the ECB’s data centre environment in late 2021 and the consequent disposal of obsolete equipment. Nevertheless, wherever feasible, furniture and technical equipment have been reused as much as possible.

The total amount of waste at the main building decreased by 8.6% in 2021 when compared with the previous year. Reductions were observed for all categories apart from paper and cardboard waste (which increased by 44.2%, mostly owing to cardboard boxes used for technical equipment that was newly installed or relocated in 2021).

The total amount of waste generated by the city centre buildings decreased by 50.6% in 2021 when compared with the previous year. There has been a downward trend in almost all waste categories since 2019. One exception is confidential paper waste, which increased by 50.4% compared with 2020 owing to the internal relocation of over 1,700 workplaces. To improve waste management at building level and achieve a consistent approach to waste management across all of its buildings, the ECB took over the contracting of waste disposal services for the city centre buildings as of July 2021. Previously, this service had been contracted and managed by the buildings’ owners.
Chart 12a
Waste and recycling – main building
(tonnes)
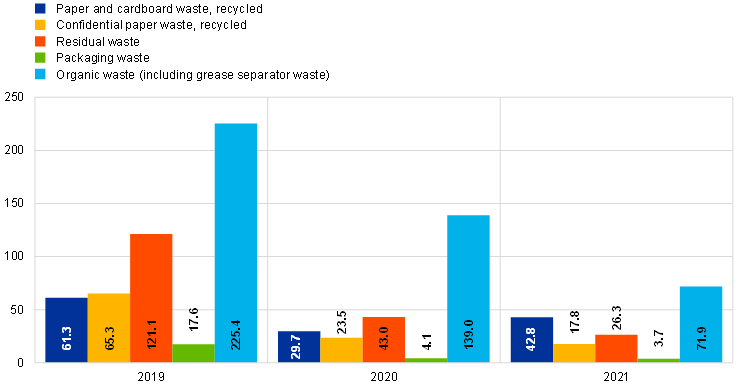
Source: ECB.
Chart 12b
Waste and recycling – city centre buildings
(tonnes)

Source: ECB.
For more information on greenhouse gas emissions associated with waste, see Section 5.2.
Table 3
Waste types as per the German Commercial Waste Ordinance
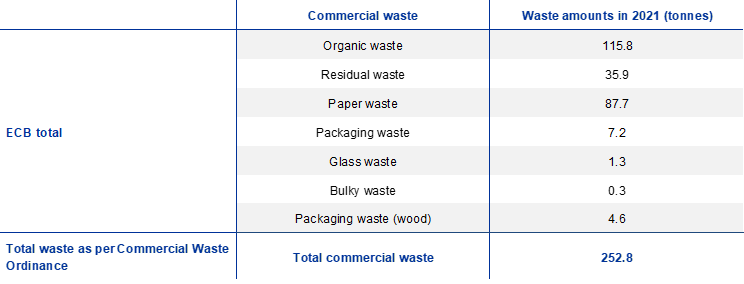
Note: Waste amounts displayed in Table 3 partly differ from amounts displayed in Charts 12a and 12b owing to the different categorisation of waste as per the Commercial Waste Ordinance: organic waste does not include grease separator waste; packaging waste does not include packaging waste disposed of via the German dual system “Der Grüne Punkt”; paper waste includes both paper and cardboard waste and confidential paper waste.
Total waste as per the German Commercial Waste Ordinance amounted to 252.8 tonnes in 2021. Of this, separately collected commercial waste (i.e. excluding residual waste) amounted to 216.9 tonnes. As such, separately collected commercial waste accounted for 84.8% of total waste as per the Commercial Waste Ordinance in 2021.
6.6 Biodiversity


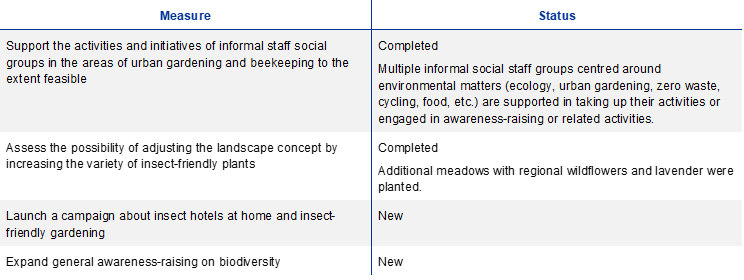
Note: “Completed” = measure completed; “In progress” = measure in progress; “Pending” = measure still to be implemented; “New” = measure was introduced with the new EMP.

In 2021 various measures were taken to further foster biodiversity in the grounds of the ECB’s main building: additional meadows with regional wildflowers and lavender were planted, providing an ideal habitat and food source for the bees that were introduced on site in 2020, as well as wild bees, butterflies and other insects. The bird and bat houses and the insect and wild bee hotels, which have been in place for several years, are regularly maintained and showcased within the ECB to raise staff awareness of the importance of biodiversity and its protection.
In order to conserve water, the lawns in the grounds of the main building were not watered in the summer of 2021. Instead, watering bags were fitted around the trees, which release water slowly and continuously in a targeted manner, enabling deep water saturation, stimulating root growth and ensuring sufficient hydration for the trees even during warm periods. Rainwater from the roof of the Grossmarkthalle, which is collected in a rainwater storage tank, is also used for irrigation purposes and for the sanitary facilities on the lower floors of the Grossmarkthalle and the main building. In addition, tree protection paint was applied to 80 vulnerable trees on site to protect them from severe weather conditions and ensure their well-being.
Owing to the ECB’s remote working regime, many on-site activities were restricted in 2021. However, a staff-led urban gardening project group started working on the first raised vegetable bed in the garden of the main building. Various awareness-raising activities centred on the theme of biodiversity also took place in 2021. For example, the Green ECB team organised a Biodiversity Week for all staff on the occasion of the United Nations’ International Day for Biological Diversity in May 2021 (see Section 6.10). In addition, an online session to inform staff and raise their awareness of urban gardening and circularity took place as part of the European Week for Waste Reduction in November 2021.
6.7 Banknotes

As part of the Eurosystem’s cash strategy, the ECB endeavours to improve the safety and sustainability of euro banknotes throughout the cash cycle.
The ECB and the NCBs of the Eurosystem have the exclusive right to authorise the issuance of banknotes within the euro area. At the end of 2021 there were 28.2 billion euro banknotes in circulation.
The ECB’s Directorate Banknotes coordinates, monitors and regulates the design, production and circulation of euro banknotes. The ECB promotes good environmental management and seeks to avoid any risk to the health and safety of the general public and the workers involved in the production and circulation of euro banknotes. All manufacturers producing euro banknotes and the main raw materials must provide the ECB with copies of their ISO 9001, ISO 14001 and ISO 45001 certificates to show that they conform to the applicable standards for quality, environmental management, and health and safety. The Directorate Banknotes also assesses the environmental impact of the production processes.
Based on this assessment, the ECB and Eurosystem NCBs are implementing policies to further minimise the environmental impact of euro banknotes. For example, in 2021 approximately 70% of the 5,500 tonnes of cotton fibres that were used to produce euro banknote paper originated from environmentally and socially sustainable sources. The ECB is firmly committed to increasing the amount of sustainable cotton in euro banknote paper to 100%.
A series of research and development projects are being undertaken to improve the environmental sustainability of current and future euro banknotes, including by increasing their circulation lifetime and by reducing the environmental impact of both (i) the production of raw materials and (ii) their end-of-life treatment. The ECB is engaging with all stakeholders to identify potential improvements and solutions as regards the environmental sustainability of euro banknotes throughout the cash cycle.
Detailed information on the environmental impact of euro banknotes is provided on the ECB’s website in the section on “The euro”.
6.8 Green public procurement


Note: The 2021 status only reflects figures for 2021 itself, rather than the three-year average.
“Green procurement procedures” means procurement procedures that include environmental considerations (i) in the contract subject matter, (ii) in the technical specifications and requirements, (iii) through environmental selection and award criteria, (iv) by means of contract performance clauses, or (v) through a combination of (i) to (iv).
“ECB procurement procedures” means public tender procedures, three/five-quote procedures and direct awards on the basis of Articles 2 and 6 of the ECB’s rules on procurement.

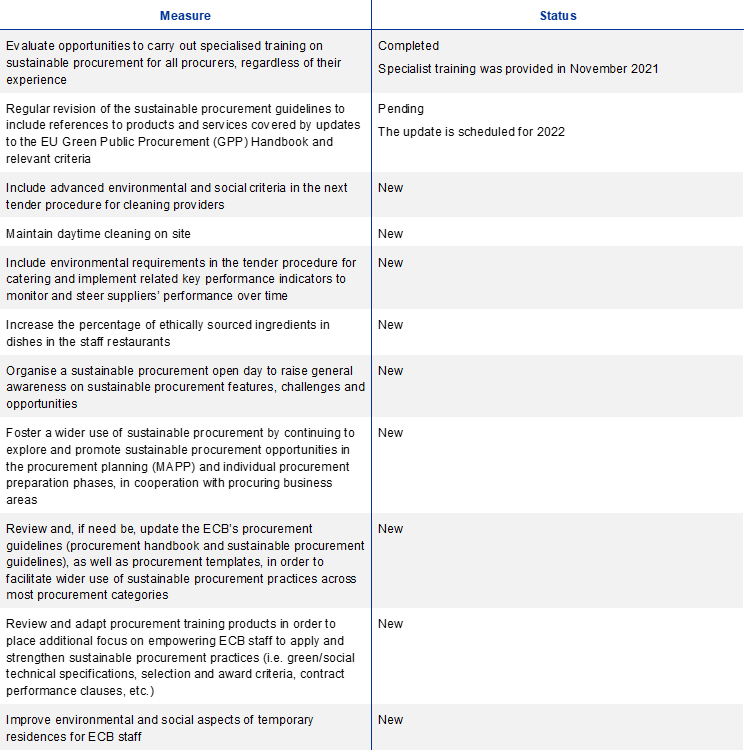
Note: “Completed” = measure completed; “In progress” = measure in progress; “Pending” = measure still to be implemented; “New” = measure was introduced with the new EMP.

Green public procurement is an important tool for fostering best environmental practices within the ECB’s value chain and limiting the environmental impact of procured goods, work and services. As a public institution, the ECB wants to ensure that environmental aspects are taken into account in its procurement procedures, and it adopts a variety of environmental strategies and approaches depending on the nature and relevance of each procedure. Environmental criteria are included in procurement specifications and contracts for tender procedures with a significant environmental impact (such as contracts for cleaning, catering and facility management services). There is a specific focus on tender procedures for services with a significant environmental impact; nevertheless, efforts to make procurement green also extend more widely, with requirements in terms of the way that goods, work or services must be produced or delivered or contracts must be performed, requests for technical standards or labels, and the use of green selection and evaluation criteria.
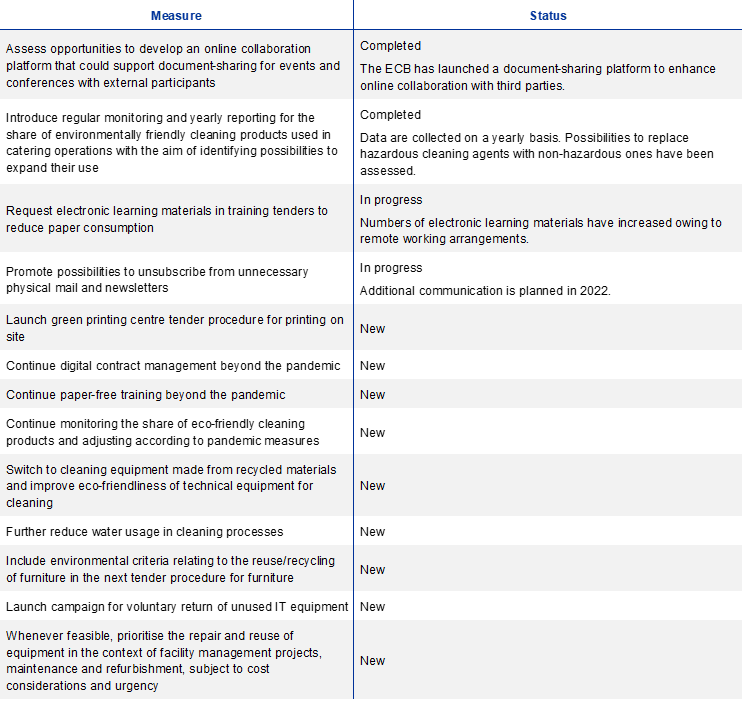
In 2021, the ECB conducted 795 procurement procedures, 59 of which included environmental considerations. The number of electronic tender procedures increased from 61 in 2020 to 82 in 2021. In 2021, all public tender procedures were carried out via the ECB’s e-tendering platform. In the medium to longer term, the ECB plans to digitalise additional procurement procedures (low-value procurement, call-offs, etc.) and carry them out via the next-generation e-tendering platform. In the short term, as an interim measure, the ECB has started carrying out such procurement procedures electronically via a document-sharing platform accessible by third parties or through email-based e-communication and e-submission. Additionally, electronic signatures for contracts, purchase orders and outcome letters in procurement procedures are gradually being rolled out across the entire institution, with the aim of making this a standard practice beyond the pandemic. In 2021, approximately 90% of contracts were signed electronically.
Environmental criteria were again included in relevant procurement procedures, such as the procurement of copy paper, print centre services, waste management, warehousing and logistics services. Over the three years to 2021, procurement requests including environmental considerations accounted for 7.5% of all procurement requests registered with the Central Procurement Office, up from 7.3% in the three years to 2020.
Going forward, the new green procurement measures aim to foster the wider use of sustainable procurement thanks to awareness-raising activities and training opportunities, as well as by reviewing and adapting existing products and guidelines to strengthen the ECB’s administrative capacities in this regard. In order to better reflect the actual share and weight of green procurement in the overall numbers and to strengthen the ECB’s commitment to sustainable procurement practices, the existing objective has been replaced with a new target, which aims to have procurement procedures with environmental considerations account for at least 22.5% of all public tender procedures, three/five-quote procedures and direct awards. Compliance with the updated objective is measured using a new methodology which filters out automatic contract extensions and amendments, which should not be regarded as new procurement procedures. On the basis of this new methodology, procurement procedures including environmental considerations accounted for 18.2% of all procurement in 2021. Additionally, the ECB is seeking to increase the value of procurement procedures including environmental considerations, aiming to have them account for at least 25% of the total value of all procurement over the period 2022-24.
Training and awareness-raising sessions on green public procurement were again organised in 2021. A total of 136 participants took part in such online training sessions, up from just 13 in 2020.
Like other EU institutions and bodies, the ECB also uses the services of the Green Public Procurement Helpdesk, which provides customised support and serves as a knowledge base for best practices.
6.9 Travel

The ECB’s travel activities continued to be restricted in 2021, with business travel taking place strictly on an exceptional basis owing to the pandemic.
Consequently, emissions relating to business travel decreased by a further 78.5% relative to 2020. As 2021 data relating to international train travel were incomplete, 2020 data were used for the calculation of 2021 CO2 emissions from international train travel. Given that 2021 was the first full year of the pandemic and international travel was limited, this share is likely to be an overestimate. Air travel continued to make up the largest part of these emissions, accounting for 85% of total business travel emissions in 2021.
As part of the extension of its carbon footprint boundary, the ECB upgraded its accounting methodology for travel-related emissions and now also reports on radiative forcing for air travel and WTT emissions for aviation and other means of transport. For further details, see Section 5.2.
Aside from business travel, emissions from travel by conference participants have been re-included in the ECB’s carbon footprint as part of the overall revision of its carbon footprint boundary, as described in Section 5.2. Those emissions from travel by conference participants also include radiative forcing and WTT emissions. However, no on-site events or conferences with external participants took place in 2021 owing to the strict limits on on-site activities as a result of the pandemic. To reduce the environmental impact of meeting participants’ travel, the ECB is now aiming to limit the number of physical meetings of ESCB committees and their substructures to 50% of total planned meetings. Furthermore, additional online collaboration tools were made available in 2021. In order to promote hybrid and virtual meetings, further meeting rooms were fitted with videoconferencing technology and equipment, increasing the percentage of on-floor meeting rooms equipped with such technology to 54%.
In order to prevent travel-related emissions from rebounding strongly when pandemic-related restrictions are lifted, several measures have been put in place. The ECB’s travel policy is due to undergo a revision aimed at reducing travel and further promoting the use of less carbon-intensive means of transport. Additionally, data dashboards have been made available to business areas to allow them to monitor and steer their travel activities in order to reduce the corresponding emissions. Looking ahead, the ECB is aiming to keep business travel-related emissions at 60% or less of the pre-pandemic levels seen in 2019 and plans to work closely with its main travelling business areas to identify further opportunities to reduce emissions from business travel in the long term.
As remote working continued to be the default arrangement owing to the pandemic, staff commutes to and from the ECB’s premises were limited. In 2021, a teleworking and commuting survey was conducted to obtain information about staff’s commuting behaviour before and during the pandemic, as well as teleworking habits, in an effort to reveal potential additional environmental impacts resulting from the extended teleworking regime. The survey approach was found to be suitable given the special circumstances surrounding commuting and teleworking during the pandemic and the data sources available. According to the results of the survey, commuting habits were substantially different in 2020 and 2021, with most staff commuting less frequently to the ECB premises, but tending to travel longer distances. The survey included questions on staff travel behaviour beyond the commute to the office in order to gain insight into related environmental impacts that could inform the development of future guidelines on remote working. Since the majority of ECB staff have been working from home since the start of the pandemic, the survey also included questions on staff’s teleworking habits and situations in order to estimate and update emissions associated with energy consumption as a result of teleworking. The calculation of teleworking emissions takes account of energy consumption by office devices (laptops, monitors, desktop computers, phones, tablets, routers, etc.), as well as lighting, cooling and heating. Heating makes up the largest percentage of teleworking emissions, accounting for 83% in 2021. The calculation of emissions only factors in additional environmental impacts that are a direct result of teleworking.
The greenhouse gas emissions that are associated with teleworking and staff commutes are described in Section 5.2.
6.10 Communication, engagement and awareness-raising

Note: “New” = the objective has been introduced with the new EMP.
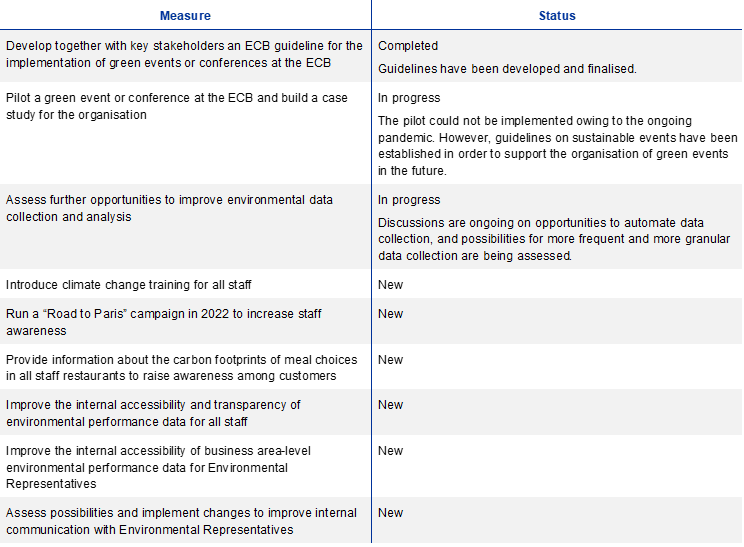
Note: “Completed” = measure completed; “In progress” = measure in progress; “Pending” = measure still to be implemented; “New” = measure was introduced with the new EMP
Communication on environmental topics remained an integral part of the ECB’s EMS in 2021. All awareness-raising activities were carried out online, including expert talks, informative articles, workshops and quizzes.
In March 2021, for the tenth consecutive year, the ECB joined other institutions and organisations in Frankfurt and around the world in participating in the WWF Earth Hour, symbolically switching off all non-essential lighting on its premises to raise awareness about climate change and providing low-energy-consumption food (and recipes) to all staff. In May 2021, the ECB then celebrated its first Biodiversity Week, raising staff’s awareness of biodiversity loss and the overexploitation of resources. Staff members were invited to attend a talk about health and sustainable diets, learned more about the ECB’s beehives through an interview with its beekeeper and submitted pictures of their own biodiversity discoveries as part of a photo challenge. On the occasion of the 20th European Mobility Week, the Green ECB team organised a series of virtual events and activities on the topic of sustainable mobility. In addition to two expert talks and an audio quiz containing facts about sustainable mobility, staff shared details of their favourite hiking and biking routes in the Frankfurt area. “Reduce, Reuse and Recycle” was the key message during the European Week for Waste Reduction in November 2021, which saw staff attend a talk on the impact of urban gardening, circularity and waste reduction, take part in a waste-sorting quiz and pledge to only use reusable takeaway containers and coffee cups during the week.
Regular communication on awareness-raising activities is maintained and supported by the ECB’s Environmental Representatives. They play a pivotal role by encouraging and fostering environmentally friendly behaviour within their individual business areas and the ECB as a whole and act as direct contact persons for their colleagues with regard to environmental topics. In 2021, Environmental Representatives again ran separate awareness-raising activities independently of the centrally organised events, with such activities including presentations, green newsletters and business area challenges.
The ECB regularly fosters and engages in exchanges with peer organisations, both bilaterally and within interinstitutional networks, in order to collaborate on and share experiences and best practices. Two important networks in this regard are the environmental network for European institutions (GIME) and the Environmental Network of Central Banks (ENCB). The latter brings together NCBs from across the Eurosystem and has for many years served as a fruitful platform for exchanges on environmentally relevant topics and best environmental management practices. Although one additional NCB joined the ENCB in 2021, the ECB’s objective of getting all ESCB NCBs to participate in the interinstitutional group by 2020 could not be achieved. Given that the ECB’s ability to influence this objective is limited, the objective has been replaced with a new one aimed at fostering interinstitutional collaboration by facilitating at least two ENCB meetings per year. The ECB plans to hold these meetings online to set an example and reduce travel-related emissions beyond the pandemic.
Read more about EMAS in the European institutions.
7 Technical information
The previous chapters reported and explained developments and measures relating to the ECB’s most important environmental aspects. In accordance with the EMAS Regulation,[13] this next chapter presents additional data on the ECB’s environmental performance.
Overview of numbers of workplaces
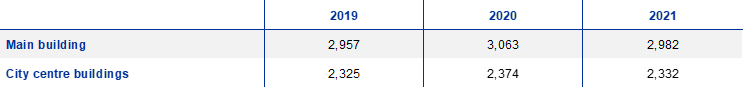
Source: ECB.
Notes: Workplace-based indicators are a reporting requirement for EMAS. However, it should be borne in mind that the majority of staff teleworked in 2020 and 2021 on account of the pandemic and on-site presence was highly restricted. Consequently, the workplace-based indicators provided in this report may not be representative of actual developments.
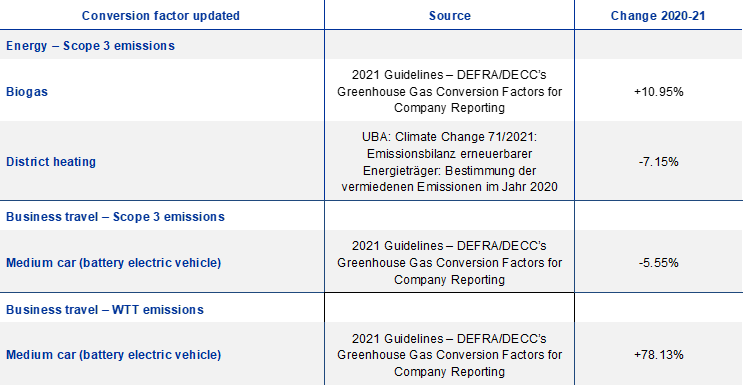
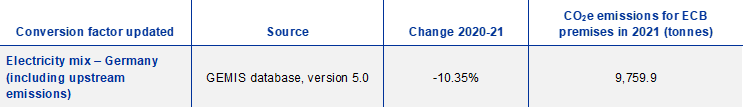
7.1 Updates to conversion factors
The table below shows percentage changes from 2020 to 2021 for the CO2 emission conversion factors that were used to calculate the emissions reported in the previous chapters. While most conversion factors are updated periodically, only factors that have changed by more than 5% relative to the previous reporting year are displayed below in order to provide additional explanations for developments described in this statement. The year-on-year differences are based on the most recent factors from the corresponding sources.[14]
Location-based emissions
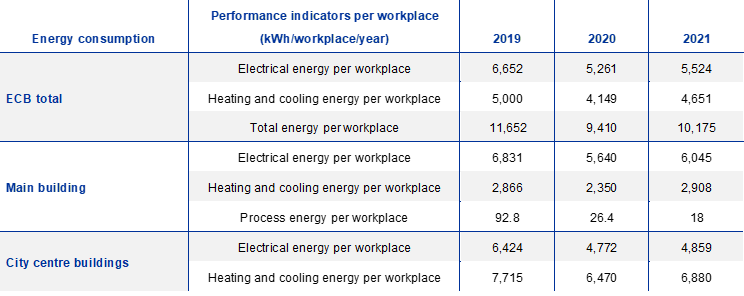
7.2 Workplace-based environmental performance indicators, 2019-21
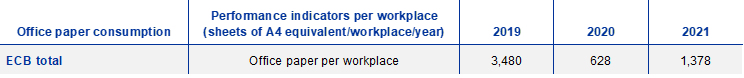
Note: This includes the consumption of other paper products (such as letterheads, calendars and notepads).

Notes: * The figures for hazardous waste per workplace for 2019 and 2020 have been adjusted on the basis of an improvement to the monitoring and reporting process. The figure for 2019 has been changed from 2.55 kg to 3.79 kg, and the figure for 2020 has been changed from 0.18 kg to 3.61 kg. The 2020 figure for non-hazardous waste per workplace has been changed from 90.0 kg to 89.9 kg.

Notes: * Emissions from natural gas have been adjusted from 536.4 kg to 525.9 kg for 2019 and from 481.8 kg to 478.8 kg for 2020 to account for the use of biogas in the main building’s kitchen operations. Emissions from business travel now also include RFI and WTT emissions, as well as emissions from hotel stays. Following the extension of the carbon footprint boundary, total CO2 emissions per workplace have been changed from 2,037 kg to 7,107 kg for 2019 and from 1,085 kg to 3,300 kg for 2020.

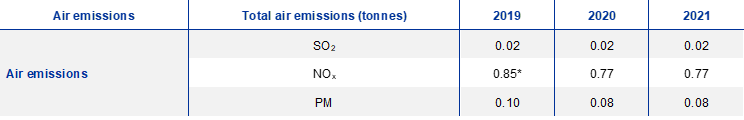
Notes: * The figures for NOx per workplace have been changed from 0.165 kg to 0.162 kg for 2019 and from 0.142 kg to 0.141 kg for 2020 on the basis of an improvement to the monitoring and reporting process. Total NOx emissions for 2019 have been changed from 0.87 tonnes to 0.85 tonnes.

7.3 Uncertainty assessment for the ECB’s carbon footprint in 2021
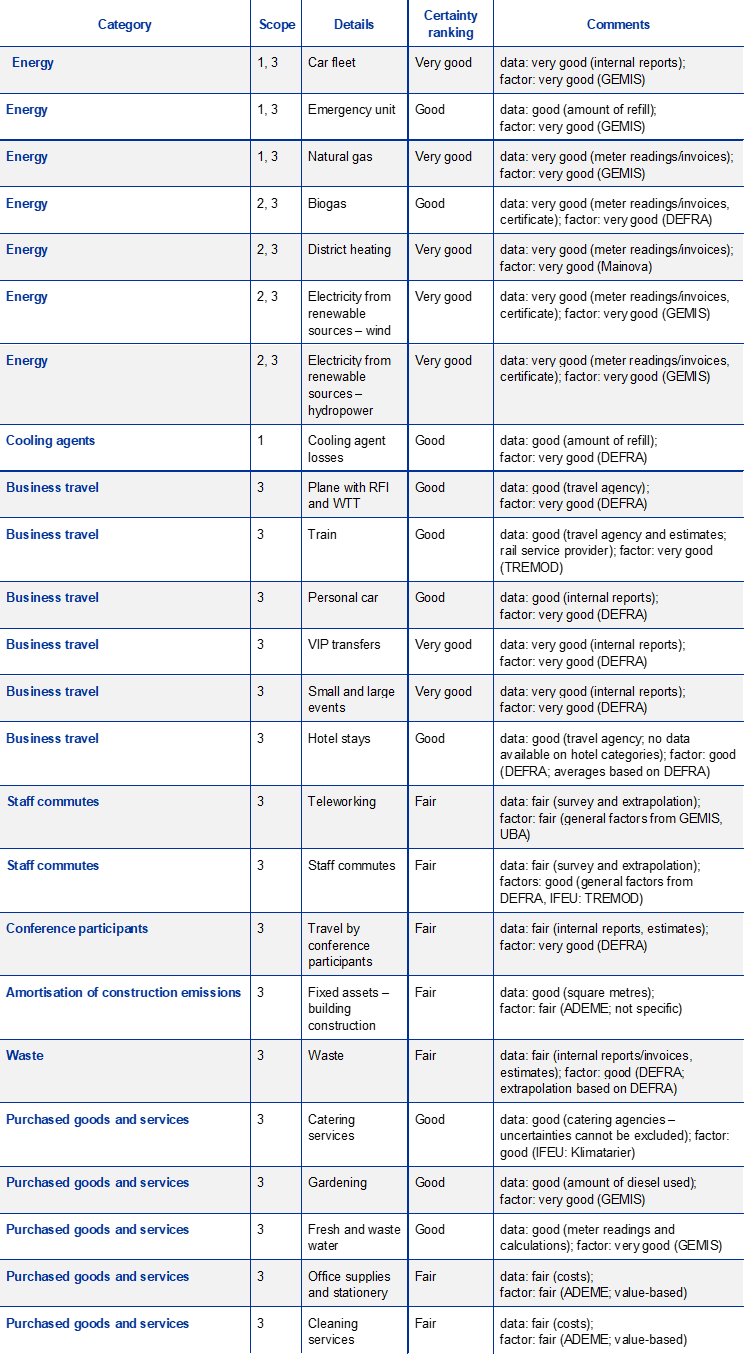
The ranking below has been used to estimate the uncertainty surrounding activity data and emission factors:

7.4 Compliance obligations

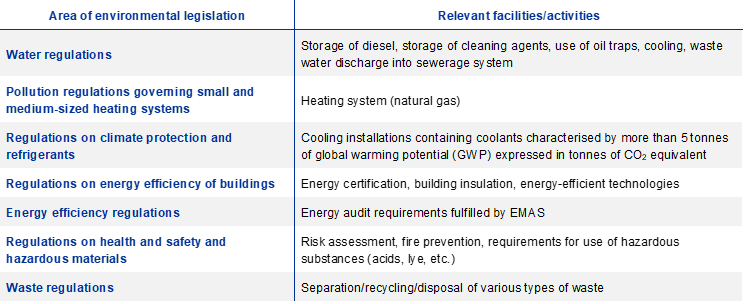
German national and municipal regulations specify the environmental compliance obligations that have to be met by the ECB. These are summarised in a register, which is regularly reviewed and updated by legal experts. Relevant changes and required measures are monitored to ensure compliance with these environmental regulations. The majority of the ECB’s compliance obligations relate to the operation and maintenance of its premises, as well as contracted services such as cleaning and catering. Internal verification is carried out on an annual basis to assess the ECB’s environmental compliance. To date, no deviations from legal requirements have been identified during these internal verification checks.
Table 4
Key areas of environmental legislation and related facilities/activities
In addition to these legal obligations, the ECB has also committed itself to complying with other environmentally relevant obligations, such as the guidelines on sustainable procurement and the need to meet the objectives of its Environmental Management Programme. Staff awareness of relevant environmental issues is also raised through a variety of communication campaigns.
The ECB’s website provides further information about climate change and the ECB’s action in this area under its mandate.
8 Environmental verifier’s declaration
The environmental verifier named below confirms that the European Central Bank (ECB) premises at Sonnemannstrasse 20, 60314 Frankfurt am Main, Germany (main building), Taunustor 2, 60311 Frankfurt am Main, Germany (Japan Center) and Kaiserstrasse 29, 60311 Frankfurt am Main, Germany (Eurotower), as described in this Environmental Statement by the ECB (which has the registration number D‑125‑00045), meet all of the requirements laid down in Regulation (EC) No 1221/2009 of the European Parliament and of the Council of 25 November 2009, as amended on 28 August 2017 and 19 December 2018, on the voluntary participation by organisations in a Community eco-management and audit scheme (EMAS).

In signing this declaration, I confirm that:
- the assessment and validation have been carried out in full compliance with the requirements of Regulation (EC) No 1221/2009, as amended by Commission Regulation (EU) 2017/1505 and Commission Regulation (EU) 2018/2026;
- the assessment has found no evidence of non-compliance with applicable environmental legislation;
- the data and information in this Environmental Statement provide a reliable, credible and accurate picture of all of the organisation’s activities.
This declaration cannot be equated with EMAS registration. EMAS registration can only be carried out by a competent body in accordance with Regulation (EC) No 1221/2009. This declaration may not be used as a stand-alone piece of public communication.

DisclaimerThis ECB Environmental Statement provides information to the general public and other interested parties about the environmental performance and activities of the European Central Bank (ECB) in 2021. It can be found on the ECB’s website (see the page entitled “Environmental protection at the ECB”).The ECB was first validated under the EU Eco-Management and Audit Scheme (EMAS) in 2010. This Environmental Statement, which is the 13th to be produced within the EMAS validation cycle, is the fifth consolidated statement (after previous statements in 2010, 2013, 2016 and 2019).This Environmental Statement was drafted in accordance with EMAS standards as set out in Regulation (EC) No 1221/2009 and the updated annexes to the EMAS Regulation pursuant to Regulation (EC) 2017/1505.
© European Central Bank, 2022
Postal address 60640 Frankfurt am Main, Germany
Telephone +49 69 1344 0
Website www.ecb.europa.eu
All rights reserved. Reproduction for educational and non-commercial purposes is permitted provided that the source is acknowledged.
For specific terminology please refer to the ECB glossary (available in English only).
The EMS does not cover the ECB’s representative offices in Brussels, London and Washington DC.
See ECB Annual Report 2021, April 2022.
Annexes I, II and III to Regulation (EC) No 1221/2009 were amended in 2017 to include changes associated with the revision of ISO 14001:2015. In addition, Commission Regulation (EU) 2017/1505 entered into force in September 2017, and an amendment to Annex IV entered into force in January 2019 pursuant to Commission Regulation (EU) 2018/2026.
The trajectory towards the ECB’s 2030 target has been informed by the Science-Based Targets initiative and the Business Ambition for 1.5°C guidelines.
The Greenhouse Gas Protocol is a commonly used international accounting standard for reporting and managing greenhouse gas emissions.
GIME is an interinstitutional environmental management group chaired by the European Commission, which also features other EU institutions and bodies.
Location-based emissions, which take into account the emissions from the German energy grid, are reported in Section 7.1.
WTT emissions are upstream emissions (e.g. from the production and distribution of fuels).
In relation to air travel, radiative forcing is defined as the sum of all forcings, including direct emissions (e.g. CO2 and soot) and indirect atmospheric responses (e.g. methane, ozone, sulphate and contrails), and, as such, the RFI is a measure of aircraft-induced climate change other than that derived from the release of fossil carbon. See Penner, J.E., Lister, D.H., Griggs, D.J., Dokken, D.J. and McFarland, M. (eds.), “Aviation and the Global Atmosphere”, Intergovernmental Panel on Climate Change, 1999, Section 6.2.2.
Following the implementation of a more detailed survey and an update to the accounting methodology, staff commuting emissions were adjusted retrospectively from 1,523.6 to 2,843.2 tonnes of CO2 equivalent for 2019, and from 880.3 to 1,644.8 tonnes of CO2 equivalent for 2020.
The assessment of the significant environmental aspects was carried out in accordance with the criteria listed in Annex I of Regulation (EC) No 1221/2009, as amended by Commission Regulation (EU) 2017/1505. Information on ongoing climate change-related work at the ECB within the scope of its mandate and areas of competence is disclosed in Section 11.5 of the ECB’s Annual Report 2021.
Including waste fractions in accordance with the German Commercial Waste Ordinance (Gewerbeabfallverordnung).
Conversion factors are provided by: the UK government’s Department for Environment, Food and Rural Affairs (DEFRA) and the Department of Energy and Climate Change (DECC); the German Environment Agency (UBA); the ECB’s energy supplier, Mainova; Deutsche Bahn; the Global Emissions Model for Integrated Systems (GEMIS); L’Agence de l’environnement et de la maîtrise de l’énergie (ADEME); the Institute for Applied Ecology (Öko-Institut) and the Institute for Energy and Environmental Research (IFEU Institute).
-
28 July 2023
-
16 August 2024