
Foreword

This 18th annual review of the international role of the euro published by the ECB presents an overview of developments in the use of the euro by non-euro area residents.
This report covers developments in 2018 and early 2019. This period was characterised by growing concerns about the impact of international trade tensions, a protracted slowdown in global growth, reversals in cross-border capital flows and challenges to multilateralism, including the imposition of unilateral sanctions. On balance, these developments, together with progress towards deepening Economic and Monetary Union (EMU), seem to have had a positive effect on the international use of the euro, which showed tentative signs of recovering from historic lows. In particular, the euro’s share in global foreign exchange reserves, international debt issuance and international deposits increased, as did its share in outstanding amounts of international loans. Its use as an invoicing currency remained broadly stable, as did shipments of euro banknotes to destinations outside the euro area.
The European Commission has launched an initiative to strengthen the international role of the euro and issued a Communication to this effect on 5 December 2018. Like the Commission, the Eurosystem stresses that the international role of the euro is primarily supported by a deeper and more complete EMU, including advancing the capital markets union, in the context of the pursuit of sound economic policies in the euro area. The Eurosystem supports these policies and emphasises the need for further efforts to complete EMU.
The ECB will continue to monitor developments in and publish information on the international role of the euro on a regular basis.
Mario Draghi
President
1 Main findings
In 2018 and early 2019, there were tentative signs of a recovery in the international use of the euro, with a composite index of the euro’s international role increasing in the review period, albeit from historic lows (see Chart 1). The euro remained unchallenged as the second most important currency in the international monetary system (see Chart 2).
The share of the euro in global foreign exchange reserves rose in 2018 by more than 1 percentage point (see Table 1). Several emerging market economies sold foreign exchange reserves to stabilise their domestic currencies amid tighter financial conditions and reversals in capital flows. A large part of those interventions took place in US dollars, mechanically underpinning the share of the euro in global foreign exchange reserves. Tentative evidence suggests that concerns about unilateral sanctions may have been another factor supporting diversification of the reserve portfolios of some central banks, such as the Central Bank of Russia. To some extent, these concerns may also have contributed to a 0.5 percentage point increase in the share of the euro in international deposits.
Additional indicators tracked in this report show the share of the euro as having increased in the review period. One such indicator is international debt issuance. The share of the euro increased by more than 2 percentage points as a stronger US dollar exchange rate, together with higher US interest rates, raised concerns among international borrowers about higher debt servicing costs. Borrowers in emerging market economies markedly scaled back volumes of US dollar-denominated issuance to reduce exposures to US dollar exchange rate movements and risks arising from currency mismatches. By contrast, the role of the euro as an invoicing currency for extra-euro area trade transactions and shipments of euro banknotes to destinations outside the euro area remained broadly stable.
All in all, financial turbulence in some emerging market economies, growing concerns about the impact of international trade tensions and challenges to multilateralism, including the imposition of unilateral sanctions, seem to have lent support to the euro’s global standing over the review period. Moreover, euro area-specific developments, such as progress towards completing banking union and deepening EMU more generally, helped to further strengthen the euro area’s resilience and, in turn, to boost the attractiveness of the euro internationally.
The European Commission launched an initiative to strengthen the international role of the euro and issued a Communication to this effect on 5 December 2018. Like the Commission, the Eurosystem stresses that the international role of the euro is primarily supported by a deeper and more complete EMU, including advancing the capital markets union, in the context of the pursuit of sound economic policies in the euro area. The Eurosystem supports these policies and emphasises the need for further efforts to complete EMU.
This year’s report contains four special features. The first of these looks at developments since the start of Economic and Monetary Union 20 years ago, assessing the economic benefits and costs of the international role of the euro from a central banking perspective. In particular, it shows that the balance between these benefits and costs has shifted, with some of the traditional effects of international currency status having declined in relevance while others have become more apparent. As a result, changes in the global role of the euro may have consequences for the conduct of monetary policy, all of which must be understood and taken into account when designing euro area monetary policy.
The second special feature aims to quantify the “exorbitant privilege” of international currency status for major currencies. It explains that the relevant metric for this purpose is the share of foreign official holdings in the stock of outstanding highly rated debt – a metric for which the euro is at par with the US dollar. Estimates from a simple error-correction model that aims to disentangle long-run stock effects from short-run flow effects of net purchases of sovereign debt by foreign official reserve holders suggest that the “exorbitant privilege” enjoyed by the euro is economically significant. Foreign official reserve holdings of debt securities have compressed term premia on euro area long-term yields by around 110 basis points, which compares with around 160 basis points for US long-term yields. But foreign official holdings of euro area government debt are concentrated in the few euro area sovereigns issuing highly rated debt securities. Strengthening the credit quality of outstanding debt, notably by pursuing sound and sustainable fiscal policies, would contribute to increasing the supply of safe euro area debt and raising the euro’s global appeal. In the longer term, the creation of a common euro area safe asset, if so decided by Member States, in a way that does not undermine incentives for sound national fiscal policies, could also contribute to this objective. This, in turn, would help the euro’s “exorbitant privilege” to be more widely shared across euro area sovereigns.
The third special feature assesses the role of the US dollar in trade invoicing for the global transmission of US and euro area monetary policy shocks. It provides evidence on differences in shock transmission from the traditional perspective of producer currency pricing, in which exporters price products in their own currency, and from the dominant currency perspective, in which exporters and importers price products in a third currency, such as the US dollar. It provides simulations using ECB‑Global, the ECB’s main structural macroeconomic model, for the analysis of global spillovers. It shows that dominant currency pricing amplifies the effects of US monetary policy on US and global trade. By contrast, dominant currency pricing does not significantly alter the domestic effects of euro area monetary policy, but it does reduce the effects of euro area monetary policy on global exports.
The fourth special feature provides stylised facts on the relative importance of the euro and the US dollar as denomination currencies for cross-border bank positions, which is useful for understanding the international transmission of shocks. It focuses on 28 advanced and emerging market economies to analyse cross-country heterogeneity in the currency mix of banking systems using data from the locational banking statistics of the Bank for International Settlements (BIS). In addition to considering variations across countries and time in currency exposures, it studies their relation to the geography of cross-border banking and to the currency mix of local banking positions. The special feature identifies three main stylised facts, namely that the majority of national banking systems have larger net assets in euro than in US dollars, that dispersion in net currency exposures has declined, and that net cross-border exposures towards the euro and the US dollar are shaped by the geography of cross-border banking positions towards the euro area and partly mirror banks’ currency exposures in local positions.
Chart 1
The international role of the euro rose from historic lows in the review period
Composite index of the international role of the euro
(percentages; at current and Q4 2018 exchange rates; four-quarter moving averages)

Sources: BIS, IMF, CLS Bank International, Ilzetzki, Reinhart and Rogoff (2017) and ECB calculations.
Notes: Arithmetic average of the shares of the euro at constant (current) exchange rates in stocks of international bonds, loans by banks outside the euro area to borrowers outside the euro area, deposits with banks outside the euro area from creditors outside the euro area, foreign exchange settlements, global foreign exchange reserves and share of the euro in exchange rate regimes globally. Data at constant exchange rates were not available for foreign exchange settlements. Data for 2016 are used for 2017 and 2018 observations for the share of the euro in exchange rate regimes globally. The latest observations are for the fourth quarter of 2018.
Chart 2
The euro remains the second most important currency in the international monetary system
Snapshot of the international monetary system
(percentages)
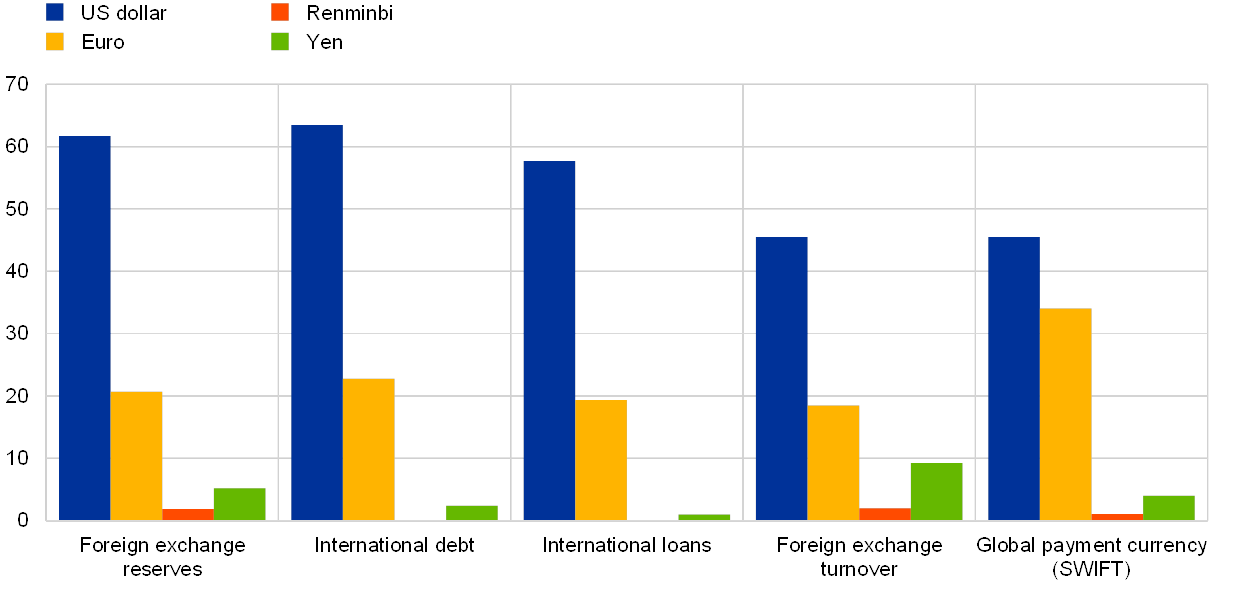
Sources: BIS, CLS Bank International, IMF, SWIFT and ECB calculations.
Note: The latest data are for the fourth quarter of 2018 or the latest available.
Table 1
The international role of the euro showed signs of a tentative turnaround in 2018
Summary of data in this report
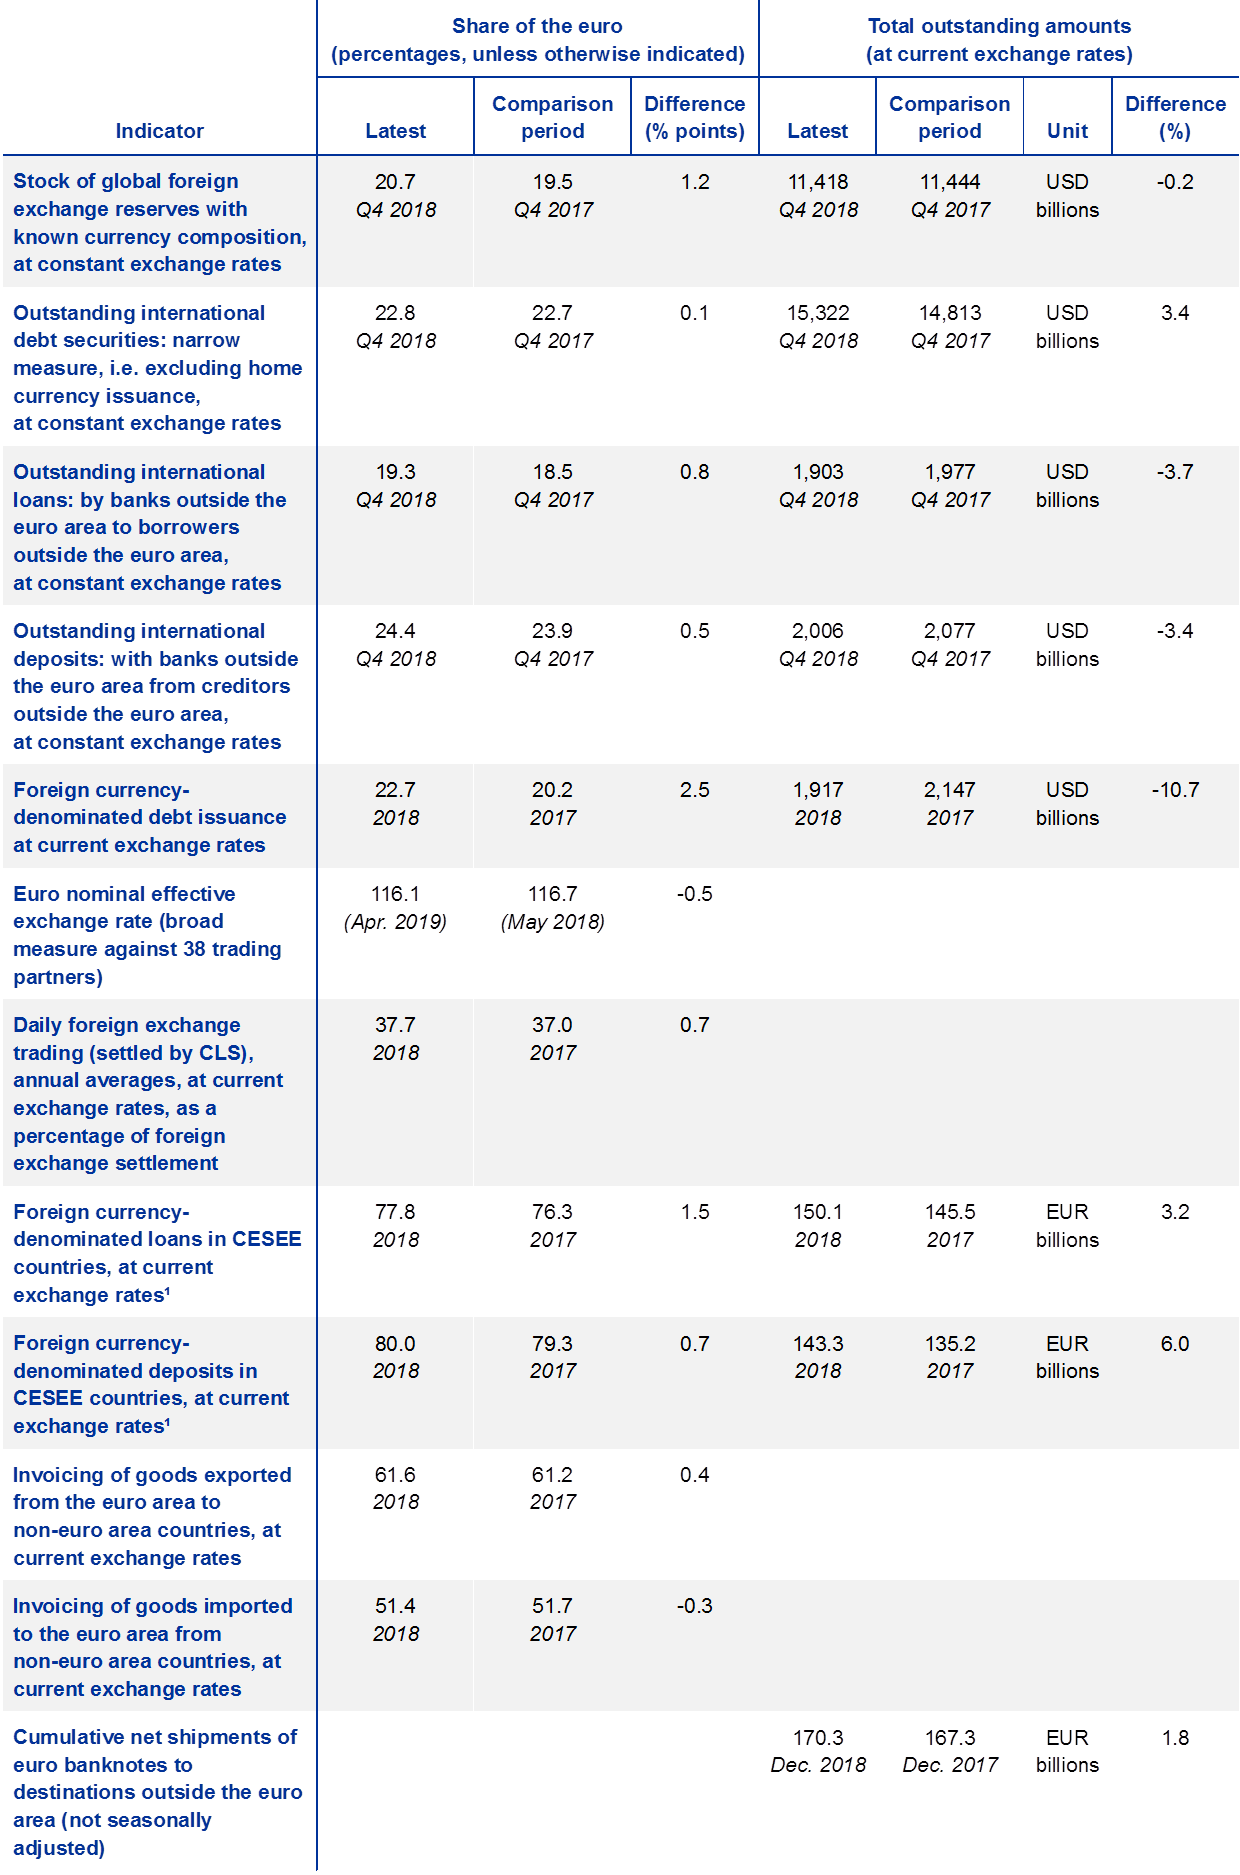
Sources: BIS, CLS Bank International, Dealogic, IMF, national sources and ECB calculations.
Notes: An increase in the euro nominal effective exchange rate indicates an appreciation of the euro.
1) Outstanding amounts figures refer to outstanding amounts of foreign currency total amounts.
2 Key developments
2.1 Use of the euro as an international reserve and investment currency
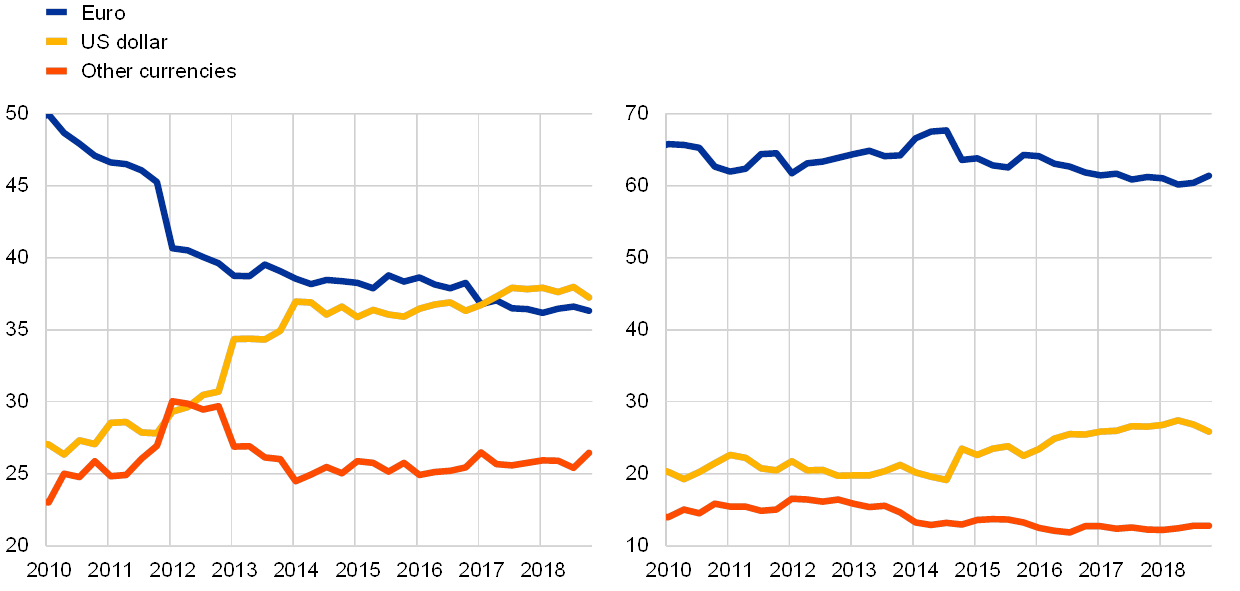
The share of the euro in global official holdings of foreign exchange reserves increased in 2018, unlike that of the US dollar which continued to decline. At constant exchange rates, the share of the euro in globally disclosed holdings of foreign exchange reserves increased by more than a full percentage point between the end of 2017 and the end of 2018, to 20.7% (see Chart 3).[1] Moreover, the share of the US dollar continued to decline over the review period to 61.7% – an all-time low since the start of Economic and Monetary Union.
Chart 3
The share of the euro in global foreign exchange reserves increased in 2018
Developments in the shares of the euro, US dollar and other currencies in global official holdings of foreign exchange reserves
(percentages; at constant Q4 2018 exchange rates)
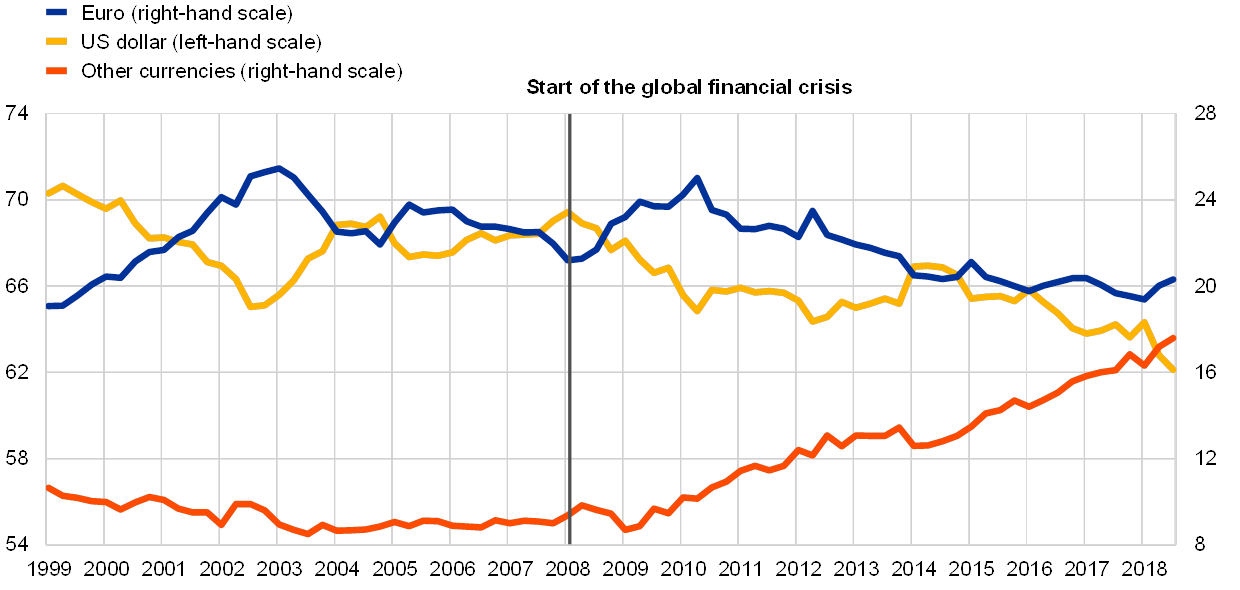
Sources: IMF and ECB calculations.
Note: The latest observation is for the fourth quarter of 2018.
The US dollar remains the leading global reserve currency, but its share has declined by more than 7 percentage points relative to its peak level before the global financial crisis. Although the euro grew temporarily in importance as an international reserve unit in the wake of the global financial crisis, its role declined after the outbreak of the euro area debt crisis in the period 2010‑11. The share of other currencies in official reserve portfolios increased significantly in parallel, pointing to diversification of global reserve portfolios – a trend which continued in the review period.[2]
The increase in the share of the euro in global reserve portfolios in the review period appears partly related to factors that weighed on the use of the US dollar. One such factor is that several emerging market economies – many of which are large reserve holders – sold US dollar-denominated reserves. Heightened financial market volatility and reversals in cross-border capital flows over the summer led these economies to conduct foreign exchange market interventions to stabilise their currencies. Between the end of March and the end of September 2018, they sold about USD 200 billion worth of – mainly US dollar-denominated – foreign exchange reserves (see the left panel of Chart 4).[3]
Chart 4
Changes in 2018 in the currency composition of global foreign exchange reserve portfolios reflected factors that weighed on the US dollar
Change in the foreign exchange reserve holdings of selected emerging market economies (left panel) and currency composition of the foreign exchange reserves of the Central Bank of the Russian Federation (right panel)
(amounts in USD billions)
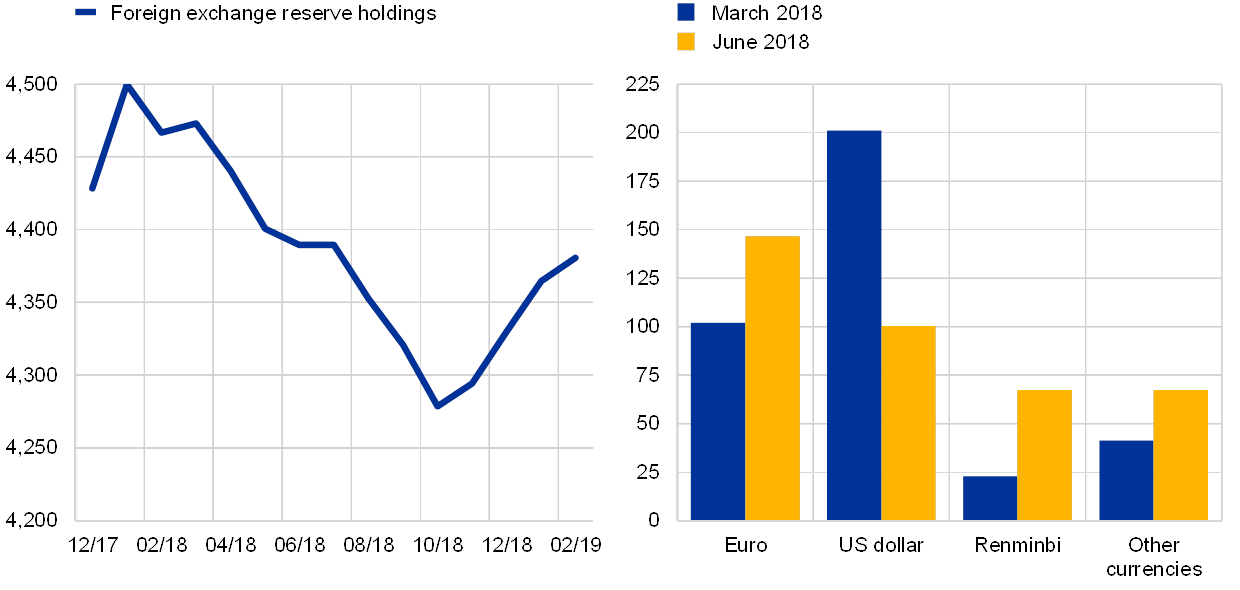
Sources: Haver analytics, Central Bank of the Russian Federation and ECB calculations.
Notes: The latest observation is for February 2019 (left panel) and June 2018 (right panel). The emerging market economies referred to in the left panel chart include Argentina, China, Hong Kong, India, Indonesia, Thailand and Turkey.
Another factor that weighed on the US dollar is that some central banks might have started to consider reducing their positions in financial assets exposed to the risks of unilateral actions. One example is Russia, one of the world’s largest reserve holders, which sold about USD 100 billion worth of US dollar-denominated reserves in the wake of new rounds of US sanctions, and purchased almost USD 90 billion worth of euro-denominated and renminbi-denominated assets in the second quarter of 2018 (see the right panel of Chart 4). With a share of about 39%, the euro is now the main currency of denomination of Russia’s foreign exchange reserve holdings, ahead of the US dollar and the renminbi, with shares of 27% and 17% respectively.[4] China also reduced its holdings of US Treasury securities in the course of 2018 in an environment of escalating global trade tensions, to the tune of about USD 60 billion (from a total of nearly USD 1.1 trillion).[5] It is difficult to assess whether other official reserve holders have taken – or are contemplating taking – similar steps, not least owing to the limited information available publicly on the currency composition of central banks’ reserve portfolios (see Table A1).[6]
The role of the remaining reserve currencies continued to increase, mainly on account of the Chinese renminbi. Adjusting for valuation effects arising from exchange rate movements, the shares of both the Japanese yen and the pound sterling remained broadly stable (see the left panel of Chart 5). Stability in the share of the pound sterling, in turn, suggests that official reserve holders remained confident, in the review period, that risks associated with an exit of the United Kingdom from the European Union could be mitigated. Non-standard currencies continued to gain in importance (see the right panel of Chart 5). Their share increased by nearly half a percentage point in 2018, mostly due to investments in Chinese renminbi from Russia.[7] The share of the Chinese renminbi reached almost 2% of global foreign exchange reserves in the fourth quarter of 2018, double that of early‑2017 (see also Box 1, which reviews recent developments in the renminbi’s global role).
Chart 5
The stronger role of the other reserve currencies was mainly on account of the renminbi
Shares of the Japanese yen and of the pound sterling in global foreign exchange reserves (left panel) as well as of non-traditional currencies, including the Chinese renminbi (right panel)
(percentages; at constant Q4 2018 exchange rates)
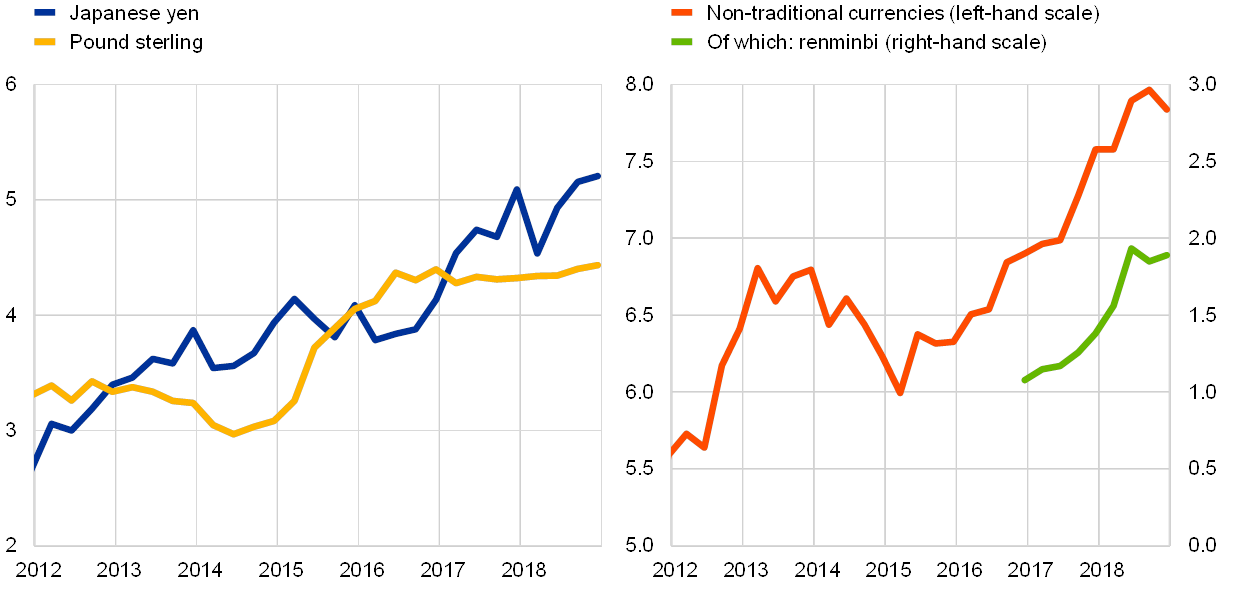
Sources: IMF and ECB calculations.
Notes: The latest observation is for the fourth quarter of 2018. Non-traditional currencies include the Australian dollar, the Canadian dollar, the Chinese renminbi and other currencies not included in the special drawing rights basket.
Developments in portfolio flows to the euro area suggest that weaker euro area growth prospects and the lingering effects of the ECB’s asset purchase programme were important determinants in lowering the attractiveness of the euro as an investment currency. Balance of payments data suggest that net purchases of euro area equities by foreign investors fell to about €60 billion in February 2019 from an all-time high of almost €490 billion in December 2017 (see the left panel of Chart 6).[8] Waning demand for euro area equities in 2018 mainly reflected global factors, particularly lower levels of global investor risk appetite in an environment of slowing global growth, heightened trade tensions and lingering political uncertainty. However, idiosyncratic euro area factors, including concerns of a more severe slowdown in activity in the euro area, weighed additionally on the global attractiveness of euro area equities. Foreign investors continued to retreat from euro area bonds (see the right panel of Chart 6). Against the background of the ECB’s asset purchase programme and low euro area yields, foreign investors remained net sellers of debt securities in 2018, to the tune of €190 billion.
Chart 6
Foreign investors remained net sellers of euro area debt securities in 2018
Net purchases by foreign investors of euro area equities (left panel) and debt securities (right panel)
(cumulated flows over 12 months)

Sources: ECB and ECB calculations.
Notes: The latest observation is for February 2019. Debt securities include bonds, notes and money market instruments.
This interpretation is supported by new statistical evidence on the currency composition of euro area portfolio debt assets and liabilities. Holdings by euro area investors of foreign debt securities denominated in US dollars remained higher than those denominated in the euro in the review period (see the left panel of Chart 7). Between 2010 and 2013 euro area investors rebalanced their holdings of foreign debt securities from euro to US dollar-denominated assets, presumably reflecting concerns about risks raised by the euro area debt crisis. However, the share of the euro at constant exchange rates did not recover subsequently. This might have reflected mounting market expectations about – and ultimately the launch of – the ECB’s programme of large-scale purchases of sovereign bonds. Expectations that yields would fall in the euro area, in turn, may have encouraged euro area investors to turn to foreign bonds seen as close substitutes, including US Treasury securities.[9] The currency composition of portfolio debt liabilities vis-à-vis non-euro area residents is also increasingly tilted towards the US dollar (see the right panel of Chart 7). Anecdotal evidence suggests that this reflects issuances by US multinational enterprises and financial institutions via special purpose vehicles set up in some euro area countries, as well the issuance of US dollar debt by euro area banks to hedge US dollar assets.
Chart 7
The currency composition of euro area portfolio debt assets and liabilities is increasingly tilted towards the US dollar
Currency composition of euro area portfolio debt assets (left panel) and liabilities (right panel)
(percentages; at constant Q4 2018 exchange rates)
Sources: ECB and ECB calculations.
Note: The latest observation is for the fourth quarter of 2018.
Box 1
Internationalisation of the Chinese renminbi – state of play
The international use of the Chinese renminbi regained some strength in 2018 after the launch of several initiatives by Chinese authorities to raise its global status. However, international use of the renminbi remains substantially below the peak levels of 2015.
One popular indicator of the internationalisation of the renminbi is its role in international payments (see the left panel of Chart A). SWIFT data show that the average share of the renminbi declined from 2.2% in 2015 to about 1.8% in 2018, although it remains the fifth most used currency in international payments. A composite index of the renminbi’s global role suggests that it is less strong in 2018 than it was in 2015 (see the right panel of Chart A). The currency’s international role actually declined just after it was included in the special drawing rights basket.
By contrast, use of the renminbi as a currency of denomination for international bonds and reserves increased noticeably in 2018. But at less than 2%, the share of the renminbi in global foreign reserve portfolios, outstanding amounts of international bonds and international liabilities remains small overall (see the left panel of Chart B).
The Chinese authorities have taken initiatives to foster the international use of the renminbi. They launched several projects in 2017 and 2018 under the umbrella of the Belt and Road Initiative to support use of the renminbi as an invoicing currency for trade and to create direct trade routes between China and other economies.[10] The Shanghai International Energy Trading Centre launched an oil futures contract denominated in renminbi in 2018, with the goal of elevating it to benchmark status in the Asia-Pacific region. Within the space of a few months, trading volumes in the contract reached levels not too far off those in more established benchmarks, such as WTI or Brent (see the right panel of Chart B). Plans for financial products traded directly in renminbi are also under consideration.[11] The expansion of the Chinese banking sector – which, since 2016, has held total assets larger than those of European banks – notably to developing economies, may also have been another factor underpinning the renminbi’s global appeal, through the financing of international trade in renminbi, for example.
Time will tell whether these measures will succeed in increasing the global attractiveness of the renminbi. Complementary reforms to open China’s capital account and move to market-based exchange rate determination are also likely to be important if the renminbi is to reach its full potential.
Chart A
Indicators pointing to a small increase in the role of the renminbi in 2018
Change in the renminbi’s share as an international payment currency (left panel) and a composite indicator of internationalisation (right panel)
(left panel: percentages; right panel: index)
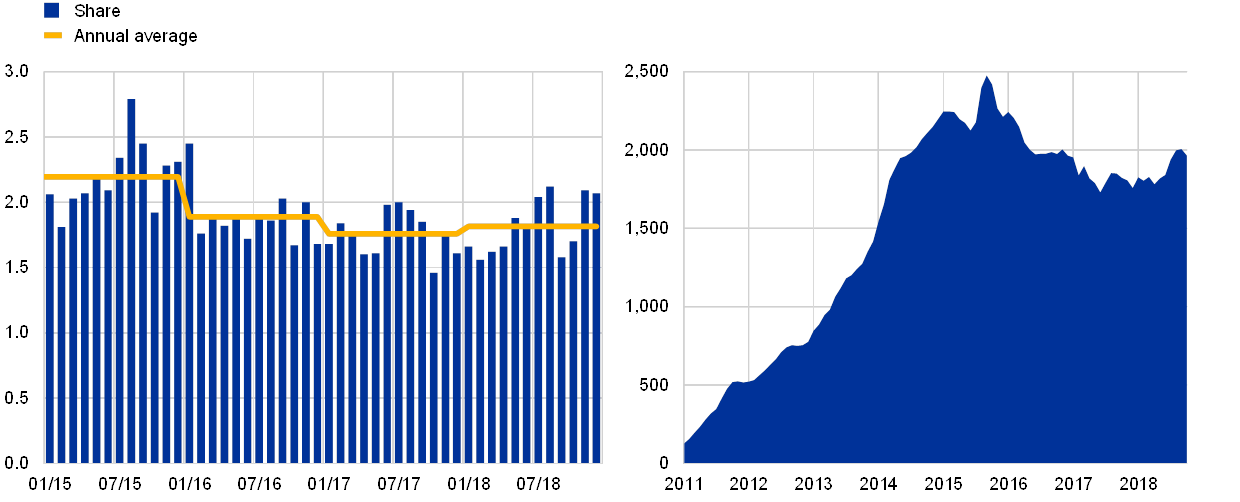
Sources: SWIFT (left panel); Bloomberg, Standard Chartered (right panel).
Notes: The latest observation is for December 2018 (left panel) and 31 January 2019 (right panel). Inbound plus outbound traffic based on value (left panel). The Renminbi Globalisation Index (RGI) tracks four components with weights inversely proportional to their variance, namely deposits, trade settlement and other international payments, dim sum bonds and certificates of deposit issued, and foreign exchange turnover (all from an offshore perspective and denominated in renminbi) in several countries (Hong Kong, Singapore, Taiwan, the United States, the United Kingdom, Korea, France) (right panel).
Chart B
Indicators pointing to a more significant increase in the role of the renminbi in 2018
Change in the share of the renminbi in total international debt, bonds and official foreign exchange reserves (left panel) and in selected oil future benchmarks (right panel)
(left panel: percentages; right panel: million lots per year, with each lot equalling 1,000 barrels)
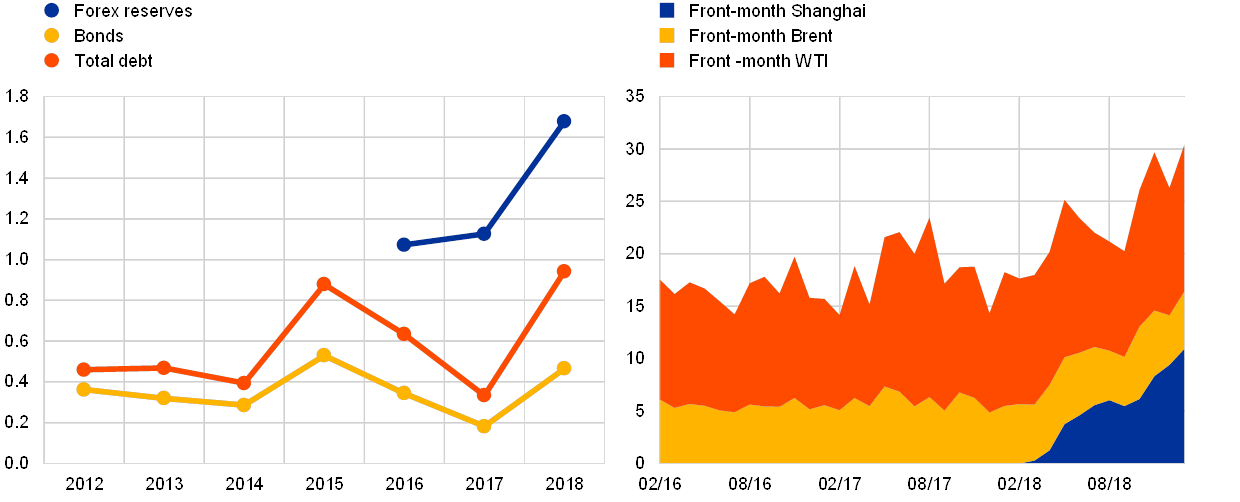
Source: Dealogic, Haver Analytics, IMF, People's Bank of China and ECB staff calculations (left panel) and Bloomberg (right panel).
Note: The latest observation is for December 2018 (left panel) and for January 2019 (right panel).
2.2 The euro in global foreign exchange markets
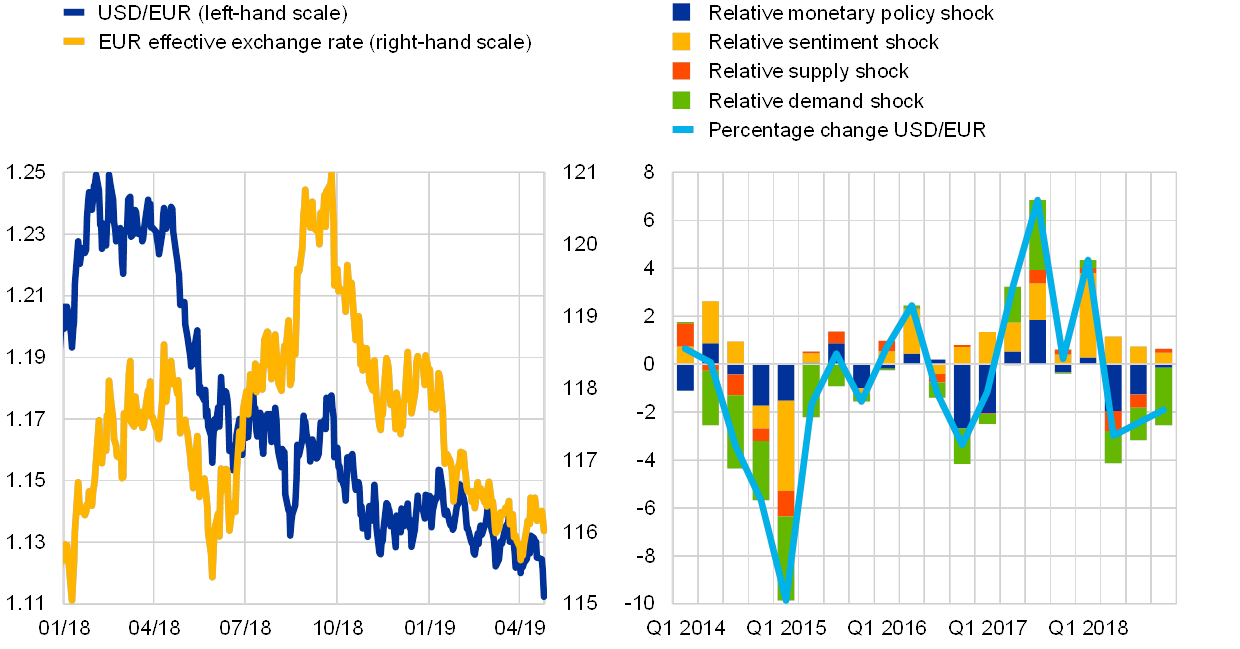
The euro exchange rate weakened in the review period. Between May 2018 and April 2019, the euro depreciated markedly (by about 5.0%) against the US dollar. In nominal effective terms (i.e. against the euro area’s 38 major trading partners), the depreciation of the euro was more contained, at about 0.5% (see the left panel of Chart 8), reflecting, among other things, weakness of several emerging market currencies[12] and the pound sterling.
The depreciation of the euro against the US dollar reflected mainly the stronger growth momentum and a faster pace of monetary policy normalisation in the United States relative to the euro area. Estimates obtained from a Bayesian vector autoregression (BVAR) model, where structural shocks driving the USD/EUR exchange rate are identified via sign restrictions, suggest that the euro’s depreciation against the US dollar over the review period can be largely ascribed to a combination of relatively stronger demand and a tighter monetary policy stance in the United States relative to the euro area (see the right panel of Chart 8). In contrast, market sentiment shocks, which often explain a large share of exchange rate developments, played a smaller role in the review period.
Chart 8
The euro depreciated markedly against the US dollar on the back of a weaker outlook for euro area growth and a faster pace of US monetary policy normalisation
Exchange rate of the euro against the US dollar and in nominal effective terms vis-à-vis the currencies of 38 major trading partners (left panel) and model-based decomposition of the quarterly change in the USD/EUR exchange rate over the past five years (right panel)
(right panel: percentages)
Sources: ECB and ECB calculations.
Note: Estimates based on a quarterly BVAR model of the USD/EUR exchange rate, relative GDP (euro area versus US), relative CPI (euro area versus US) and shadow interest rate differentials (euro area versus US) where shocks are identified via sign restrictions. The latest observation is for 25 April 2019 (left panel) and for the fourth quarter of 2018 (right panel).
Evidence on the role of the euro in the foreign exchange market based on quantities points to a slight decline in the use of the euro. In the absence of updated data from the Triennial Central Bank Survey of Foreign Exchange and Over-The-Counter (OTC) Derivatives Markets conducted by the BIS – which was last released in December 2016 – quantity-based evidence on the role of the euro in the foreign exchange markets can be gleaned from data on foreign exchange transactions settled in the CLS system. CLS is operated by CLS Bank International, a specialised financial institution providing settlement services to its members in the foreign exchange market.[13] The share of the euro in global foreign exchange settlements decreased between January and December 2018, from about 38% to about 36% (see the left panel of Chart 9) amid lighter volumes of euro settlements (see the right panel of Chart 9).[14] Data are volatile, however, and such developments are not unprecedented. Moreover, a comparison of the annual averages between 2017 and 2018 shows that the share of the euro increased by 0.7 percentage points. The US dollar remained the leading currency in the foreign exchange market by a wide margin, being involved in about 91% of all settlements in December 2018, while the euro remained the second most actively settled currency.
The role of the euro as an anchor currency, i.e. as a currency of reference for the exchange rate regime of economies outside the euro area, remained stable in the review period.[15] Box 2 shows evidence of the strong regional dimension of the euro’s role as an exchange rate anchor.
Chart 9
The share of the euro in global foreign exchange turnover decreased in 2018
Share of foreign exchange transactions settled in CLS (left panel) and total value of euro-denominated settlements (right panel)
(left panel: percentages; right panel: EUR billion equivalents per month)

Sources: CLS Bank International and ECB calculations.
Note: The latest observation is for March 2019.
Box 2
Global currency areas
The international role of a currency can be measured based on several indicators, such as liquidity in the exchange rate market, use in international debt markets and denomination of foreign assets. These indicators measure use of a currency beyond national borders. Another important factor to consider is that, when a currency has a dominant role in the international monetary system, shocks to the currency in question propagate to other currencies. One example of this is the US dollar. A large array of bilateral exchange rates co-move strongly with the US dollar’s nominal effective exchange rate. A number of factors drive that finding, including the fact that many trade and debt operations are US-dollar denominated and many countries track US monetary policy closely (see also Box 6). Estimating how much a currency acts as an anchor for the exchange rates of other countries is therefore one way of splitting the global economy into currency areas, i.e. groups of countries with exchange rates co-moving strongly with the US dollar or other major currencies. We use a simple framework to that end in the spirit of McCauley and Ito (2018), which consists of estimating the following model equation on monthly data[16]:
where is the bilateral exchange rate of country i vis-à-vis the US dollar regressed on the nominal effective exchange rate of the euro, the yen and the pound sterling, respectively.[17] The various coefficients measure how much the euro, the yen and the pound sterling co-move with the bilateral exchange rate of country i against the US dollar, which captures their relevance for currency i (this is also in the spirit of the standard Frankel-Wei methodology albeit using nominal effective exchange rates in lieu of bilateral exchange rates expressed in a common numéraire currency).[18] The coefficient for the US dollar is computed as , which can be seen as an upper bound. The coefficient estimates can then be plotted on a map to provide a visual representation of global currency zones. ECB staff estimates using this methodology suggest that the US dollar plays a dominant role as a global anchor currency (see Chart A).
Chart A
The euro currency area is the second most important in the world
Estimated co-movement with the dollar (upper panel) and the euro (lower panel)
(percentages derived from the β coefficient estimates discussed above)

Sources: ECB, BIS and ECB staff calculations.
Notes: The estimates are for December 2018. The boundaries shown on this map do not imply acceptance by the ECB.
The US dollar drives the exchange rates of most countries in the western hemisphere, Asia and the Middle East. The euro is an important anchor currency for non-euro area European countries and for some countries in Africa, which typically share strong economic, historical and institutional links with the euro area. Intuitively, the β coefficient estimate equals 1 on the US dollar exchange rate for Panama (which is a dollarised economy) and 1 on the euro exchange rate for Denmark (which pegs its currency vis-à-vis the euro within tight fluctuation bands). The role of the Japanese yen and the pound sterling is more limited, by contrast.
2.3 Use of the euro in international debt and loan markets
The euro in international debt markets
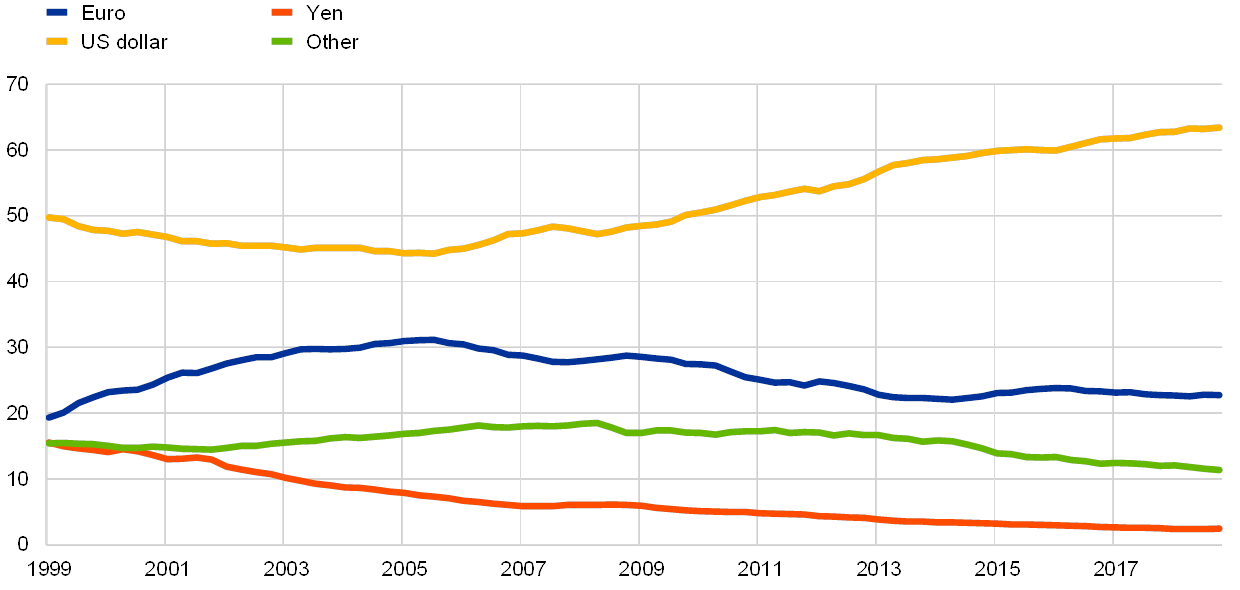
The share of the euro in the stock of international debt securities remained stable in 2018 (see Chart 10 and Table A4). At constant exchange rates, the share of the euro in outstanding amounts of international debt securities remained stable, at about 23%.[19] The dominant role of the US dollar in international debt markets continued to increase, rising by about half a percentage point, to over 63%. Since the mid‑2000s, the share of the euro has declined by about 8 percentage points, while that of the US dollar has increased by close to 20 percentage points.
Chart 10
The share of the euro in the stock of international debt securities remained stable in 2018
Currency composition of outstanding international debt securities
(percentages; at Q4 2018 exchange rates)
Sources: BIS and ECB calculations.
Notes: Narrow measure. The latest data are for the fourth quarter of 2018.
However, analysis of debt flows provides a different perspective, with an increase in the share of the euro and a notable decline in that of the US dollar. Recent trends in international debt markets are more clearly reflected by developments in issuance than developments in stocks. In 2018 total volumes of foreign currency denominated debt issuance declined by more than 10% to about USD 1,900 billion, the largest decline in a year since the outbreak of the global financial crisis in 2008 (see the left panel of Chart 11). This decline was confined to issuance in US dollars. Debt financing in the euro and other currencies remained stable or increased slightly. As a consequence, the share of euro debt issuance increased by 2.5 percentage points (see the right panel of Chart 11), while the share of the US dollar declined for a second consecutive year, by around 8 percentage points in total, to less than 61%.
Chart 11
The share of the euro in foreign currency-denominated debt issuance increased in 2018 on the back of markedly lower issuance in US dollars
Currency composition of foreign currency-denominated debt issuance
(left panel: USD billions; right panel: percentages)

Sources: Dealogic and ECB calculations.
Note: The latest data are for the fourth quarter of 2018.
The decline in the share of the US dollar mainly reflected a decrease in US dollar issuance by borrowers in emerging market economies in an environment characterised by a stronger US dollar exchange rate and concerns about rising debt servicing costs. The ascent of the US dollar as the main financing vehicle in global debt markets in the past decade mainly reflected dynamic borrowing of emerging market issuers seeking to take advantage of low US interest rates. US dollar-denominated issues by emerging market economies increased almost tenfold in the last decade (see the left panel of Chart 12). However, this trend came to a halt in 2018. In an environment characterised by a stronger US dollar exchange rate, weaker global growth and concerns about rising debt servicing costs, borrowers in emerging market economies cut volumes of US dollar-denominated issuance by about 30%. US dollar debt issuance also declined among borrowers in non-EU advanced economies, also probably because a stronger US dollar exchange rate weighed on its attractiveness as a funding currency.[20]
Interest shown by emerging market borrowers in using the euro as a funding currency increased further, suggesting that they sought to diversify their currency exposures. The volume of euro-denominated debt issuance by emerging market residents increased for the third consecutive year in 2018, although it remains considerably lower than the corresponding dollar volumes (see the right panel of Chart 12). In turn, the share of the euro in total international debt issuance of emerging market economies rose from 7% to 9%, while that of the US dollar declined from 89% to 84%, suggesting that borrowers in emerging market economies sought to diversify their funding base and reduce exposures to US dollar exchange rate movements.
Chart 12
The decline in US dollar-denominated international debt issuance in 2018 was largely driven by borrowers in emerging market economies
Regional breakdown of US dollar-denominated (left panel) and euro-denominated (right panel) international debt issuance
(USD billions)

Sources: Dealogic and ECB calculations.
Note: The latest data are for the fourth quarter of 2018.
Euro-denominated issuance in 2018 was also supported by the gradual decline in the cost of synthetic US dollar borrowing, as measured by the cross-currency swap (CCS) basis. A negative CCS basis is equivalent to paying a premium for borrowing US dollars “synthetically” via another funding currency, such as the euro.[21] The CCS basis across different maturities continued to contract in 2018. For instance, at the ten-year maturity, the basis declined from about 40 to about 20 basis points (see Chart 13); at the one-year maturity, it narrowed from about 40 to about 10 basis points.
Chart 13
The cross-currency swap basis of the euro decreased in 2018, which lowered the cost of using the euro as a funding currency
Cross-currency swap basis against the US dollar at the ten-year maturity
(basis points)

Sources: Bloomberg and ECB calculations.
Note: The latest observation is for 25 April 2019.
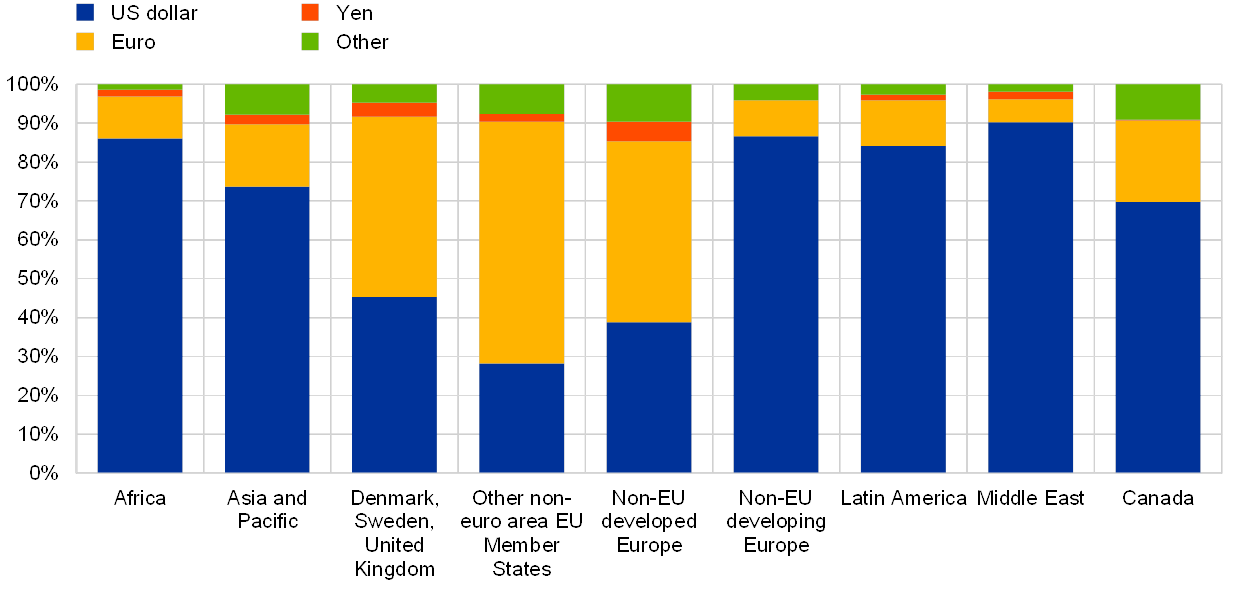
However, the share of the euro in stocks of international debt remains limited outside developed European countries. Aside from developed Europe and Canada, the share of the euro in outstanding amounts of international debt remains below 16% (see Chart 14 and Table A6). The dominance of the US dollar in global debt markets is most pronounced in the Middle East and in offshore financial centres, where its share is typically close to 90%, in line with the US dollar’s pre-eminence as an invoicing currency of energy products (see Box 3) and in global financial transactions.
Chart 14
Use of the euro as a financing currency remains limited outside Europe
Currency composition of outstanding international bonds and notes in selected regions
(percentages)
Sources: BIS and ECB calculations.
Notes: Narrow measure. The data are for the fourth quarter of 2018. Non-EU developed Europe refers to Iceland, Norway, Switzerland and European microstates.
Foreign currency debt issuance remains dominated by the private sector. As in previous years, financial institutions were the most active issuers of euro-denominated and US dollar-denominated international bonds, accounting for about two-thirds of total issuance for each (see Chart 15). Sovereigns accounted for around 10% of total international issuance. The relative importance of private versus public issuers has been remarkably stable over the past two decades. Since 1999 the private sector has accounted for around 90% of international bond issuance, both in the euro and US dollars.
Chart 15
Financial institutions remained the main issuers of euro-denominated and US dollar-denominated international debt in 2018
Sector breakdown of euro-denominated (left panel) and US-denominated (right panel) international debt issuance
(percentages)

Sources: Dealogic and ECB calculations.
The euro in international loan and deposit markets
The share of the euro in international loan markets continued to rise in 2018. Between 2006 and 2014 the share of the euro in international loans declined continuously, reflecting among other things deleveraging by euro area banks, as well as regulatory efforts to reduce exposures to foreign loans denominated in the euro.[22] This trend has halted and partly reversed in the past few years. The share of the euro in the stock of international loans stood at 19.3% at the end of the review period, an increase of almost 1 percentage point relative to the end of 2017 (see Chart 16 and Table A6).[23]
Recent evidence suggests that the ECB’s unconventional monetary policy measures, in particular in the form of credit easing programmes, supported cross-border lending of euro area banks.[24] In response to the ECB’s accommodative monetary policy, euro area banks operating internationally reallocated funds abroad within their respective banking organisations, which suggests that internal capital markets may amplify the strength of outward monetary transmission.[25] A greater supply of euro-denominated funds outside the euro area also boosted euro lending from banks outside the euro area.
Chart 16
The share of the euro in outstanding international loans increased notably in 2018
Currency composition of outstanding amounts of international loans
(percentages; at Q4 2018 exchange rates)

Sources: BIS and ECB calculations.
Note: The latest data are for the fourth quarter of 2018.
The share of the euro in outstanding international deposits also increased, mirroring developments in international loan markets. At constant exchange rates, the share of the euro in the stock of international deposits increased by 0.5 percentage points relative to the end of 2017 (see Chart 17 and Table A9).[26] That share now stands around 7 percentage points above its trough at the end of 2015 and close to its previous peak of 2005. The share of the US dollar also increased in the review period by almost 1 percentage point. Relative to 2015, the share of the US dollar is down by about 5 percentage points.
Anecdotal evidence suggests that developments in international deposits in US dollars in the review period reflected concerns about unilateral sanctions, among other factors. In particular, it has been observed that Russian banks were faced with the risk of US sanctions banning them from conducting transactions with US legal entities, including US banks with correspondent accounts that enable the Russian banks to conduct transactions in US dollars. Anecdotal evidence from press reports suggests, for instance, that some Russian clients shifted assets out of US dollar deposits into deposits in local currency or in foreign currencies other than the US dollar.[27]
Chart 17
The share of the euro in outstanding international deposits increased in 2018
Currency composition of outstanding amounts of international deposits
(percentages; at Q4 2018 exchange rates)

Sources: BIS and ECB calculations.
Note: The latest data are for the fourth quarter of 2018.
Lastly, the share of the euro in outstanding loans declined further in central, eastern and south-eastern Europe (see Table A12). As noted in last year’s edition of the report, this may reflect local authorities’ efforts to promote the use of domestic currencies to mitigate financial stability risks raised by unofficial euroisation. The share of the euro in foreign deposits also decreased moderately in some of these countries (see Table A13).
2.4 Use of the euro as an invoicing currency
The share of the euro as an invoicing or settlement currency for extra-euro area trade in goods remained broadly stable. In 2018 over 60% of extra-euro area exports and 50% of extra-euro area imports of goods were invoiced in euro (see the left panel of Chart 18 and Table A10). Patterns were broadly similar for extra-euro area trade in services.
The share of the euro as an invoicing currency has been remarkably stable in the past decade. Unlike other dimensions of the international use of the euro, the share of the euro in the invoicing of euro area international trade transactions in goods has hovered around 50‑60% over the past decade. However, trade invoicing practices vary across euro area trading partners. For instance, the vast majority of euro area trade with the United States is invoiced and settled in US dollars, while the bulk of euro area trade with non-euro area EU countries is invoiced in euro (see Table A11). Stability in the relative importance of the euro area’s trading partners – notwithstanding cyclical and structural developments in global trade – may contribute to explaining the resilience of the role of the euro as an invoicing currency of extra-euro area transactions (see the right panel of Chart 18).
Chart 18
The share of the euro in the invoicing of extra-euro area trade remained broadly stable
Share of the euro in the invoicing of extra-euro area trade in goods (left panel) and composition of the euro area’s trading partners in extra-euro area trade (right panel)
(percentages)

Sources: ECB, IMF DOTS and ECB calculations.
Note: The latest data are for 2018.
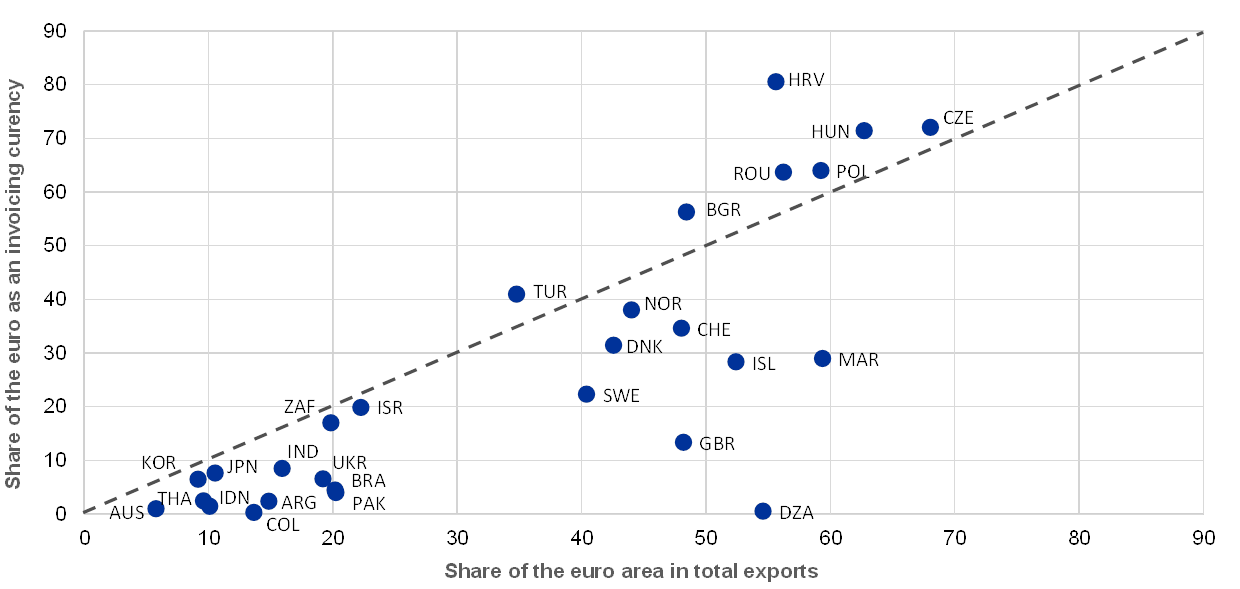
Unlike the US dollar, use of the euro for the invoicing of international transactions between third countries is limited. The euro is used as an invoicing currency in more than 30% of global trade transactions in goods.[28] However, unlike the US dollar, there is limited evidence that the euro is used for invoicing when transactions do not involve the euro area.[29] Plotting the share of the euro as an invoicing currency of goods exports for a sample of countries against the share of the euro area in total trade of the countries in question suggests that virtually no non-European countries use the euro proportionately more than predicted by their exports to the euro area (see Chart 19).[30] A different picture is observed in the EU Member States of central and eastern Europe and Turkey, which would be one indication that they are using the euro as a vehicle currency for international transactions with countries outside the euro area. This might be an indication that countries in this region trade in euro with one another.
Chart 19
There is limited evidence that the euro is used for trade invoicing between third countries
Share of the euro as an invoicing currency versus exports to the euro area relative to total trade
(percentages)
Sources: ECB, Gopinath (2015), IMF DOTS and ECB calculations.
Note: Gopinath, G., "The International Price System", NBER Working Paper, No 21646, 2015.
Box 3
Role of the US dollar as an invoicing currency for oil imports
The US dollar is widely used as the currency for oil trade invoicing in the European Union (EU). This strong role (around 85% of extra-EU oil imports, see the left panel of Chart A) far outweighs the EU’s imports of petroleum products from the United States, which accounted for just 4% of total EU petroleum imports over the period 2010‑16 (see the right panel of Chart A). It is hence used as a vehicle currency, i.e. neither the exporters’ currency nor the local currency. To address this imbalance, the European Commission has published a recommendation on the international role of the euro in the field of energy.[31] For the same reason, outside Europe, China launched oil futures contracts denominated in the renminbi on the Shanghai International Energy Exchange in March 2018 and as part of broader plans to raise the renminbi’s global profile.
Chart A
Evidence on currency invoicing patterns in EU trade of oil products
Currency breakdown of extra-EU oil imports (left panel) and breakdown of petroleum oil imports of EU countries by region of origin (right panel)
(percentages)

Sources: Eurostat, IMF WEO and ECB staff calculations.
Notes: Countries used to define the EU aggregate shown in the left panel include Belgium, Germany, France, Italy, Spain and the United Kingdom; invoicing is expressed as a percentage of total extra-EU imports of oil; weights defined use the shares of oil imports from the United States (US dollar invoicing) and the EU (euro invoicing). In the right panel, real imports (using the commodity price index as deflator) are weighted using real GDP shares and expressed as a percentage of total oil imports from the rest of the world; OPEC exporters include Algeria, Angola, Congo, Ecuador, Equatorial Guinea, Gabon, Iran, Iraq, Kuwait, Libya, Nigeria, Saudi Arabia, United Arab Emirates and Venezuela.
The specific features of oil as a product influence invoicing currency choice. Differentiated goods tend to be invoiced in the exporter’s currency. But more homogeneous goods such as oil are usually priced in a single (or dominant) currency, such as the US dollar.[32] However, an analysis of post-World War II data suggests that European oil imports were invoiced equally in US dollars and other currencies, notably the pound sterling.[33] This suggests that even for homogeneous goods such as oil, multiple invoicing currencies can coexist.
Most commodities are also upstream (i.e. used as inputs) in the production process. Often, firms that use commodities as inputs may want to use the same currency for their exports as for their imports. For example, the importance of crude oil, largely invoiced in dollars, as an input to petroleum products may explain why the US dollar also dominates the invoicing of EU imports of petroleum products. Indeed, research suggests that the use of a vehicle currency is more likely for exporters with a higher share of inputs priced in that vehicle currency.[34]
The limited data available on commodity invoicing currencies confirm a strong role played by the US dollar. Based on survey data, Chart A shows that more than 80% of extra-EU oil imports are invoiced in dollars. Firm-level data for the United Kingdom suggest that almost 90% of mineral fuel imports are invoiced in a vehicle currency. Similarly, data for Japan suggest that about 90% of petroleum, coal and natural gas imports were invoiced in US dollars in 2015.[35]
Conducting an empirical evaluation of oil trade currency invoicing for the euro area is difficult as the above-mentioned data are only available for a few years. Nevertheless, the pass-through of fluctuations in the exchange rate into oil import prices might provide an indirect approximation of the role of the US dollar as a vehicle currency for oil import transactions. Recent empirical findings do in fact show that for international transactions carried out in a vehicle currency such as the US dollar, exchange rate fluctuations against that vehicle currency have much higher pass-through into domestic inflation than those affecting transactions priced in the local or producer (i.e. the partner country) currency.[36] A measure of exchange rate pass-through to oil import prices could therefore give some indication of the use of the US dollar as a vehicle currency. This can be estimated in the following panel regression[37]:
where changes in import prices are regressed on changes in oil prices and the exchange rate. The closer the coefficient estimate is to one, the higher the pass-through of exchange rate changes against the US dollar to oil import prices. This, in turn, could be an indication of a higher share of US dollar invoicing in oil imports than what would be expected through the import share from the United States. As a caveat, it could be that prices adjust flexibly for reasons other than invoicing currency. Moreover, Borio (2019) suggests that the US dollar tends to weaken vis-à-vis the euro when commodity prices rise; as a result, oil price increases in US dollars would not necessarily match those in euro.[38] We apply the exchange rate with its lags in the spirit of the GMM methodology to control for possible endogeneity resulting from this relationship between the oil price and the US dollar exchange rate.
The empirical analysis points to the dominance of the US dollar as an invoicing currency for global oil trade transactions. The results show that pass-through is almost complete, with a coefficient of 0.93 for the full sample (see Table A). As regards advanced economies, the coefficient is almost equal to 1, which could be an indication of almost complete US dollar invoicing of imports. Similar results hold for the EU and the euro area. These estimates differ from the survey results shown in the left panel of Chart A above as the latter draw from evidence gained over the period 2010‑16 for Belgium, Germany, France, Italy, Spain and the United Kingdom. The estimates, in contrast, are for the period 1983‑2018 and for a larger sample of countries than that covered in the survey, some of which most likely use the US dollar as a vehicle currency to a greater extent (for example Australia or Canada). For emerging market economies, the coefficient is statistically smaller than one. Still, it has to be borne in mind that other factors can influence the pass-through of the US dollar so that the estimation results provide only some tentative indication that the US dollar is indeed a vehicle currency for most oil imports.
Table A
Regression results

Robust standard errors in parentheses *** p<0.01, ** p<0.05, * p<0.1.
Box 4
Advances in market infrastructures and implications for the international use of the euro
The Eurosystem promotes the safe and efficient functioning of the euro payment infrastructure. This task is closely interlinked with its responsibilities in the field of monetary policy. All actions taken by the Eurosystem in this field also indirectly support the international standing of the euro by making euro-denominated financial markets more efficient and more attractive to foreign investors.
Since the launch of the euro the Eurosystem has played a major part in reshaping and consolidating the infrastructure for large-value payments, for post-trading services for financial instruments and, most recently, for instant retail payments. The goal is to create a truly single financial market in Europe where payments, securities and collateral can be moved safely and efficiently between participants active in European markets, without friction or restrictions.
The Eurosystem’s market infrastructure services for the settlement of payments and securities in central bank money include TARGET2, TARGET2‑Securities (T2S) and TARGET Instant Payment Settlement (TIPS) – the so-called TARGET Services.
TARGET2 and its predecessor are the longest-standing components of the Eurosystem’s financial market infrastructure. TARGET, the first-generation RTGS system, commenced operations just a few days after the launch of the euro in January 1999. In 2008 it was fully replaced by TARGET2, which offers harmonised services on a single technical platform. Today TARGET2 is one of the largest payment systems in the world, processing 90% of the total value settled by large-value payment systems in euro.
T2S, the integrated technical platform which processes the real-time settlement of securities transactions against central bank money across Europe, was launched in 2015. Full migration took place in waves over the following two years to ensure a smooth transition. T2S provides banks and intermediaries with a single pool of collateral for the entire T2S market comprising 21 central securities depositories from 20 European countries, thereby optimising settlement and triparty procedures.
Last but not least, in November 2018 the Eurosystem delivered TIPS, a market infrastructure for instant payments with settlement in central bank money. TIPS enables payment service providers to offer fund transfers to their customers in less than ten seconds throughout the day, every day of the year.
The upcoming technical and functional convergence of TARGET2 and T2S will further optimise liquidity management and generate new cost efficiencies. The consolidation project, which will run until 2021, will introduce a central liquidity management system that will allow participants to monitor and manage their liquidity for all TARGET Services. It will enable centralised management and control over the payment capacity with a clear allocation of liquidity for the different settlement purposes. This will make the use of central bank money even more efficient for market participants and, in turn, benefit the financial market and its domestic and foreign participants.
In contrast to the major steps taken to overcome the fragmentation in the European payments market and in the securities trade and post-trade area, there is still room for progress at the front end of the securities process chain. The issuance and distribution of securities still hinges on fragmented legacy standards, structural constraints and complex market practices at the national level. Facilitating interactions and procedures between some participants still entails high costs and risks. European issuers and EU institutions in particular need to be able to collect funds from investors across the continent in a fair and well defined manner. Reflection on pan-European issuance would be in line with the endeavour to deepen the single capital market in the EU.
Finally, whilst noting the progress achieved in better integrating the retail payments market through the SEPA project, recent global trends in this field call for capitalizing on European strengths and develop a European strategy for retail payments, taking into account the instant payment infrastructure (TIPS) and instrument (SEPA Instant Credit Transfer).
In summary, through its provision of safe and efficient market infrastructure services, the Eurosystem plays an integral role in strengthening the international role of the euro. The full deployment of TIPS and the consolidation of TARGET2 and T2S will underpin the progress in the RTGS and retail payments market. Simultaneously, discussions on how best to remove the remaining barriers and obstacles that still exist in some segments of the securities market are under way.
2.5 Use of euro cash outside the euro area
Shipments of euro banknotes to destinations outside the euro area remained broadly stable in the review period. Following a decline in cumulated net shipments of euro banknotes to destinations outside the euro area between the middle of 2015 and early‑2018, the trend reversed, with shipments remaining broadly stable (see Chart 20).[39] Data collected from banknote wholesale banks, which act as intermediaries between the national central banks of the Eurosystem and financial institutions outside the euro area, suggest that stronger demand from Russia largely contributed to support foreign demand for euro banknotes. In terms of destinations, entities in euro area neighbouring countries remained the main purchasers of euro banknotes, including the United Kingdom in the EU, Switzerland in the western Europe region (non-EU) and Russia in the eastern Europe region (non-EU) (see the left panel of Chart 21). Euro banknotes continued to be mainly imported from euro area neighbouring countries too, first and foremost from eastern EU countries and Turkey. Box 5 provides further evidence on the use of euro cash in central, eastern and south-eastern Europe.
Chart 20
Foreign demand for euro banknotes stabilised in 2018
Net monthly shipments of euro banknotes to destinations outside the euro area
(EUR billions; adjusted for seasonal effects)
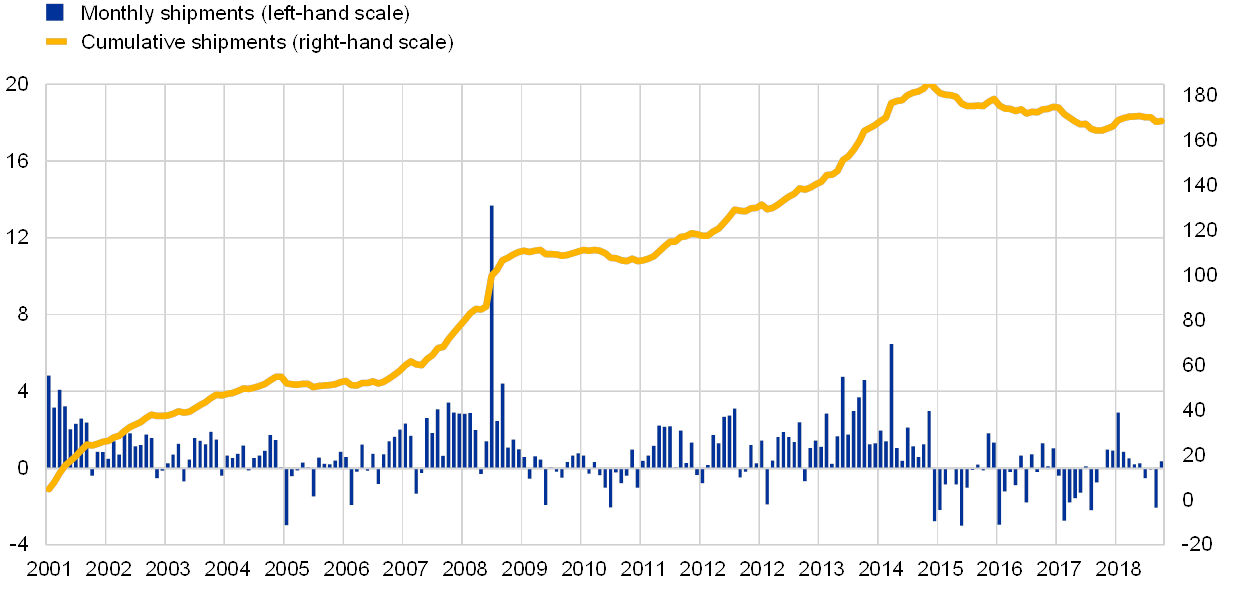
Source: Eurosystem.
Notes: Net shipments are euro banknotes sent to destinations outside the euro area minus euro banknotes received from outside the euro area. The latest observation is for February 2019.
Chart 21
In 2018 euro banknotes were mainly exported to, and imported from, euro area neighbouring regions
Sales (left panel) and purchases (right panel) of euro banknotes – breakdown by destination
(percentages)

Source: ECB calculations based on data from international banknote wholesalers.
Note: The data are for 2018.
Box 5
Use of euro cash in CESEE countries
A number of countries in the CESEE (central, eastern and south-eastern Europe) region hold significant amounts of euro cash. Euro cash holdings are widespread in Albania, Croatia, the Czech Republic, the Republic of North Macedonia and Serbia. In those five countries, an average of 36% of respondents reported holding euro cash in the OeNB’s Euro Surveys conducted in 2017–2018 (see the left panel of Chart A).[40] The corresponding average for the other five countries surveyed (Bosnia and Herzegovina, Bulgaria, Hungary, Poland and Romania) was 13% of respondents. The recent rebound of euro cash holdings in several CESEE countries that can be noted in Chart A may have been driven by rising incomes or a greater prevalence of remittances.
Individuals in the region hold euro cash for a variety of reasons. One main motive cited by respondents in most countries is that they hold euro cash as a general reserve (Scheiber and Stern, 2016).[41] Stix (2013) observed that a substantial share of people in CESEE countries have a preference for cash over interest-bearing assets – a phenomenon that is mainly related to lack of trust in the local currency and banks.[42] Besides being used for saving purposes, euro cash is also used for domestic payments – for example, real estate and cars are frequently paid for in euro in a number of south-eastern European (SEE) countries (Scheiber and Stern, 2016). By contrast, respondents in Hungary, Poland and particularly the Czech Republic reported that they plan to spend their euro cash mainly abroad. This regional pattern of motives for holding euro cash correlates with self-reported euro cash amounts, which tend to be relatively high in countries where the saving purpose dominates.
One indication of the motives for holding euro area cash is through a currency substitution index (CSI, see the right panel of Chart A). The measure is derived from the OeNB Euro Survey and compares projected per capita euro cash amounts with per capita local currency in circulation outside the banking sector. Compared to SEE, currency substitution clearly has not been an issue in the Czech Republic, Hungary and Poland over the last decade. Currency substitution has also trended downwards in all SEE countries since 2008. Bulgaria and Bosnia and Herzegovina were the first SEE countries in which the ratio declined below 10% – which is regarded as a threshold for low euroisation in the literature. In Albania and Romania, the CSI declined to 10% in 2017‑2018. Medium levels of currency substitution prevail in Croatia and the Republic of North Macedonia, which have both seen a substantial increase in the CSI, to 24% and 45% respectively.[43] Meanwhile, the Serbian CSI declined further, but remained above 50%.[44]
Chart A
Evidence on the use of euro cash
Frequency of euro cash holdings per country (left panel) and currency substitution index (right panel)
(left panel: percentages of respondents; right panel: percentages)

Source: OeNB Euro Survey.
Notes: left panel: weighted percentages based on pooled data from survey waves of two consecutive years as indicated in the legend; respondents answering "Don't know" or who refused to answer were excluded; right panel: the currency substitution index is calculated as the ratio of euro cash to euro cash plus national currency in circulation outside the banking sector; for details, see Scheiber and Stix (2009). BG: Bulgaria; HR: Croatia; CZ: Czech Republic; HU: Hungary; PL: Poland; RO: Romania; AL: Albania: BA: Bosnia and Herzegovina; MK: North Macedonia; RS: Serbia.
Against the background of EU integration, the question arises as to whether individual expectations with respect to future euro adoption have a significant influence on euro cash holdings. Below, we focus on the six CESEE EU Member States. According to the OeNB Euro Survey, a substantial share of respondents did not know how soon the euro might be introduced in their country (see the “don’t know” answers in Chart B). Compared with 2014, respondents in Bulgaria have become slightly more optimistic regarding the introduction of the euro, whereas Czech, Hungarian, Polish and Romanian respondents were more sceptical. In particular, the share of “never” replies increased substantially. The exception is Croatia, which had declining shares of both “don’t know” and “never” answers and the most optimistic replies, namely a median expectation of four years.[45] Empirical analysis confirms that expectations regarding euro adoption prospects affect the propensity for individuals to hold euro cash. Two simple regressions were run using data from 2014, 2017 and 2018. The first regression, a probit model, finds a positive and significant influence of the expected euro adoption periods on the likelihood of individuals to hold euro cash. The average marginal effect of expectations anticipating euro adoption in 2‑3 years or 4‑5 years increases the likelihood by 7 percentage points. The marginal effects decline as the prospects of euro adoption diminish. Nonetheless, the prospects of euro adoption do not seem to affect the amounts of euro cash held. A second regression finds no significant correlation between the amounts of euro cash held (for those holding some euro cash) and expectations regarding euro adoption.[46]
Chart B
Expected adoption of the euro as legal tender
Survey evidence
(percentages of respondents)

Source: OeNB Euro Survey.
Notes: Results are weighted; respondents who refused to answer are excluded.
3 Special features
The benefits and costs of the international role of the euro at 20
This year marks the 20th anniversary of the creation of the euro and of the adoption of the Eurosystem’s position on its international role. It is therefore an appropriate time to take stock of developments in the use of the euro as a global currency and to assess whether, and how, the economic benefits and costs of the international use of the euro have evolved. This assessment takes place amid renewed calls among European policymakers to promote a stronger international role for the currency. In particular, the decision was taken at the Euro Summit of December 2018 to encourage “work to be taken forward to this end”.[47]
This special feature assesses changes in the economic benefits and costs arising from the international role of the euro from a central banking perspective. It provides evidence that the balance of benefits and costs has evolved since 1999, with some of the traditional effects of its status as an international currency having declined in relevance while others have become more apparent.
Taking stock of the ECB’s position on the international role of the euro twenty years on
Since the launch of Economic and Monetary Union, the Eurosystem has advocated a policy of neutrality vis-à-vis the international role of the euro. This was stressed in the first speech of President Duisenberg in January 1999 and in a Monthly Bulletin article published in August 1999, which stated that currency status is market-driven and that the Eurosystem neither hinders nor fosters the internationalisation of the euro.[48]
This position was the outcome of two views, one emphasising the economic benefits of international currency status, and the other emphasising the costs. Back in 1999 the main benefits of currency internationalisation discussed included seigniorage, lower transaction and hedging costs, added breadth and efficiency to the euro area financial markets, as well as the “exorbitant privilege” (the fact that international currency issuers have lower external financing costs). In particular, research suggests that the net return earned by the United States on its net international investment position due to the US dollar’s role as the leading international currency is approximately 1‑3% per year.[49] The main costs stressed were volatility in money aggregates and, in turn, in capital flows, which it was believed could complicate the conduct of monetary policy (see Table 1).
Table 1
Benefits and costs of international currency use: assessment in 1999

Source: ECB (1999), op. cit.
Twenty years on, the balance of benefits and costs of international currency status has evolved. With rapid financial globalisation, rising challenges to multilateralism and the adoption of new monetary policy frameworks across major central banks, the relevance of some of the traditional effects of international currency status has declined, while other effects have become more apparent. These developments, which may have a bearing on the conduct and transmission of monetary policy, need to be considered when assessing the balance of economic benefits and costs from a central bank perspective. Specifically, research has highlighted the following factors. First, that international currency status may strengthen the global transmission of domestic monetary policy impulses, with potential reinforcing spillback effects for the domestic economy (see Table 2); and, second, that it lowers exchange rate pass-through, which helps shield inflation from foreign shocks, while it may, at times, attenuate the effects of monetary policy on import prices; and, third, that the “exorbitant duty” of international currency status – the fact that international currencies appreciate in times of global stress and that their central banks of issue are called upon to assume greater responsibility for global financial stability – is the flipside of the traditional “exorbitant privilege” – i.e. of lower external financing costs. Finally, it can be argued that the traditional argument against a stronger international role of currencies, i.e. that it increases the volatility of monetary aggregates, has declined in prominence. The following section reviews these arguments in greater detail.
Table 2
The balance of the benefits and costs of international currency use is changing

Sources: ECB and Coeuré, B., “The euro’s global role in a changing world: a monetary policy perspective”, speech at the Council on Foreign Relations, New York City, 15 February 2019.
Salient developments
In principle, international currency issuers enjoy greater monetary autonomy. Owing to the pre-eminence of the US dollar in the global monetary and financial system, US monetary policy drives – along with global risk appetite – global financial cycles in capital flows and financial asset prices (see Box 6 for evidence in the context of the debate on whether the traditional monetary policy trilemma has morphed into a dilemma).[50] By contrast, central banks in small open economies are typically more heavily exposed to foreign spillovers in setting interest rates than those presiding over an internationally dominant currency.[51] However, foreign factors may still at times influence domestic monetary and financial conditions of international currency issuers. This is suggested by the past experience of the Federal Reserve System. For instance, it is well documented that the large demand for US securities by foreign central banks in the run-up to the global financial crisis contributed to the decline in longer-term US interest rates, thereby partially offsetting the parallel tightening efforts by the Federal Open Market Committee (see Special Feature B for further discussion).[52]
Expected benefits of seigniorage still exist but may have declined. The low interest rate environment has tended to reduce seigniorage benefits that can be expected from the euro’s international role. An additional factor to consider is the impact of increased use of electronic means of payments on the demand for banknotes.
Moreover, concerns about exposure to capital flow volatility as a consequence of international currency status are now less prominent. These concerns featured prominently in discussions about the internationalisation of the Deutschmark in the 1970s, when it was considered that volatile “hot money” flows into financial assets denominated in the Deutsche Mark increased volatility in M3 – the main monetary aggregate monitored by the Bundesbank – thereby complicating the conduct of monetary policy.[53] The enhanced tools for the ECB’s monetary analysis have made these concerns less prominent. Moreover, in a financial globalised economy, the influence of foreign factors on local monetary and financial conditions is not a feature specific to international currency issuers but a feature of any financially open economy.[54]
An additional aspect on which more evidence is now available is that international currency status strengthens the global transmission of monetary policy. This reflects the fact that stronger use of a currency as an international funding unit amplifies the international transmission of monetary policy. This channel is well documented for the US dollar and US monetary policy.[55] When US monetary policy eases, the US dollar depreciates; international lending in dollars grows, because the balance sheets of borrowers in emerging market economies, who often borrow in dollars, appear stronger in US dollar terms; this, in turn, encourages global banks to provide the borrowers in question with US dollar-denominated credit (see the left panel of Chart 22).[56] Another channel for greater international transmission of liquidity shocks may reflect the role of international credit markets within global banking groups. Global banks respond to domestic monetary shocks by managing liquidity globally through an internal reallocation of funds, which affects their foreign lending.[57]
Monetary policy impulses may reverberate globally as a consequence, with wider and possibly larger domestic effects owing to spillbacks. For instance, for an issuer of an international currency, a domestic interest rate cut would ease financial conditions globally and feed demand across the world.[58] The domestic economy could benefit from spillback effects, especially in an economy like the euro area, which is more open to trade than other major economies.
Chart 22
The balance of the benefits and costs of international currency use is changing
Evidence of an international risk-taking channel of monetary policy (left panel) and exchange rate pass-through to import prices versus euro invoicing across euro area countries (right panel)
(left panel: percentages; right panel: percentages and percentages of imports)
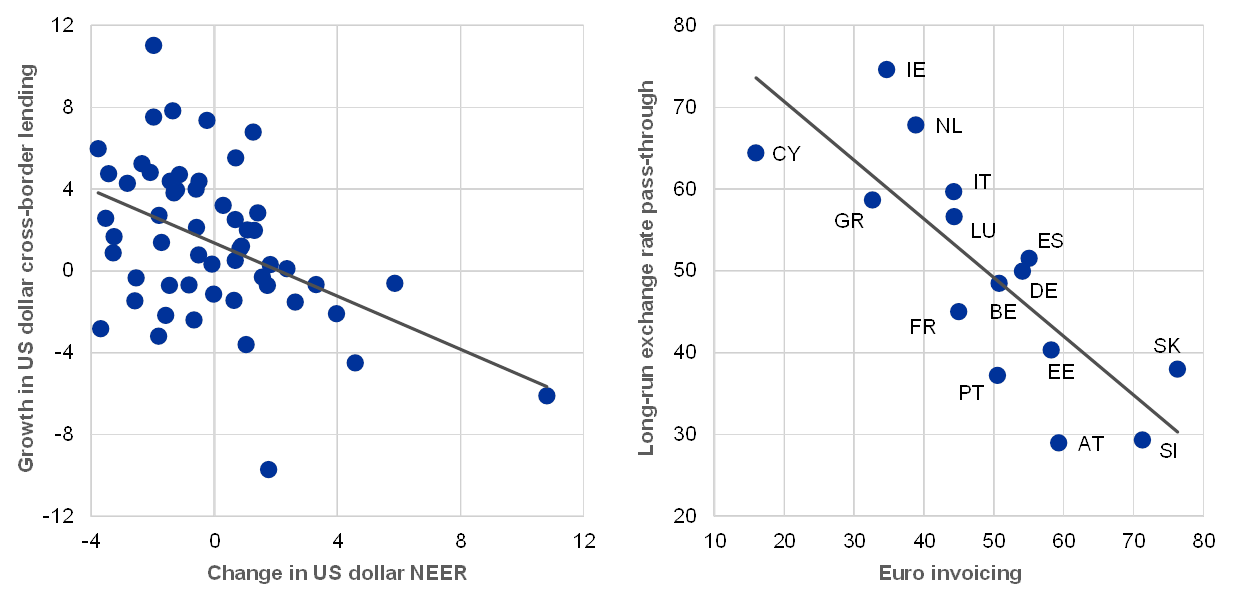
Sources: BIS, ECB and ECB staff calculations.
Notes: left panel: growth in US dollar lending refers to quarterly changes in cross-border loans and deposits in US dollars of BIS reporting banks; NEER stands for nominal effective exchange rate (positive changes indicate a US dollar appreciation); the sample period is Q1 2002‑Q3 2015 as in Avdjiev, S., Koch, C. and Shin, H. S., “Exchange rates and the transmission of global liquidity”, paper presented at the 2018 ASSA Annual Meeting; the black line is a fitted regression line. Right panel: long-run exchange rate pass-through is estimated using a standard log-linear regression model of the quarterly log change in import price unit values on the quarterly changes of the standard broad measure of the NEER‑38 of the euro, a quarterly effective measure of inflation in production costs of the euro area’s major trading partners and the quarterly log change in industrial production (excluding construction); the estimation sample spans the time period from the first quarter of 2000 to the last quarter of 2014; the share of euro invoicing reported on the x-axis is the average over the sample period; the black line is a fitted regression line.
On the other hand, the “exorbitant duty” arising from international currency status has become more apparent since the global financial crisis as the flipside of the traditional “exorbitant privilege”. Because debt securities denominated in US dollars are seen as particularly safe and liquid by international investors, the US dollar tends to be seen as a safe haven in times of heightened global financial stress. In turn, the US dollar appreciates in episodes of global stress, as it did immediately after the collapse of Lehman Brothers in autumn 2008.[59] This led to a decline in the US net international investment position and to large negative external wealth effects for the United States.[60]
Another consideration is that reserve currency issuers may face requests for currency swap lines when availability of international liquidity dries up. This is suggested by the experience during the global financial crisis, when major central banks were more active in providing swap lines.[61] The provision of currency swap lines has been carried out by all major central banks issuing international currencies, in full independence and in line with their respective mandates. Standing swap networks now exist. The global network of currency swap lines has expanded in the past decade, driven also by China’s policies to support the renminbi (see Box 7 for a review of the debate on the link between currency swap lines and international currency status).
Finally, it is now also more apparent that international currencies have lower exchange rate pass-through. The more the domestic currency is used for invoicing international trade transactions, the lower the pass-through to import prices from exchange rate movements. This holds not only over the short run, when prices are sticky, but also over the long run, when they are adjusted by producers.[62] The close correlation between domestic currency invoicing and exchange rate pass-through is noticeable in the euro area (see the right panel of Chart 22).[63] Lower pass-through has two main implications for the conduct and transmission of monetary policy.
First, the effect of domestic monetary policy on import prices is more limited when pass-through is low. If more trade were invoiced in euro, for instance, import prices would react less to an exchange rate depreciation resulting from an accommodative domestic monetary policy shock, as simulations from calibrated general equilibrium models suggest.[64] At the same time, interest rate changes have larger spillovers and spillbacks. In other words, the relative importance and interaction of the interest rate and exchange rate channels of monetary policy change.
Second, lower pass-through shields the Consumer Price Index (CPI) from foreign disturbances affecting the exchange rate. In a low pass-through environment, import prices, and hence inflation as well as inflation expectations, are better shielded from foreign exchange shocks.[65]
Conclusions
The balance of economic benefits and costs arising from the international role of the euro has evolved since 1999. The relevance of some of the traditional effects of international currency status has declined, while other effects have become more apparent. Changes in the global role of the euro would have consequences for the conduct of monetary policy, all of which need to be understood and taken into account when designing the common monetary policy for the euro area.
Box 6
New evidence on international currencies and the monetary policy trilemma
The trilemma, or impossible trinity, is a cornerstone of international macroeconomics. Under the trilemma, policymakers can have at most two of the following three: a fixed exchange rate, free movement of capital and an independent monetary policy. The trilemma is a theoretical hypothesis that rests on the possibility of arbitrage under uncovered interest rate parity. A large body of research in international macroeconomics and finance has tested the empirical validity of the trilemma. Traditionally, the literature has confirmed its predictions, which suggests that it is an empirically valid description of the trade-offs faced by policymakers.[66]
Recent research carried out by ECB staff analysing a sample of 47 advanced and emerging market economies over the period 2002‑2018 confirms these findings in general.[67]
Specifically, the analysis is based on the estimation of Taylor rules and explores whether changes to policy interest rates in so-called centre-countries – i.e. the United States and euro area countries – have an impact on local policy rates after controlling for fundamentals, including real-time forecasts of local inflation and GDP growth, as well as commodity prices and global risk appetite. The findings suggest that the sensitivity of local to centre-country policy rates over and above what can be explained by local fundamentals is dampened by both exchange rate flexibility and obstacles to capital flows (see the left panel of Chart A).
Chart A
New evidence regarding the debate on the monetary policy trilemma versus the monetary policy dilemma
Sensitivity of the local to centre-country policy rate across policy configurations (left panel) and sensitivity of the local to centre-country policy rate among economies with flexible exchange rates (right panel)
(percentages)
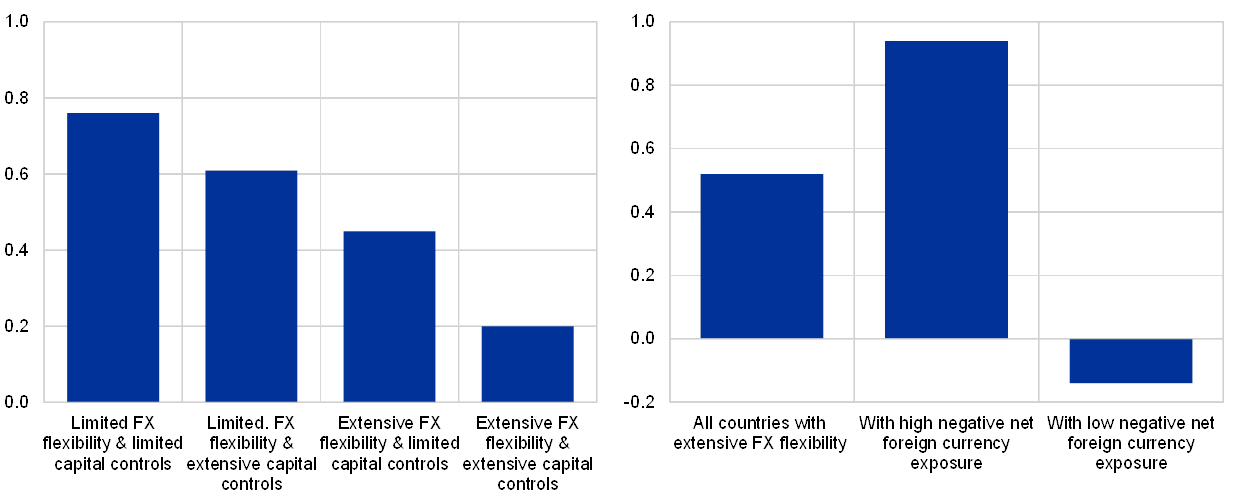
Source: Georgiadis, G. and Zhu, F. (2019), op. cit.
Notes: The bars show the coefficient estimate of the centre-country policy rate. See Georgiadis, G. and Zhu, F. (2019), op. cit. for details on the definition of the policy configurations and net foreign currency exposures.
One particular mechanism through which the dominant role of the US dollar – and potentially the euro in the case of European economies – could have an impact on the empirical validity of the trilemma comes from the implications of foreign currency exposures on economies’ external balance sheets for domestic financial stability in an economy with a flexible exchange rate regime. In such an environment, when the local currency appreciates in response to an easing of monetary policy in the centre economy, those local borrowers that have balance sheets with net short foreign currency mismatches as a result of cross-border borrowing benefit from lower perceived credit risk and increased perceived borrowing capacity. Ultimately, this sets in motion a feedback loop in which accommodative centre-country financial conditions are transmitted to local financial conditions.[68] In turn, when the local currency depreciates in response to a tightening of monetary policy in the centre economy, the feedback loop reverses and local financial conditions tighten, with potential adverse implications for local financial stability. Thus, instead of insulating local financial conditions from base-country monetary policy, the combination of flexible exchange rates and foreign currency exposures may, in fact, amplify spillovers from centre-country monetary policy. To the extent that these spillovers lead to a build-up of vulnerabilities that put at risk financial stability when global liquidity conditions become more restrictive, a local monetary policy response aimed at reducing exchange rate variations to mitigate unwelcome effects arising from this financial channel may be optimal. In other words, it may be optimal for local monetary policy to shadow centre-country monetary policy regardless of the stage of the domestic business cycle, even for those economies for which a flexible exchange rate regime in principle confers monetary policy autonomy.
Recent research analysing the sensitivity of local to centre-country policy rates in economies with flexible exchange rates and across different degrees of foreign currency exposure finds evidence to support this hypothesis.[69] In particular, changes in centre-country policy rates have a stronger impact on local monetary policy in economies with large foreign currency exposures on their external balance sheets (see the right panel of Chart A). In line with the mechanisms discussed in recent literature, further analysis suggests that the reaction of local monetary policy is particularly strong when the local economy has foreign currency liabilities that are larger than foreign currency assets, when foreign currency exposures stem from portfolio debt and other investment items. The reaction is also particularly strong when monetary policy in the centre-country tightens, suggesting that concerns about the financial stability implications motivate local monetary policies. Overall, these findings are consistent with the view that in the presence of foreign currency exposures, it may be optimal for local monetary policy not to exploit the policy space afforded by exchange rate flexibility, but instead to stabilise the exchange rate by shadowing changes in centre-country monetary policy rates. Such developments would be observationally equivalent to those in which the trilemma had morphed into a dilemma, although flexible exchange rates continue to confer monetary autonomy in the absence of large net foreign currency exposures.
Box 7
Currency swap lines and international currency status
International currency status is often bestowed with an “exorbitant privilege” and lower external financing costs. Yet another aspect of international currency status is that it may also come with an “exorbitant duty” and additional responsibilities. In particular, central banks issuing international currencies might be faced with requests for currency swap lines from other central banks when the availability of international liquidity dries up, as the experience from the global financial crisis suggests.[70] However, providing such currency swap lines is not a duty for central banks issuing international currencies, but remains an option, which they consider in full independence and in line with their respective domestic mandates.[71]
The direction of causality between currency swap lines and international currency usage is unclear. On the one hand, some empirical studies show that international currency use helps predict whether countries received swap lines from either the Federal Reserve System or the ECB. For instance, it has been shown that the Federal Reserve was more likely to extend swap lines to countries with large US dollar liquidity shortages, large international financial centres and emerging market countries with which US banks had large exposures.[72] On the other hand, there is also evidence, albeit limited, that causality could flow in the other direction, i.e. that currency swap lines might foster international currency use. Some studies show that swap lines encouraged inflows from recipient countries’ banks into assets denominated in the source country’s currency.[73] Moreover, Gopinath and Stein (2018a and b)[74] show that in theory there are feedback loops between bank funding and trade invoicing, as well as between bank funding and foreign exchange reserves. This suggests that – at least conceptually – providing currency swap lines might help to foster the international use of a currency, since they can be seen as a backstop for bank funding denominated in the international currency. Other studies, however, provide empirical evidence that negative policy interventions designed to discourage international use of a currency have actually been more effective than positive interventions to encourage its use, suggesting therefore that actively promoting the global use of a currency with currency swap lines may not be effective.[75]
Historically, swap lines were provided for three main purposes. First, for the purposes of foreign exchange policy: for instance, as early as 1962 the Federal Reserve established reciprocal currency arrangements to forestall potential official runs on the US gold stock by third countries.[76] Second, for trade policy purposes: swap lines have been granted by reserve currency issuers to facilitate cross-border trade transactions with other countries (for instance, this was initially one motivation for the People’s Bank of China to develop its currency swap network). A third purpose is to offer liquidity support on third markets in the presence of serious market dysfunctions.
This latter purpose was particularly evident during the global financial crisis, when there was a build-up in risky short-term funding in US dollars among European banks preceding the swap lines that were ultimately provided during the crisis. To address pressures in global money markets, the Federal Reserve, together with other major central banks (i.e. the Bank of Canada, the Bank of England, the Bank of Japan, the ECB and the Swiss National Bank) established currency swap lines, which were converted to standing arrangements in October 2013. Moreover, at the height of the financial crisis the Federal Reserve provided temporary swap lines to four emerging market economies (in Asia and Latin America). The ECB has participated in the network of currency swap lines among major central banks since the onset of the global financial crisis and, similarly to the Federal Reserve, established currency swap lines with additional economies, albeit with a different regional focus centred on the euro area neighbourhood.[77]
The left panel of Chart A shows that the share of the US dollar in international debt securities continued to increase after the conversion of dollar swap lines to standing arrangements in 2013. However, it is unclear whether this means that the swap lines in question bolstered the role of the US dollar as an international financing currency, as their effect could have been confounded by other factors.
Chart A
Evidence on the link between currency swap lines and international currency status
Federal Reserve currency swap lines and international role of the US dollar (left panel) and People’s Bank of China currency swap lines and international role of the renminbi (right panel)
(left panel: USD billions and percentages; right panel: CNY billions and percentages)
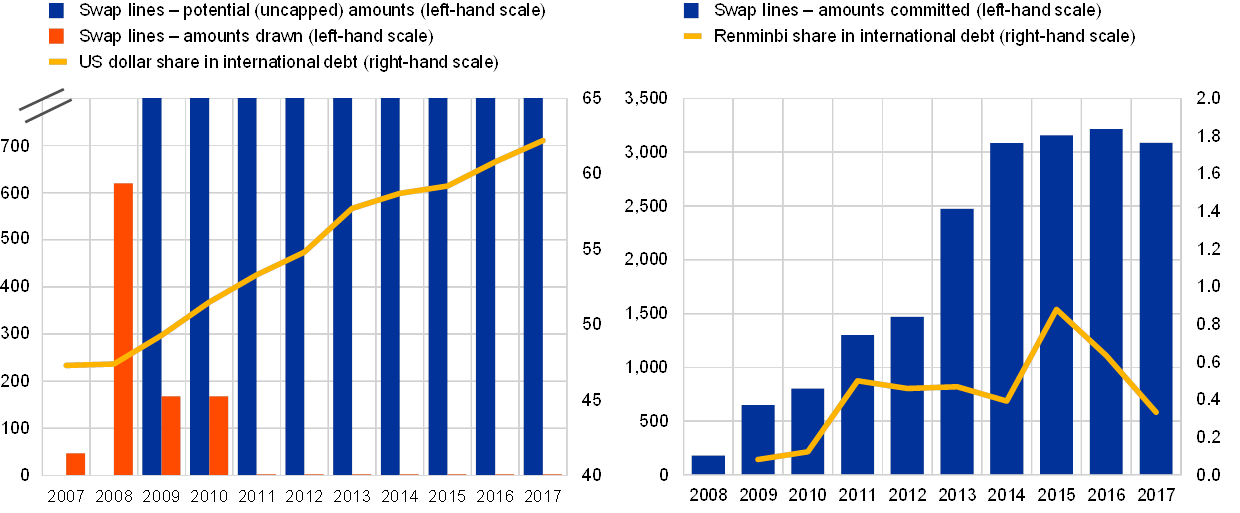
Sources: ECB calculations, BIS, Federal Reserve System and People’s Bank of China.
Note: US dollar shares in international debt statistics, narrow measure, at constant exchange rates.
The PBoC, for its part, had concluded 37 swap line agreements by the end of 2017 with various countries. It has repeatedly stated that these agreements aim to foster use of the renminbi in the medium-term, e.g. because regulators in recipient countries might be more inclined to allow banks and firms to carry out business denominated in renminbi or because recipient central banks might more easily act as lenders of last resort in renminbi after activation of the currency swap lines.[78] The right panel of Chart A, which plots the share of the renminbi in international debt and the size of the People’s Bank of China’s swap lines, suggests, however, that these efforts have still not led to a material increase in the international use of the renminbi in international debt markets (see Box 1 for further evidence on the global role of the renminbi).
Box 8
Overview of the Communication on the international role of the euro issued by the European Commission on 5 December 2018
On 5 December 2018 the European Commission issued a Communication outlining initiatives to strengthen the international role of the euro.[79] This Communication followed up on President Juncker’s State of the Union Address on 12 September 2018 and was tabled as a contribution to the Euro Summit on 14 December 2018. It makes proposals in four areas.
The first area focuses on completing Economic and Monetary Union and banking union, as well as furthering the capital markets union. The Communication mentions initiatives adopted by euro area leaders at the Euro Summit of 14 December 2018, such as the common backstop to the Single Resolution Fund or reform of the ESM Treaty, as well as other proposals, such as those for a European Deposit Insurance Scheme for euro area bank deposits, sovereign bond-backed securities or euro area external representation. It highlights the importance of respecting EU governance rules and sound policies.
The second area concerns measures to make the European financial sector more stable, deeper and more autonomous. The Communication proposes widening the use of the euro by strengthening the liquidity and resilience of European market infrastructures. For instance, it refers to the option of widening the scope of clearing obligations and further incentivising the use of central clearing, subject to the relevant legislative process. It also mentions initiatives involving the Eurosystem, such as the reform of euro area interest rate benchmarks or initiatives in market and payment infrastructures, such as instant payment systems solutions. The Commission launched a public consultation to assess whether frictions affecting euro liquidity in the foreign exchange market exist.
The third area focuses on initiatives targeting the international financial sector. One proposal is to promote the use of the euro in payments and as a reserve currency internationally, and to provide technical assistance to third countries to use euro payment systems. Another is to encourage European institutions (such as the European Stability Mechanism and the European Investment Bank) to increase their share of euro-denominated debt.
The fourth area comprises a series of targeted consultations to explore whether the international role of the euro in specific areas can be strengthened, including oil, refined products and gas, raw materials and food commodities, and transport sector manufacturers (aircraft, maritime and railways).[80] The Commission will report on the insights gained from these consultations by summer 2019.
Table A
Evidence on the link between currency swap lines and international currency status

Sources: ECB.
Like the Commission, the Eurosystem stresses that the international role of the euro is primarily supported by a deeper and more complete EMU, including advancing the capital markets union, in the context of the pursuit of sound economic policies in the euro area. Sound economic policies directly affect the economic and financial stability of the euro area and thus the global standing of its currency. Efforts to complete the measures on the agenda for deepening Economic and Monetary Union would enhance the euro area’s resilience. Deeper and better connected euro area capital markets through further development of the capital markets union would contribute to greater euro area financial integration and deeper and more liquid euro area financial markets. The Eurosystem supports these policies and emphasises the need for further efforts to complete Economic and Monetary Union. Without prejudice to the ECB’s independence, the Eurosystem is also aware of the European Commission’s support for its initiatives on market infrastructure and payments, which help increase efficiency and bring greater financial market integration in the euro area. These efforts may also have the knock-on effect of strengthening the international role of the euro. Table A provides an overview of the most important determinants of the international role of the euro and recalls the key policy levers which exist to influence them.
Quantifying the “exorbitant privilege” – potential benefits from a stronger international role of the euro
A much discussed benefit of international currency status is the “exorbitant privilege”.[81] Demand by official investors for safe and liquid foreign currency assets to acquire and hold foreign exchange reserves reduces the financing costs of governments in reserve currency countries. While there is broad consensus that the United States enjoys such an “exorbitant privilege”, as yet there is limited evidence as to how this compares to other major issuers of international currencies. This second special feature aims to fill this gap, focusing on foreign exchange reserve holdings in euro and their effect on euro area sovereign financing costs.
This special feature aims to quantify the “exorbitant privilege” of international currency status for major currencies. It explains that the relevant metric for this purpose is the share of foreign official holdings in the stock of outstanding highly rated debt – a metric for which the euro is at par with the US dollar.[82] Estimates from a simple error-correction model that aims to disentangle long-run stock effects from short-run flow effects of net purchases of sovereign debt by foreign official reserve holders suggest that the “exorbitant privilege” enjoyed by some highly rated euro area sovereigns is economically significant. Foreign official reserve holdings of highly rated debt securities have compressed term premia on euro area long-term yields by around 110 basis points, which compares to around 160 basis points for the United States. But foreign official holdings of euro area government debt are concentrated in a few euro area sovereigns issuing highly rated debt securities. Strengthening the credit quality of outstanding debt, notably by pursuing sound and sustainable fiscal policies, would contribute to increasing the supply of safe euro area debt and raising the euro’s global appeal. This, in turn, would help the euro’s “exorbitant privilege” to be more widely shared across euro area sovereigns.
The “exorbitant privilege” and sovereign financing costs
It is often argued that countries issuing an international reserve currency enjoy an “exorbitant privilege”, akin to lower financing costs. The term “exorbitant privilege” was originally coined by French finance minister, Valéry Giscard d'Estaing, in the 1960s to emphasise the unique role of the US dollar in the Bretton Woods system which, allegedly, allowed the United States to lower external financing costs, since US debt provides international official investors with insurance against volatile capital flows and exchange rate risk. Today, it has acquired a broader meaning, referring to benefits enjoyed by countries in the form of either external borrowing costs or net returns on their international investment position. Measured by the return on net foreign assets, the United States has clearly enjoyed such a privilege over the past decades.[83] For other major issuers of international currencies, the evidence is mixed and depends on the period considered.[84] However, under this broader definition, the term might confound different effects, such as international profit shifting of multinational firms, which is not related to international currency status. This special feature therefore focuses on the original definition of the “exorbitant privilege”, namely the ability of sovereigns to issue debt internationally at lower interest rates.
Such an “exorbitant privilege” in terms of lower external financing costs is often attributed to the US dollar given the currency’s dominant role in global official holdings of foreign exchange reserves (see Chart 23). Not only do official investors own a large share of outstanding amounts of US Treasury bonds, but their demand for them displays relatively low price elasticity: whatever the price (or inversely the yield) of the bonds in question, demand remains largely stable. Therefore, foreign reserves accumulation should contribute to compress yields by creating excess demand for these securities. This relationship appeared to be particularly strong in the mid‑2000s, when the United States experienced strong capital inflows. During that period, emerging market economies, notably China and oil exporters, built up large holdings of foreign exchange reserves, mainly in the form of US Treasuries. This phenomenon – also known as the “global savings glut” – was held responsible for compressing US Treasury yields and keeping them from responding to the tighter monetary policy of the Federal Reserve System after 2004.[85] In investigating the effects of inflows from foreign official investors, several empirical studies suggest that USD 100 billion worth of foreign investor purchases of US Treasuries compressed 10‑year yields by around 50 basis points.[86]
The effect of sovereign debt purchases by (foreign) official investors on yields largely depends on the stock of debt purchased. With central banks implementing large asset purchase programmes after the global financial crisis, a number of studies have aimed to quantify the transmission effects of central bank bond purchases on yields.[87] According to these studies, stock effects are more important than flow effects.[88] The latter are defined as the response of yields to ongoing purchases, whereas the former describes persistent changes in yields resulting from movements along the demand curve of the asset. Stock effects thus occur by reducing the free float of assets i.e. the share of outstanding debt in the hands of private, price-sensitive investors.[89] A lower free float of sovereign bonds compresses yields not only of the particular maturity purchased (owing to scarcity effects), but initiates a general repricing of sovereign debt along the yield curve by removing duration risk from the market (the so-called duration extraction channel).[90] The effects of global official holdings of foreign exchange reserves on yields thus depend not only on the additional demand for sovereign assets from foreign official investors, but also on how their purchases affect the whole free float of debt. Hence, demand by foreign central banks for sovereign debt securities needs to be seen in relation to the outstanding amount of government debt.[91]
Chart 23
The share of foreign official holdings in outstanding sovereign highly rated debt is broadly similar for the euro and the US dollar
Share of foreign official holdings of outstanding sovereign debt
(percentages)
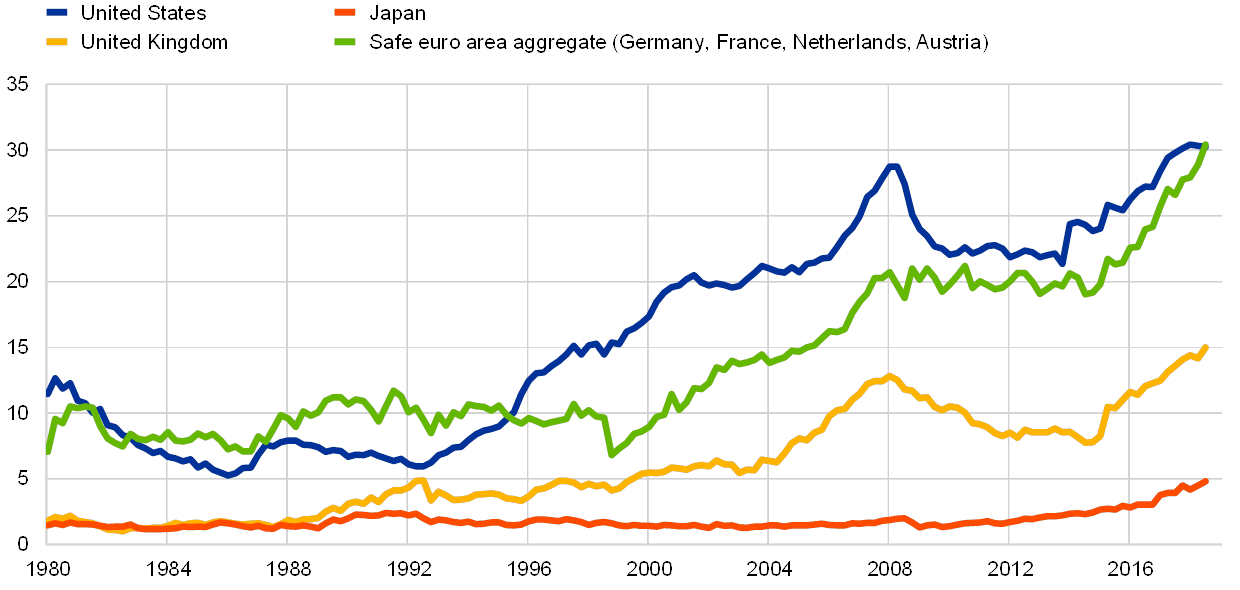
Sources: IMF and ECB staff calculations.
Note: Both central banks’ foreign currency holdings and general government debt are in USD millions to strip out valuation effects.
Based on foreign official holdings relative to the stock of outstanding highly rated debt – the metric used to measure the “exorbitant privilege” – the euro is at par with the US dollar. Chart 23 shows global holdings of foreign exchange reserves in relation to outstanding debt. In the case of foreign central banks’ demand for euro-denominated assets, one constraint is safety. Central bank reserves are typically held in debt securities with high credit ratings, which include only a subset of euro area sovereign debt. Considering the pervasive inertia in the composition of international reserve portfolios, it is assumed that central banks hold sovereign debt only of those issuers which were highly rated for most of their rating history.[92] Overall, foreign central banks now hold about 30% of both US and euro area highly rated government debt securities, against only 15% and 5% of UK and Japanese government debt securities, respectively.
Quantifying the effect of foreign central bank holdings on sovereign financing costs
The “exorbitant privilege” stemming from foreign central bank holdings of outstanding safe debt should be reflected in the term premium. The term premium corresponds to that component of long-term government bond yields that cannot be explained by market expectations of future short-term interest rates. Short-term interest rates (and expectations thereof) are, in turn, largely determined by the outlook for growth and inflation.[93] Exogenous investments in government securities by either domestic or foreign central banks should primarily affect term premia. In particular, increases in global holdings of foreign exchange reserves relative to outstanding debt should translate into lower term premia.[94] Estimates of government bond term premia are therefore well suited to capturing the effects from foreign central bank holdings on yields. Chart 24 shows term premium estimates for government bonds with a residual maturity of ten years across the four largest currency areas since the 1980s. Developments in term premia estimates do not immediately reveal the effects of foreign official investments, which need to be carefully identified. In fact, term premia estimates for the United States and the euro area have been higher on average than those for Japan and the United Kingdom, although the share of foreign central bank holdings in the latter two sovereigns’ outstanding debt is lower.
An error-correction model can help to quantify the effect of foreign central banks’ asset holdings on sovereign debt term premia. Relatively higher term premia in the United States and the euro area, might be explained by other determinants such as higher compensation of inflation risk, which was particularly pronounced in the United States in the 1980s. Another confounding determinant could be the effect of domestic central banks’ quantitative easing policies, which also have an impact on the free float of sovereign debt – bearing in mind that Japan resorted to such policies well before other major economies. To address these identification challenges, a pooled auto-regressive distributed lag (ARDL) model is employed that explains developments in term premia (TP) for the four major currency areas (United States, United Kingdom, Japan and EMU) with developments in foreign central bank holdings (FCBH), domestic central bank holdings (DCBH) as well as country-specific fundamentals (F), including the level and volatility of growth and inflation[95],[96]
As proposed by Beltran et al. (2013), the distributed lag structure of the model equation makes it possible to distinguish long-run stock effects of foreign central bank reserve holdings, , from short-term flow effects captured by the coefficient . Similarly, and capture the stock and flow effect from purchases of the domestic central bank in the context of asset purchase programmes. Finally, country fixed effects capture unobserved time-invariant country-specific determinants of the term premium.[97] Table 3 reports estimates of the model equation using annual data for the period 1980‑2018.[98]
Chart 24
Global term premia are on a declining trend
Term premia estimates on risk-free government securities with 10‑year residual maturity
(percentages)

Sources: Federal Reserve Board, Japan’s Ministry of Finance, Bundesbank, Bank of England, ECB and ECB staff calculations.
Notes: Term premia estimates are obtained from a dynamic Nelson Siegel model of the sovereign yield curve using monthly par yields at maturities from one to ten years. The euro area aggregate is derived from the German sovereign yield curve between 1980 and 2004, updated by a debt-weighted country aggregate for the German, French, Dutch and Austrian yield curves since 2005. The term premium corresponds, at each point in time, to the difference between the fitted ten-year yield and the path of projected short-term rates over a ten-year horizon.
Table 3
Panel estimates of the long-run and short-run determinants of term premia
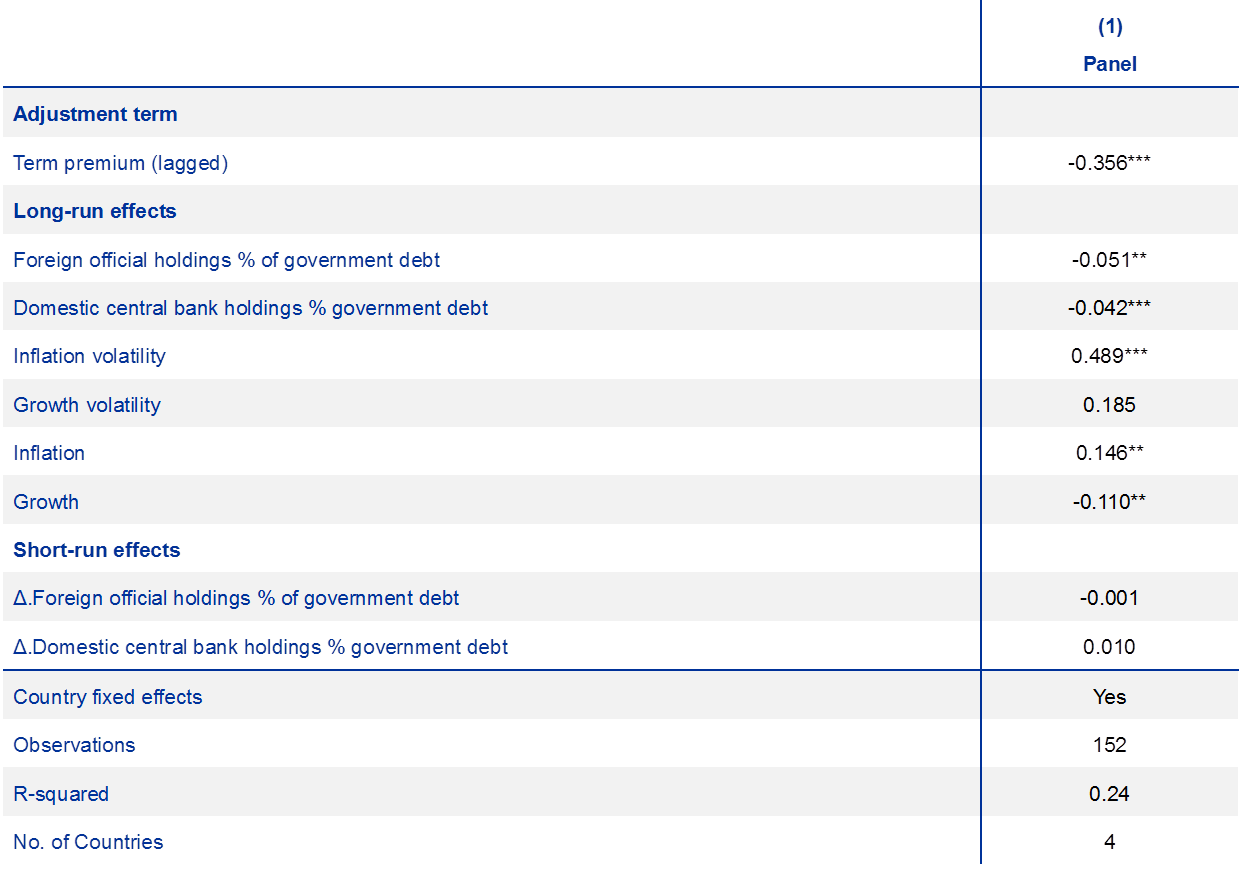
Source: Gräb, J. Kostka, T. and Quint, D., The “exorbitant privilege” – a cross-country perspective, 2019.
Note: Driscoll and Kraay standard errors are used which are heteroscedasticity consistent and robust to general forms of cross-sectional and temporal dependence. *** p<0.01, ** p<0.05, * p<0.1.
Foreign central bank holdings of government debt are found to have a significant impact on term premia. The estimated long-run effect of foreign central bank holdings relative to outstanding government debt on term premia is negative, in line with expectations, and statistically significant at the 5% level. The coefficient estimates suggest that an increase in foreign central bank holdings by 10 percentage points of the outstanding stock of debt lowers the term premium on average by 50 basis points.
Stock effects matter, while evidence for flow effects is more limited. One advantage of the model equation is that it helps to disentangle long-run stock effects stemming from reducing the free float of assets from short-run flow effects, stemming from actual net purchases of the assets in question. The results provide strong evidence for the prevalence of stock effects of asset purchases. By contrast, the estimated short-run flow effect of central banks’ net purchases of government debt, which in the model is captured by the first differences of the share of central bank holdings, is not statistically significant from zero either for domestic or for foreign central banks.[99]
Moreover, the impact of foreign central bank holdings of government debt on term premia is estimated to be similar to the impact of domestic central bank holdings. The estimated effect of domestic central bank holdings is similar to the estimated effect of foreign central bank holdings.[100] Hence, the impact on term premia of holdings of sovereign debt securities acquired via large-scale asset purchase programmes undertaken by the major central banks or by foreign central banks building up holdings of foreign exchange reserves is about the same.[101]
Finally, the marginal impact of central bank holdings on term premia varies somewhat across major economies. Breaking down the sample by currency suggests that, in particular, stock effects for euro area debt are somewhat smaller than the full sample estimates. In view of the small sample size and given the equivalence of the estimated effects of foreign and domestic central bank purchases, only aggregate central bank holdings are considered for the country-specific regressions.[102] A decline in the free float by 10 percentage points lowers the term premium on euro area highly rated assets by 36 basis points (see Table 4). For the United States, the estimates are larger and close to the full sample estimates. Accordingly, this might point to lower price-sensitivity of foreign official investors to US dollar-denominated debt securities relative to debt securities denominated in other reserve currencies. Again, flow effects are statistically insignificant, which suggests that the main channel works via long-run stock effects.
Overall, the total stock effect of foreign central bank purchases on euro area risk-free yields, which can be interpreted as measuring the exorbitant privilege, is estimated to reach around 110 basis points. Foreign central banks hold around 30% of euro area safe government bonds outstanding. Considering the country-specific semi-elasticity according to which 10 percentage points of central bank holdings in debt outstanding lowers the term premium by 36 basis points, total foreign central bank holdings would have lowered the euro area term premium by around 110 basis points. In contrast, the US estimates (combined with the stock of foreign holdings of US debt) suggest that the US dollar’s “exorbitant privilege” is around 160 basis points.
Table 4
Currency-specific estimates of long-run and short-run determinants of term premia

Source: Gräb, J. Kostka, T. and Quint, D. (2019), op. cit..
Note: The constant is not reported. Driscoll and Kraay standard errors are used which are heteroscedasticity consistent and robust to general forms of cross-sectional and temporal dependence. *** p<0.01, ** p<0.05, * p<0.1.
From a dynamic perspective, the model can be used to explain developments in term premia over time. In particular, higher foreign official reserves holdings relative to outstanding free float of debt can partly explain the new compression of global term premia observed in the past couple of years. Since late‑2015, the Federal Reserve System has gradually increased the federal funds rate, with expectations about a “lift-off” crystallising since early‑2014. In addition, the Federal Reserve has started to reduce its holdings of US Treasuries. Term premia on 10‑year Treasury yields declined markedly notwithstanding these decisions to normalise the stance of US monetary policy – a phenomenon similar to the previous tightening cycle by the Federal Reserve of the mid‑2000s, which the then Chairman Greenspan labelled the low bond yield “conundrum”.[103] But time-varying estimates of the “exorbitant privilege” suggest that a build-up of US Treasury (and euro area debt) holdings relative to outstanding debt markedly have contributed to the decline in US and global term premia since early 2014, helping to explain developments in bond markets (see Chart 25). Foreign central banks reduced the free float of US Treasuries by around 10 percentage points between 2014 and 2018, thereby lowering US term premia by around 50 basis points.[104] A smaller free float of euro area highly rated debt may have additionally weighed on global term premia in view of the fact that there are large cross-country correlations between term premia on safe assets.
Chart 25
The exorbitant privilege has gradually increased over time
Exorbitant privilege
(Q1 1980‑Q2 2018; basis points)
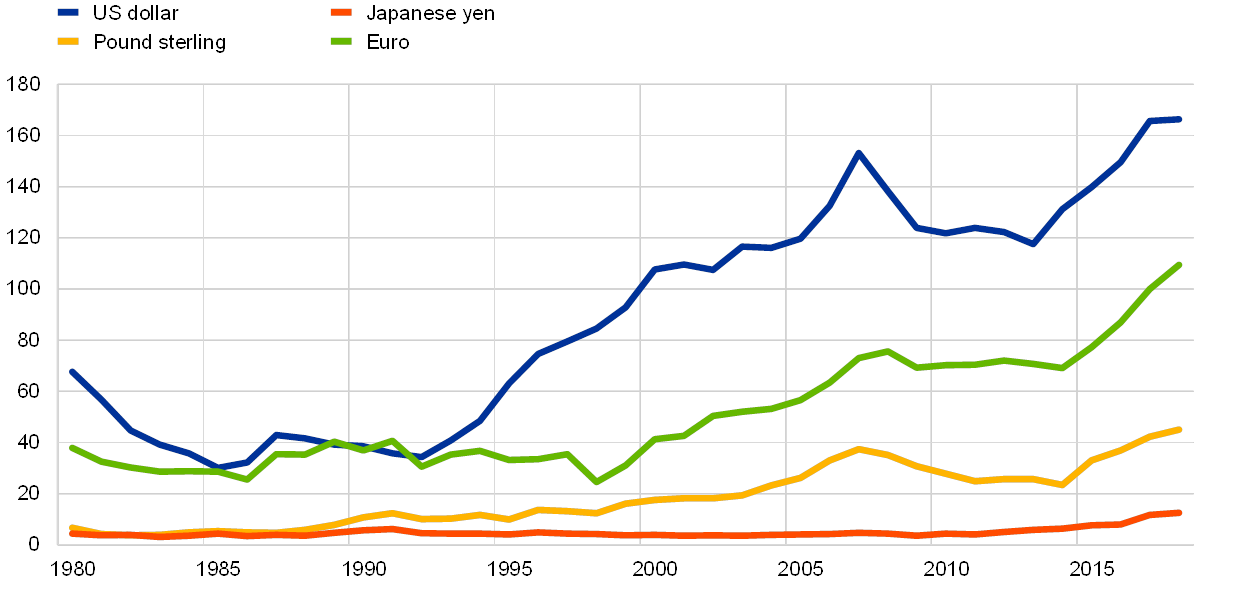
Sources: IMF and ECB staff calculations.
Note: The “exorbitant privilege” is calculated by multiplying the country-specific estimates on the long-run effect by the share of foreign central bank holdings of outstanding general government debt.
Conclusions
Some euro area sovereigns enjoy an economically significant “exorbitant privilege” stemming from large holdings of foreign central banks relative to outstanding euro area safe debt. As foreign central bank holdings of euro area government debt are concentrated in a few euro area countries issuing debt that is seen as risk-free, the “exorbitant privilege” can be interpreted as having contributed to widening intra-euro area sovereign bond spreads. One ingredient for a stronger international role of the euro is to have a larger supply of safe assets. This can, for instance, be achieved by maintaining or restoring sound and sustainable fiscal policies throughout the euro area. In the longer term, the creation of a common euro area safe asset, if so decided by Member States, in a way that does not undermine incentives for sound national fiscal policies, could also contribute to this objective. An indirect benefit of a strong international role of the euro would be that the euro’s “exorbitant privilege” would be more widely shared across euro area sovereigns.
Implications of dominant currency pricing for the global transmission of US and euro area shocks
The US dollar plays a special role in the global economy. As emphasised by Gopinath (2015), it is the main currency used for trade invoicing.[105] Moreover, a large share of cross-border financial exposures involves assets and liabilities denominated in US dollars. Importantly, both for trade flows and financial exposures, a large share of transactions that do not involve the United States are denominated in US dollars.
This special feature assesses the role played by the US dollar in trade invoicing for the global transmission of US and euro area monetary policy shocks. It provides evidence on differences in shock transmission from the traditional perspective of producer-currency pricing and from the perspective of dominant currency (i.e. US dollar) pricing. In addition, it provides simulations from ECB‑Global, the ECB’s main structural macroeconomic model for the analysis of global spillovers.[106] It shows that dominant currency pricing amplifies the effects of US monetary policy on US and global trade. Moreover, the special feature shows that dominant currency pricing does not significantly alter the domestic effects of euro area monetary policy, but that it reduces the effects of euro area monetary policy on global exports.
The dominance of the US dollar in global trade invoicing
The US dollar is the dominant currency for trade invoicing globally (see Chart 26). In particular, emerging market economies invoice the bulk of their exports in US dollars, regardless of the destination. Similarly, their imports are also largely invoiced in US dollars, regardless of the source. This phenomenon is known as dominant currency pricing (DCP), in contrast to producer-currency pricing (PCP), and local currency pricing (LCP).[107] Under PCP, exports are priced in and export prices are sticky or rigid (i.e. do not adjust instantaneously to shocks) in the producer’s currency, against the currency of the importer under LCP or the currency of a third economy, typically the US dollar, under DCP. The export pricing paradigm matters only if prices are sticky, insofar as fully flexible prices can adjust instantaneously to shocks regardless of the currency in which they are set.
Recent research has assessed the empirical relevance of DCP. In particular, Casas et al. (2017) provide evidence that is consistent with the predictions from DCP using micro-data on trade for Colombia, which is that trade prices tend to respond more to variations in the bilateral exchange rate of the Colombian peso against the US dollar rather than against other currencies.[108] Specifically, Casas et al. (2017) document economically and statistically significant estimates of pass-through from variations in the bilateral exchange rate of the Colombian peso against the US dollar to Colombian export and import prices in peso terms. Importantly, when they control for the bilateral exchange rate of the peso against the US dollar, the estimate of pass-through from variations in the bilateral exchange rate of the peso against the currency of the export destination/import origin is neither economically nor statistically significant. Moreover, Casas et al. (2017) document that Colombian export and import quantities respond to variations in the bilateral exchange rate of the peso against the US dollar regardless of the trading partner, but not to variations in the bilateral exchange rate of the peso against the currency of the trading partner. Boz et al. (2017) generalise these findings by examining a bilateral dataset of trade flows and prices for 55 economies.[109] They also provide evidence that a multilateral appreciation of the US dollar reduces trade globally, even for trade that does not involve the United States.
Chart 26
The US dollar dominates global trade invoicing
Currency denomination of exports (top panel) and imports (bottom panel)
(percentages)
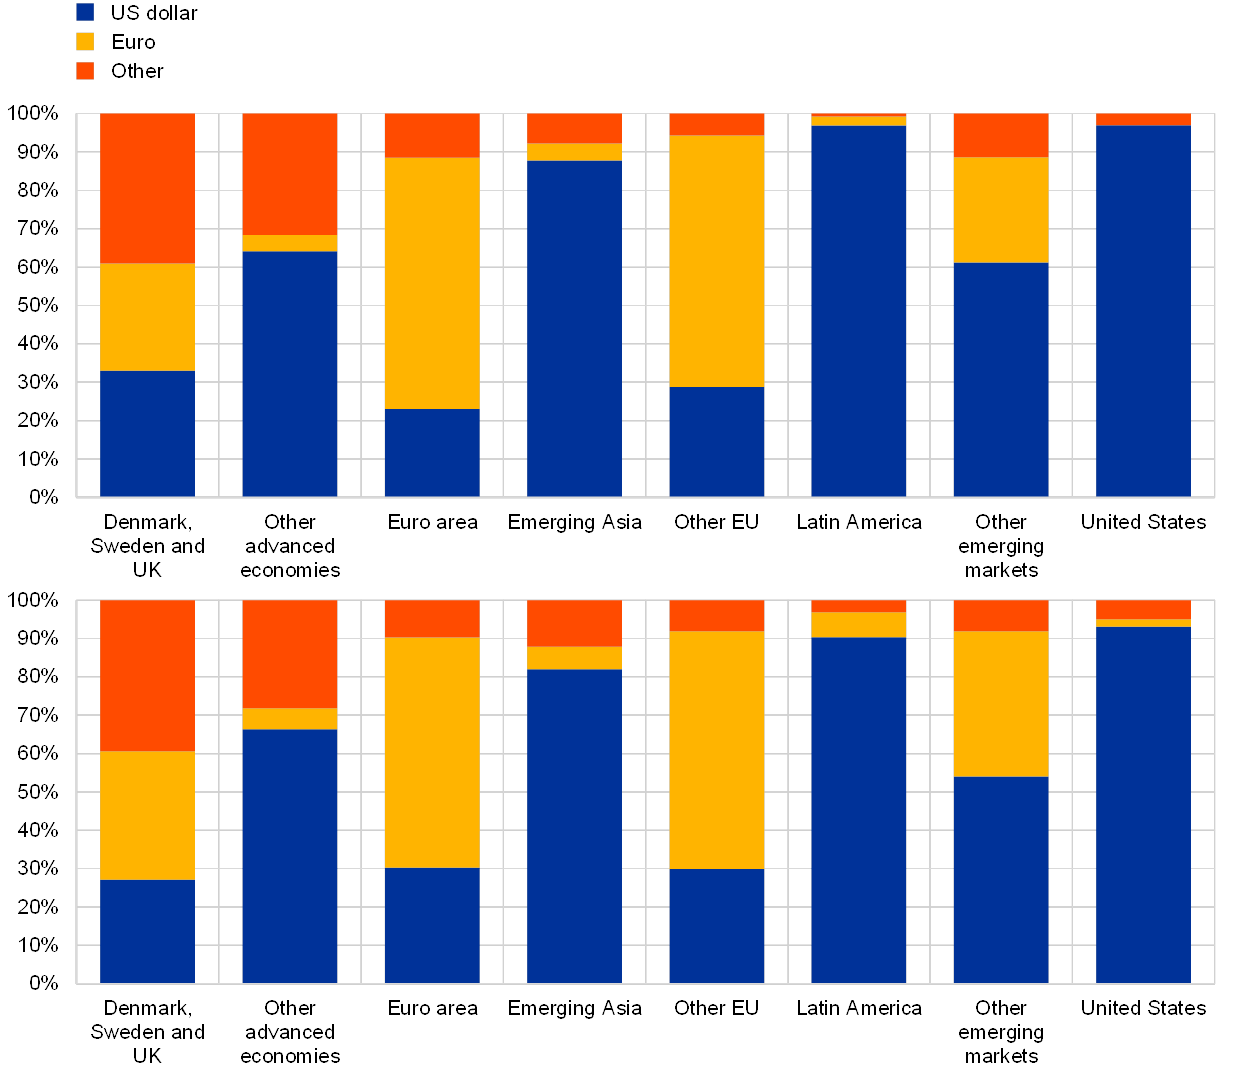
Sources: Gopinath (2015) and ECB calculations.
Notes: The estimates for the euro area include intra-euro area trade. Data for regional groups are aggregated using simple averages of country-level data.
Finally, Georgiadis and Schumann (2019) show that under DCP, output spillovers from a shock that leads to a multilateral appreciation of the US dollar depend on the differences between economies’ shares of exports and imports invoiced in US dollars.[110] Specifically, when the share of an economy’s exports invoiced in US dollars is larger than the corresponding share of imports, then the appreciation of the US dollar depresses the economy’s exports more strongly than its imports, thereby reducing net exports and hence GDP. Georgiadis and Schumann (2019) also provide empirical evidence for a sample of almost 50 advanced and emerging market economies that is consistent with this prediction. Output spillovers from positive US demand or as a result of a contractionary US monetary policy shock are negatively correlated with the difference between the share of exports invoiced in US dollars on the one hand, and the share of imports invoiced in US dollars of spillover-recipient economies, on the other hand. Moreover, this is the case even after controlling for other transmission channels and the role of commodity trade.
The implications of export pricing paradigms in ECB‑Global
We use ECB‑Global to illustrate the differences in the transmission of shocks to the global economy under PCP and DCP. ECB‑Global is a rich semi-structural, multi-country model for the euro area, the United States, Japan, the United Kingdom, China, the rest of emerging Asia, oil-producing economies and the rest of the world featuring diverse real and financial cross-border spillover channels.[111] The evolution of the economies in ECB‑Global is determined by a set of core structural relationships (e.g. Phillips and IS curves). The advantage of the structural elements of ECB‑Global is that shocks have a clean economic interpretation, and that these facilitate tracking the domestic and international transmission of shocks. Reduced-form equations are added to enrich the core of ECB‑Global. The reduced-form aspect of ECB‑Global has the advantage that it facilitates modifying the model in a flexible manner so that it can be adapted relatively straightforwardly. Moreover, the additional reduced-form elements improve the empirical fit of ECB‑Global.
To illustrate the implications of DCP in ECB‑Global, we discuss below the global effects of US and euro area monetary policy shocks. Owing to space constraints, we do not discuss individually the effects on other economies modelled in ECB‑Global.[112]
US monetary policy shocks
In ECB‑Global, domestic output responses to a 25 basis points contractionary US monetary policy shock are almost identical under PCP and DCP (see the left panel of Chart 27). A contractionary US monetary policy shock leads to an appreciation of the US dollar. Under PCP, this lowers the US dollar price of imports to the United States, which in turn encourages firms and consumers to switch to imports away from domestic production. In contrast, under DCP exports to the United States are priced in US dollars. The appreciation of the US dollar therefore implies US import prices are essentially unchanged in US dollar terms, which weakens expenditure switching from domestically produced goods in the United States to imports relative to PCP. This amplifies the contraction in US imports that results from the slowdown in domestic real activity owing to the tightening in monetary policy relative to PCP. Overall, however, as net exports account for only a small share of US GDP, the difference in output effects between PCP and DCP are small.
The differences in the implications of a contractionary US monetary policy shock across PCP and DCP for spillovers to the global economy in ECB‑Global are significant for trade (see the right panel of Chart 27). Consistent with the findings in Boz et al. (2017), the tightening in US monetary policy elicits a much stronger slowdown in global trade under DCP than under PCP; in fact, global imports decline almost twice as much and exports more than twice as much under DCP than under PCP. The reason for this is that, under DCP, a large share of global trade prices are in US dollars, even if the related trade does not involve the United States. As a result, a large share of global imports becomes more expensive in local currency terms in response to a multilateral appreciation of the US dollar, which elicits expenditure-switching from imports to domestically produced goods. In contrast, under PCP, trade which does not involve the United States is not subject to expenditure switching, as non-US dollar bilateral exchange rates remain essentially unchanged in response to the US monetary policy contraction. The impact on global activity is more limited as economies’ imports and exports fall in parallel.
Chart 27
DCP amplifies the effects of US monetary policy on US and global trade
Impact of a US monetary policy shock on the US economy (left panel) and the non-US global economy (right panel)
(deviation from baseline in percentages)

Source: ECB calculations based on ECB‑Global.
Note: The chart shows the average response over the first two years.
Euro area monetary policy shocks
In contrast, the global effects of a contractionary euro area monetary policy shock differ much less between DCP and PCP (see the right panel of Chart 28). The only noticeable differences concern global imports, which are somewhat less sensitive to a monetary policy contraction in the euro area. The reason is that, under DCP, trade prices are sticky in US dollars and are therefore insulated from the appreciation of the euro triggered by a tightening of euro area monetary policy.
The domestic effects of a contractionary euro area monetary policy shock are also very similar under DCP and PCP (see the left panel of Chart 28). The only difference arises for exports, which fall – consistent with the findings in Casas et al. (2017) – somewhat less under DCP than under PCP. Again, the reason for this is that the prices of a non-negligible share of the euro area’s exports are sticky in US dollar terms under DCP, which insulates these exports from the multilateral appreciation of the euro. Most importantly, the differences in the responses of imports and exports across DCP and PCP are too small to noticeably alter the domestic effectiveness of euro area monetary policy in terms of its impact on real activity.
Chart 28
DCP does not greatly alter the domestic effects of euro area monetary policy but does reduce the effects of euro area monetary policy on global imports
Domestic effects (left panel) and spillover effects (right panel) of a euro area monetary policy shock
(deviation from baseline in percentages)
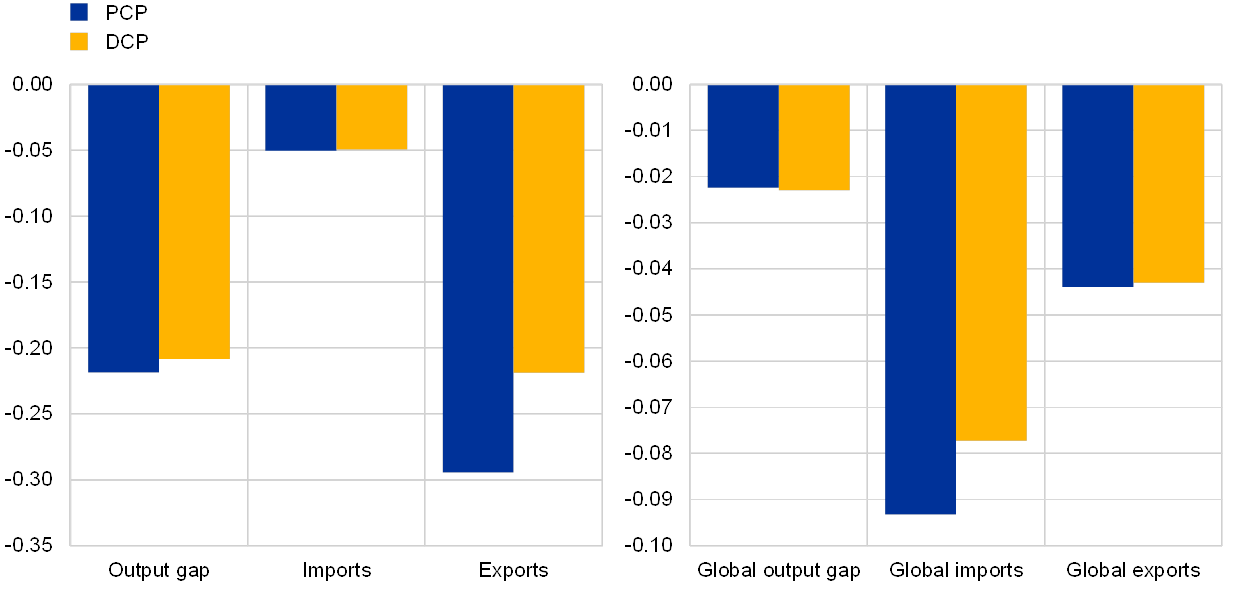
Source: ECB calculations based on ECB‑Global.
Note: The chart shows the average response over the first two years.
Conclusion
Evidence suggests that DCP is an empirically relevant pricing paradigm in global trade. The nature of the transmission of shocks in systemic economies to the rest of the world under DCP differs from the cases of pricing paradigms traditionally considered, such as PCP or LCP. To better calibrate economies’ policies in the future, it is therefore important to improve understanding of the implications of DCP.
Euro-US dollar exposures in cross-border banking
Introduction
This special feature provides stylised facts on the relative importance of the euro and the US dollar as the main denomination currencies for cross-border bank positions.[113] The dominant role of the two currencies exposes banks’ balance sheets to movements in the euro-US dollar exchange rate. The currency composition of cross-border bank positions is therefore a critical dimension for the study of the international transmission of shocks across banking systems. This special feature focuses on 28 advanced and emerging market economies to analyse cross-country heterogeneity in the currency mix of banking systems’ cross-border assets and liabilities, using data from the BIS locational banking statistics.[114] In addition to reporting changes in currency exposures since the global financial crisis, this special feature also considers their relation to the geographic exposures in cross-border banking as well as to the currency mix of banks’ local positions. It identifies three main stylised facts, namely: that the majority of national banking systems have larger net assets in euro than in US dollars; that dispersion in net currency exposures has declined; and that exposures to the euro and the US dollar in net cross-border positions are associated with geographic exposures and banks’ currency exposures in local positions.
Context
Global banks played a key role in shaping developments in international capital flows before, during and in the aftermath of the global financial crisis. Following the rapid growth in cross-border banking positions in the pre-crisis period, banks in advanced economies were a key driver of the great retrenchment of international capital flows at the peak of the global financial crisis and have recorded subdued cross-border flows ever since.[115]
Currency exposures and currency mismatches of banking systems are important for understanding the international transmission of shocks. A prominent example of this was the US dollar funding shortage which hit major European banks during the global financial crisis, after they had built up rapidly growing positions in US dollar funding markets during the pre-crisis period.[116] More generally, valuation effects on foreign currency exposures have been found to be sizeable and a key channel for the international transmission of monetary policy, as changes in the monetary policy stance also affect banks’ balance sheets via exchange rates.[117]
The US dollar and the euro have pre-eminent roles in global cross-border investment positions.[118] In global cross-border banking positions – which cover assets and liabilities vis-à-vis banks and non-banks – the shares of the US dollar and the euro stood at around 50% and 30% respectively at the end of 2017. While the US dollar has long served as the major international funding currency, recent evidence indicates that during the post-crisis period the euro has also emerged as an international funding currency, at least at the European level. This is the motivation for focusing the analysis on these two currencies.[119] For the key currencies in cross-border banking positions, “currency networks” exist which transmit monetary policy spillovers from the major central banks.[120]
Methodology
The cross-border dimension is a natural starting point to study currency exposures. This traditional approach in international economics assumes that country borders are aligned with currency areas. Each economic area issues its own currency and its use is largely confined to that area.[121] This notion is also reflected in the residence principle perspective followed in the compilation of balance of payments and international investment position statistics. However, one implication of financial globalisation is that this traditional view can be misleading, because currencies are also used across borders.[122]
To understand the relative importance of the euro and US dollar cross-border funding and lending in banking systems, this special feature analyses the euro-US dollar currency exposure in banks’ net external assets.[123] As a first step, relative currency exposures are calculated for gross external positions as
where and are cross-border positions of the banking system of country i in year t denominated in euro and US dollars, respectively. These indicators are computed for assets and liabilities separately and denoted as and respectively. We refer to these as currency exposures in the gross external positions. External banking assets and liabilities largely consist of loans and deposits, respectively, and also include debt securities.[124] The currency exposures in the gross external positions measure the extent to which a country’s banking system has a larger share denominated in euro (if positive) or US dollar (if negative). By construction, these indicators range between ‑100 and +100.
As a second step, the euro-US dollar exposure in the net external position is defined as the weighted difference between the currency exposure in the gross positions ( and ). More precisely, the currency exposure in the net position is given by
where the weights are
with and representing the sum of euro and US dollar cross-border assets and liabilities, respectively. also takes values between ‑100 and +100. A country’s banking system is deemed to be “long euro” (or equivalently short US dollar) in its net position if the indicator is positive.[125] A “long euro” position implies that a country’s banking system has a larger cross-border net creditor position in euro than in US dollars (or equivalently a smaller net liability position in euro than in US dollars).
Three stylised facts
A majority of national banking systems has larger net assets in euro than in US dollars. The left panel of Chart 29 reports the cumulative distribution of net euro-US dollar exposures (FXAGG) in 2017. It shows that around 60% of the country sample is “long” euro, with the largest net euro exposures being recorded in non-euro area advanced and emerging market economies. This reflects the important role of the US dollar as an international funding currency, leading to larger net liability positions in US dollars, while at the same time the majority of the country sample shows net asset positions in euro. Generally, there is a wide range in net euro-dollar exposures, partly reflecting an even wider variation in terms of the currency composition of the underlying gross asset and liability positions. Unsurprisingly, euro area countries exhibit larger cross-border gross external positions denominated in euro than in US dollars, while the United States, Canada and many emerging market economies are on the other side of the spectrum.
Chart 29
A majority of national banking systems has larger net assets in euro than in US dollars, while the dispersion in net currency exposures has shrunk since the crisis
Cross-country distribution of net euro-US dollar cross-border banking exposures in 2017 and changes between 2007 and 2017
(left panel: FXAGG units and cumulative distribution; right panel: FXAGG units)
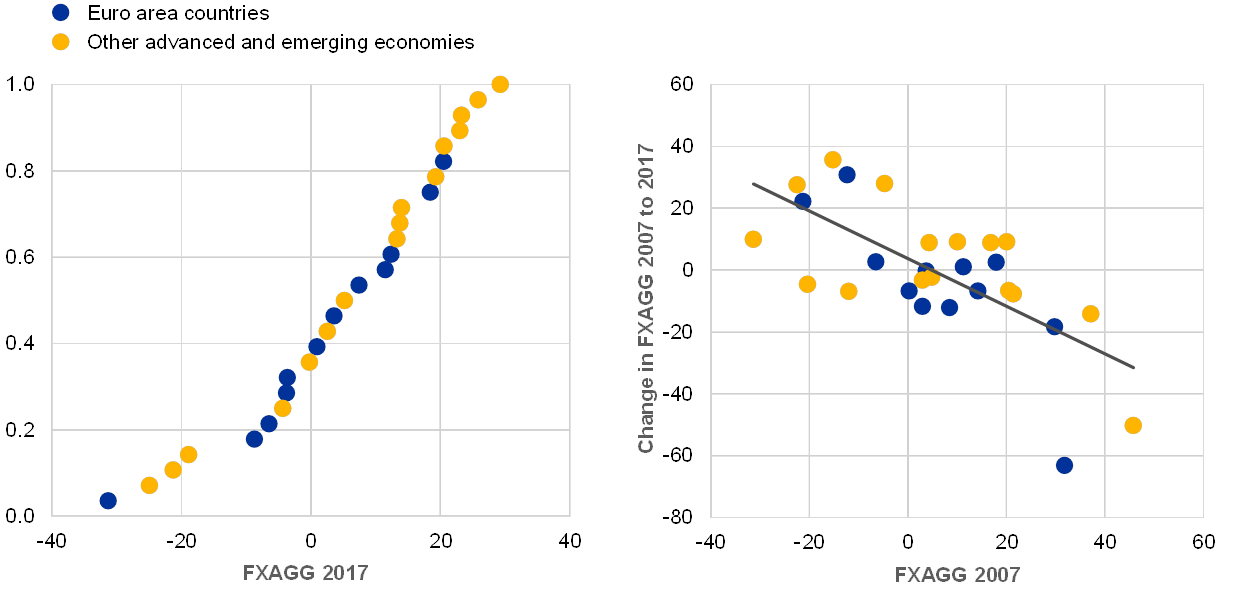
Source: Bénétrix and Schmitz (2019) based on BIS Locational banking statistics.
Notes: FXAGG for 2007 and 2017 based on a sample of 28 countries. Positive values for FXAGG indicate “long euro” positions (i.e. a country’s banking system has larger cross-border net assets in euro than in US dollars). The y-axis in the left panel chart shows the cumulative distribution of FXAGG across countries.
The dispersion in net euro-US dollar currency exposures has declined since the crisis. The right panel of Chart 29 focuses on the change in currency exposures of net positions between 2007 and 2017. It reports a negative relation between pre-crisis exposures and subsequent changes. At the same time the positions tended to be rather persistent with only a few countries switching from a net long euro to net short euro position (or vice versa). Hence, the negative relation shown in Chart 29 implies that long and short euro positions (relative to the US dollar) became smaller in absolute terms. This is in line with the fact that since the crisis banks resident in advanced economies outside Europe increased their US dollar funding, while European banks reduced their US dollar positions.[126] This would be consistent with the drive by European banks to reduce their reliance on short-term wholesale US dollar funding, in favour of more long-term oriented funding based on domestic deposits.[127]
Patterns similar to the euro-US dollar currency exposures are found for geographic net exposures towards the euro area. Analogously to the net currency exposure measure FXAGG, a geographic net exposure measure GXAGG is computed.[128] This metric captures banks’ net external assets vis-à-vis the euro area relative to those vis-à-vis the rest of the world.[129] The left panel of Chart 30 shows that the cumulative distribution of geographic exposures in 2017 had a similar shape as that of euro-US dollar currency exposures. In net terms, 60% of the countries in the sample are “long” towards the euro area, with 11 of these 17 countries being non-euro area countries.
Net exposures towards the euro and US dollar are correlated with the geography of net cross-border banking positions, but with heterogeneity across countries. The right panel of Chart 30 compares net currency exposures to the euro (relative to US dollars) with net geographical exposures to the euro area (relative to the rest of the world) in 2017. Generally, larger cross-border net asset positions vis-à-vis the euro area are associated with larger net asset positions being denominated in euro. For emerging market economies, both the geographic and currency exposures in net positions are “long euro area” and “long euro”, while “short positions” in both instances are recorded for other advanced economies such as Japan and Canada. In the case of financial centres such as the United Kingdom and Switzerland, this link is weaker, hinting at the special financial intermediation role of banks based in these countries. Chart 30 also shows significant cross-country dispersion within each quadrant, suggesting that a number of idiosyncratic factors beyond geography – such as business models or regulatory constraints – explain why banks may prefer to have a larger part of their balance sheet to be denominated in a certain currency.
Chart 30
Net exposures to the euro are correlated with exposures to the euro area
Net cross-border exposures to the euro area and euro-US dollar exposures
(left panel: GXAGG units and cumulative distribution; right panel: GXAGG and FXAGG)

Source: Bénétrix and Schmitz (2019) based on BIS Locational banking statistics.
Notes: FXAGG and GXAGG for 2017, based on a sample of 28 countries. Positive values for FXAGG indicate “long euro” positions (i.e. a country’s banking system has larger cross-border net assets in euro than in US dollars). Positive values for GXAGG indicate relatively long net asset positions vis-à-vis the euro area (compared with those vis-à-vis the rest of the world). The y-axis in the left panel chart shows the cumulative distribution of GXAGG across countries.
An even larger majority of national banking systems has larger net local assets denominated in euro than in US dollars. In the same vein as the FXAGG and GXAGG measures for cross-border positions, a measure of currency exposures is constructed for banks’ local positions (i.e. vis-à-vis counterparts resident in the same country).[130] The left panel of Chart 31 shows that almost all countries in the sample are long euro in their local net positions.
Net cross-border euro-US dollar exposures are partly the mirror image of banks’ local positions. The right panel of Chart 31 suggests that there is a negative relationship between the local and cross-border exposure measures. Hence, banking systems that are long euro in cross-border positions tend to be short euro domestically and vice versa. This relationship is more evident in the non-euro area country group, suggesting that cross-border currency exposures and local currency exposures might serve as hedges for each other.
Chart 31
Net cross-border euro-US dollar exposures are partly the mirror image of banks’ local positions
Net euro-US dollar currency exposures in cross-border and local banking positions
(left panel: LXAGG units and cumulative distribution; right panel: LXAGG and FXAGG)
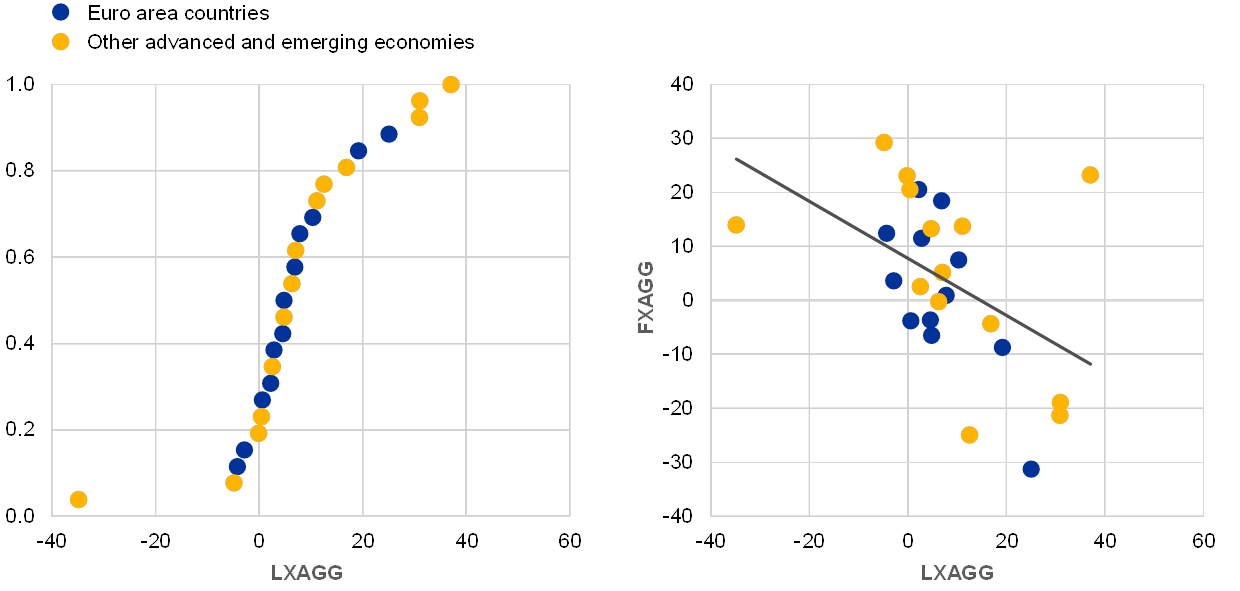
Source: Bénétrix and Schmitz (2019) based on BIS Locational banking statistics.
Notes: LXAGG for 2017, based on a sample of 26 countries (USA and CHL not included owing to lack of available data). Positive values for FXAGG (LXAGG) indicate “long euro” in the net cross-border (local) positions (i.e. a country’s banking system has larger cross-border (local) net assets in euro than in US dollars). The y-axis in the left panel chart shows the cumulative distribution of LXAGG across countries.
Conclusion
This special feature analyses the relative importance of the euro and US dollar in banks’ net external assets. Currency exposures and currency mismatches of banking systems are important for understanding the international transmission of shocks. This is particularly relevant for euro and US dollar exposures, as the bulk of international bank positions are denominated in these currencies. Banking systems with long euro net exposures would benefit from euro appreciations vis-à-vis the US dollar via positive balance sheet effects. These balance sheet effects can be sizeable and thus affect banks’ lending capacity.
This special feature has identified three main stylised facts: the majority of banking systems in the 28 countries studied have larger net assets in euro than in US dollars, partly reflecting the important role of the US dollar as an international funding currency. The greater these exposures, the larger the effects associated with exchange rate movements. Overall, the dispersion in net euro-US dollar exposures has declined since the global financial crisis, which suggests that exchange rate movements are associated with smaller valuation effects. Net cross-border exposures towards the euro and US dollar are shaped by the geography of cross-border banking positions towards the euro area and partly mirror banks’ currency exposures in local positions. The latter suggests that cross-border currency mismatches are partially hedged with local positions.
4 Statistical annex
See more.
© European Central Bank, 2019
Postal address 60640 Frankfurt am Main, Germany
Telephone +49 69 1344 0
Website www.ecb.europa.eu
All rights reserved. Reproduction for educational and non-commercial purposes is permitted provided that the source is acknowledged.
This report was produced under the responsibility of the Executive Board of the ECB.
The cut-off date for the statistics included in this report was 25 April 2019.
For specific terminology please refer to the ECB glossary (available in English only).
PDF ISBN 978-92-899-3861-7, ISSN 1725-6593, doi:10.2866/344590, QB-XN-19-001-EN-N
HTML ISBN 978-92-899-3860-0, ISSN 1725-6593, doi: 10.2866/229435, QB-XN-19-001-EN-Q
- At current exchange rates, however, the increase was more modest, at 0.5 percentage point, owing to the depreciation of the euro exchange rate against the US dollar in the review period.
- The currencies in question include the yen, the pound sterling and non-standard reserve currencies such as the Australian dollar, the Canadian dollar and the renminbi (see below for further discussions).
- Several of these economies manage their exchange rate vis-à-vis the US dollar, including China (which alone sold almost USD 90 billion worth of foreign exchange reserves), Hong Kong and India. Argentina and Turkey also lost significant amounts (i.e. a combined USD 30 billion) of foreign exchange reserves between the end of March and the end of September 2018.
- This puts Russia’s share of renminbi holdings at about ten times the average of central banks globally, while its total holdings of the currency account for about one-quarter of global foreign reserves denominated in renminbi.
- It has been suggested, however, that accumulation of US dollar reserves can also take place offshore through other financial centres (see, for example, “Russia Buys Quarter of World Yuan Reserves in Shift from Dollar”, Bloomberg, 9 January 2019).
- This said, nearly three-quarters of the respondents of a survey of 80 central bank reserve managers responsible for about USD 6.9 trillion in international reserves, which was carried out between February and March 2019, identified international trade tensions as the most or second most pressing issue for them in 2019 (see HSBC Reserve Management Trends 2019, Central Banking Publications, 29 April 2019). 80% of the survey respondents saw geopolitical forces as affecting the currency allocation of official foreign reserves. However, just over one-third were of the view that the forces in question would impact their own allocation directly. And almost all the respondents indicated that the US dollar was “still the safe haven currency”.
- An estimated two-thirds of the increase in renminbi-denominated reserves in the first half of 2018 is on account of Russia alone.
- The reported amounts are cumulated flows over 12 months, in line with the standard practice.
- See the speech by Benoît Coeuré entitled “The euro’s global role in a changing world: a monetary policy perspective”, speech at the Council on Foreign Relations, New York City, 15 February 2019; see also Bergant, K., Fidora, M. and Schmitz, M., “International capital flows at the security level – evidence from the ECB’s asset purchase programme”, ECMI Working Paper, No 7, October 2018.
- The Belt & Road Initiative is a Chinese-led project to expand trade links between Asia, Africa and Europe launched in 2013. In 2017 the Chinese government committed an additional USD 124 billion to the project.
- This falls under Bond Connect, a trading platform allowing foreign investors to invest directly in the Chinese interbank bond market.
- Excluding Argentina and Turkey (against which the euro appreciated by about 50% and 20% in bilateral terms respectively), the euro appreciated against the currencies of several emerging market economies, such as the Brazilian real (+2%) and the South African rand (+10%).
- Although not all foreign exchange transactions are settled in CLS, which partly reflects the fact that the foreign exchange market is largely decentralised, it has been estimated that over 50% of eligible global foreign exchange transactions are settled in CLS. This suggests that data on activity in CLS might be indicative of broader market trends.
- Since a transaction in the foreign exchange market always involve two currencies, shares add up to 200%.
- Bulgaria announced plans in July 2018 to join the Exchange Rate Mechanism II and banking union simultaneously.
- See McCauley, R. and Ito, H., “A key currency view of global imbalances”, BIS Working Paper, No 762, December 2018.
- These are the most relevant currencies in the international monetary system aside from the US dollar. The regression is estimated based on monthly data from January 1999 to December 2018. For Japan, the euro area, the United Kingdom and the United States, loadings are set to 1 on their respective currencies.
- It has been argued that one limitation of the standard Frankel-Wei methodology is that using one particular currency as numéraire and constraining the model coefficients to sum up to 1 hampers identification itself (see Bénassy-Quéré, A., Coeuré, B. and Mignon, V., “On the identification of de facto currency pegs”, Journal of the Japanese and International Economies, No 20, 2006, pp. 112‑127). We therefore use effective exchange rates rather than bilateral exchange rates on the right-hand side of the equation since the choice of a numéraire currency is always debatable. This makes the specification akin to a factor model, where broad measures of effective exchange rate allow shocks to be picked up by shocks that are conceivably more specific to each of the anchor currencies considered, unlike simple bilateral exchange rates.
- The discussion here is based on the “narrow” definition of international debt issuance, which focuses on the foreign currency principle. This definition therefore excludes all domestic currency issuance from the standard (also known as “broad”) definition of international debt issuance, which is based on the residence principle. For instance, the narrow definition excludes a euro-denominated bond issued by a German company whether outside the euro area (e.g. in the United States) or in the euro area (e.g. in France).
- These developments are also consistent with the risk-taking channel of monetary policy discussed, for example, in Bruno, V. and Shin, H. S., “Capital flows and the risk-taking channel of monetary policy”, Journal of Monetary Economics, Vol. 71(C), 2015, pp. 119‑132.
- The operation consists of borrowing euro and swapping the proceeds by means of a CCS contract to hedge against foreign exchange risk, with the basis being the premium over the price of direct US dollar borrowing in the wholesale money market.
- As noted in last year’s report, the Recommendation of the European Systemic Risk Board of 21 September 2011 on lending in foreign currencies may have also contributed to a reduction in cross-border euro-denominated loans.
- International loans are defined as loans by banks outside the currency area to borrowers outside the currency area. For instance, international loans in euro correspond to all euro-denominated loans by banks outside the euro area to borrowers outside the euro area.
- See Gräb, J. and Żochowski, D. “The international bank lending channel of unconventional monetary policy”, Working Paper Series, No 2109, ECB, Frankfurt am Main, November 2017.
- See Cetorelli, N. and Goldberg, L. S., “Banking Globalization and Monetary Transmission”, Journal of Finance, Vol. 67(5), 2012, pp. 1811‑1843. As global banks respond to domestic monetary shocks by managing liquidity globally through an internal reallocation of funds between headquarters and foreign branches or subsidiaries, their foreign lending is more affected by domestic shocks (see also Special Feature A).
- The definition of international deposits is equivalent to the definition of international loans. International deposits are defined as deposits with banks outside the currency area from creditors outside the currency area. For instance, international deposits in euro correspond to all euro-denominated deposits with banks outside the euro area from creditors outside the euro area.
- See, for instance, Bloomberg, “VTB Head Warns Clients May Not Get Dollars Back If Ban Hits”, 12 September 2018.
- This rough estimate refers to the share of the euro as an invoicing currency of global trade in goods excluding intra-euro area trade. Including intra-euro area trade transactions, the share of the euro is on par with the US dollar at around 40%. See Gopinath, G., "The International Price System", NBER Working Paper, No 21646, 2015.
- The dominant role of the US dollar is particularly noteworthy in global trade of oil and other commodity products (see Box 3 for further discussion).
- See Georgiadis, G. and Schumann, B. (2019), “Dominant-currency pricing and the global spillovers from US shocks”, mimeo.
- Commission Recommendation of 5 December 2018 on the international role of the euro in the field of energy. In the gas industry, the euro plays a more important role than in the oil market, as a large number of gas hubs use the euro.
- This was first discussed in McKinnon, Ronald, Money in International Exchange, Oxford University Press, 1979.
- Eichengreen, B., Chitu, L. and Mehl, A., “Network Effects, Homogeneous Goods and International Currency Choice: New Evidence on Oil Markets from an Older Era”, Canadian Journal of Economics, Vol. 49, No 1, 2016, pp. 173‑206. The study uses data for 1947, 1949 and 1950, and estimates for 1953.
- See Chung, W., “Imported Inputs and Invoicing Currency Choice: Theory and Evidence from UK Transaction Data”, Journal of International Economics, Vol. 99, 2016, pp. 237‑250.
- See Ito, T., Koibuchi, S., Sato, K. and Shimizu, J., “Choice of Invoice Currency in Japanese trade: Industry and commodity level analysis”, RIETI Discussion Paper, No 16‑E‑031, 2016; Ito, H. and Kawai, M., “Trade invoicing in major currencies in the 1970s‑1990s: Lessons for renminbi internationalization”, Journal of the Japanese and International Economies, Vol. 42, 2016, pp. 123‑145.
- See, for instance, Chen, N., Chung, W. and Novy, D., “Vehicle Currency Pricing and the Exchange Rate Pass-Through”, CEPR Discussion Paper, No DP13085, 2018.
- This is a variation of the standard pass-through regression proposed in Gopinath, G., Itskhoki, O. and Rigobon, R., “Currency Choice and Exchange Rate Pass-Through”, American Economic Review, American Economic Association, Vol. 100(1), 2010, pp. 304‑36. Data are annual and cover 144 countries over the period 1983‑2018 (we excluded the United States, OPEC and Russia from the sample as they are not typical oil importers affected by US dollar invoicing). The regression is estimated via random effects as suggested by the Hausman test. A test for serial correlation suggested that there was no autocorrelation in the residuals, hence no need to introduce lagged dependent variables in the model equation. Robustness checks have been performed introducing lags to the dependent variable. The results remained broadly unchanged.
- See Borio, C., “Strengthening the international role of the euro: European and international perspectives”, speech at the public hearing before the European Economic and Social Committee, Brussels, 4 April 2019.
- As noted in last year’s report, the earlier decline may have reflected several factors, including the discontinuation of production and issuance of €500 banknotes, which may have reduced demand for this denomination, although it remains legal tender. Data on official shipments, which put the stock of euro banknotes in circulation outside the euro area at about €167 billion, only capture observed cross-border flows of banknotes. An indirect estimation method, which attempted to quantify the unobserved cross-border flows of banknotes by combining information on domestic banknote circulation and coin circulation and by making assumptions on potential factors underlying those flows, suggested that the actual circulation of banknotes outside the euro area maybe higher still (see the ECB press release entitled “Estimation of euro currency in circulation outside the euro area” published on 6 April 2017).
- The OeNB Euro Survey collects information based on a nationally representative sample of individuals about their euro cash holdings, saving and borrowing decisions and looks into respondents’ economic opinions, expectations and experiences since autumn 2007. For details, see https://www.oenb.at/en/Monetary-Policy/Surveys/OeNB‑Euro-Survey.html.
- See Scheiber, T. and Stern, C., “Currency substitution in CESEE: why do households prefer euro payments?”, Focus on European Economic Integration, Oesterreichische Nationalbank, Issue 4, 2016, pp. 73‑98.
- See Stix, H., “Why do people save in cash? Distrust, memories of banking crises, weak institutions and dollarization”, Journal of Banking and Finance, Vol. 37(11), 2012, pp. 4087‑4106.
- The sharp increase of the CSI in North Macedonia is driven by the results of the 2018 survey wave, owing to an increase in the frequency of euro cash holdings of rather small amounts.
- A caveat is that surveyed euro cash amounts are likely to suffer from underreporting because some respondents might be reluctant to reveal true amounts; hence, the true level of currency substitution may be higher in all CESEE countries than suggested by the reported CSI.
- This shift in the public mood in Croatia was already visible in the 2017 survey wave.
- Both the probit and the OLS regressions check for socio-demographic and socio-economic characteristics, the receipt of income in euro or of remittances and include interacted country and time fixed effects; standard errors are adjusted for potential clustering at the regional level. The number of observations is 17,189 and 3,014 respectively. The marginal effects of a rather early expected euro adoption are of similar size as the significant socio-economic controls for high income, self-employment and wealth. The receipt of income in euro or of remittances have the strongest impact and increase the likelihood to hold euro cash by 18 percentage points and 10 percentage points respectively. Further details will be published in the OeNB’s forthcoming Focus on European Economic Integration Q3/19. This article will also cover Albania, Bosnia and Herzegovina, North Macedonia and Serbia.
- Box 8 provides an overview of the Communication entitled “Towards a stronger international role of the euro” issued by the European Commission on 5 December 2018.
- See speech by Willem Duisenberg entitled “The euro has arrived” to the American European Community Association on 14 January 1999 at De Nederlandsche Bank in Amsterdam and ECB, “The international role of the euro”, Monthly Bulletin, ECB, August 1999, pp. 31‑54.
- There is no consensus on the extent of the “exorbitant privilege”; see, for example, the discussion in Gourinchas, Pierre-Olivier and Rey, Helene, “From world banker to world venture capitalist: US external adjustment and the exorbitant privilege”, CEPREMAP Working Papers, 2005; Clarida, R. H. (ed.), G7 Current Account Imbalances: Sustainability and Adjustment, University of Chicago Press, 2007, pp. 11‑66; and Curcuru, S. E., Dvorak, T. and Warnock, F., “Cross-Border Returns Differentials”, The Quarterly Journal of Economics, Vol. 123(4), 2008, pp. 1495‑1530. See Special Feature B for evidence on other countries, including the euro area.
- See Rey, H., “Dilemma not trilemma: the global cycle and monetary policy independence”, Proceedings – Economic Policy Symposium – Jackson Hole, Federal Reserve Bank of Kansas City, 2013, pp. 1‑2) and Shin, H. S., “The bank/capital markets nexus goes global”, speech at the London School of Economics and Political Science, 15 November 2016.
- For a discussion of spillovers arising from US and euro area monetary policy shocks, see Ca’Zorzi, M., Dedola, L., Georgiadis, G., Jarociński, M., Stracca, L. and Strasser, G., “Monetary policy in a globalised world”, ECB Discussion Paper, forthcoming.
- See Bernanke, B., “The Global Saving Glut and the U.S. Current Account Deficit”, speech at the Homer Jones Lecture, St. Louis, Missouri, 14 April 2005. On the impact and transmission channel of foreign official purchases on US Treasury yields in the mid‑2000s, see also: Kaminska, I. and Zinna, G., “Official Demand for U.S. Debt; Implications for U.S. Real Interest Rates”, IMF Working Paper, No 14/66, 2014; and Krishnamurthy, A. and Vissing-Jorgensen, A., “The Aggregate Demand for Treasury Debt”, Journal of Political Economy, Vol. 120, No 2, 2012, pp. 233‑267.
- For further details, see Eichengreen, B., Mehl, A. and Chitu, L., How Global Currencies Work – Past, Present, and Future, Princeton University Press, 2017.
- By one recent estimate, global financial conditions account for about 20‑40% of the variation in countries’ local financial conditions; see Arregui, N., Elekdag, S., Gelos, G., Lafarguette, R. and Seneviratne, D., “Can Countries Manage Their Financial Conditions Amid Globalization?”, IMF Working Paper, No 18/15, 2018. There is no empirical evidence that financial markets in international currencies are significantly more volatile than those in other currencies.
- Evidence for the international transmission of ECB monetary policy is scarce. One of the few existing studies points to notable international spillovers of ECB monetary policy, suggesting that euro area banks increase lending to the rest of the world in response to monetary policy accommodation by the ECB (see Gräb, J. and Żochowski, D., “The international bank lending channel of unconventional monetary policy”, Working Paper Series, No 2109, ECB, Frankfurt am Main, November 2017). See below in this special feature on the role of invoicing and Special Feature C.
- See Bruno, V. and Shin, H. S., “Capital flows and the risk-taking channel of monetary policy”, Journal of Monetary Economics, Vol. 71(C), 2015, pp. 119‑132 for the argument that looser US monetary policy encourages global banks to leverage more in dollars (on the supply side) and incentivises emerging markets to borrow more in dollars (on the demand side).
- Cetorelli, N. and Goldberg, L. (2012), op. cit. suggests that, in contrast, domestic monetary policy transmission may be dampened.
- As regards bank lending specifically, an International Banking Research Network of 17 countries found that global spillovers are confined to US monetary policy, affect mainly interbank lending and, to a lesser extent, lending to non-banks (see Buch, C., Bussière, M., Goldberg, L. and Hills, R., “The International transmission of monetary policy,” Journal of International Money and Finance, Vol. 91, 2019, pp. 29‑48). However, this study did not focus on spillovers to other forms of capital flows.
- See, for example, Gourinchas, P.-O., Govillot, N. and Rey, H., “Exorbitant Privilege and Exorbitant Duty”, Working Paper, UC Berkeley, 2011 and Caballero, R. J., Farhi, E. and Gourinchas, P.-O. “Global Imbalances and Currency Wars at the ZLB”, NBER Working Paper, No 21670, 2015.
- Large wealth effects reflect the sharp increase in gross international investment positions, which have more than trebled over the past twenty years,
- For a review of the ECB’s experience with temporary swap lines between major central banks over recent years, see ECB, “Experience with foreign currency-liquidity providing central banks”, Monthly Bulletin, ECB, Frankfurt am Main, August 2014, pp. 65‑82. It has been argued that swap agreements among central banks may be a stabilising element increasing the resilience of the international monetary system (see, for instance, Bahaj, S. and Reis, R., “Central bank swap lines”, Discussion Paper, No 1816, Centre for Macroeconomics, 2018).
- See Gopinath, G., Itskhoki, O.and Rigobon, R., “Currency choice and exchange rate pass-through”, American Economic Review, Vol. 100(1), 2010, pp. 304‑336.
- For further details, see ECB, The international role of the euro, Frankfurt am Main, 2015.
- This is suggested, for example, by the analysis of Casas, C., Diez, F., Gopinath, G. and Gourinchas, P.-O., “Dominant currency paradigm: A new model for small open economies”, IMF Working Paper, No 17/264, 2017. See also Special Feature B for further discussion.
- This may in fact be one reason why the Federal Reserve System is traditionally believed to pay less attention to international developments than other central banks: the dominant role of the US dollar in international trade invoicing results in a low pass-through of forex shocks to the US economy. For more details on this traditional interpretation, see, for example, Eichengreen, B., “Does the Federal Reserve care about the rest of the world?”, Journal of Economic Perspectives, Vol. 27(4), 2013, pp. 87‑104.
- See Klein, M. and Shambaugh, J., Rounding the corners of the policy trilemma: Sources of monetary policy autonomy,” American Economic Journal: Macroeconomics, Vol. 7(4), 2015, pp. 33‑66, and references therein.
- See Georgiadis, G. and Zhu, F. “Monetary policy spillovers, capital controls and exchange rate flexibility, and the financial channel of exchange rates,” Working Paper Series, ECB, Frankfurt am Main, forthcoming.
- See Bruno, V. and Shin, H.-S., “Cross-border banking and global liquidity,” Review of Economic Studies, Vol. 82(2), 2015, pp. 535‑564.
- See Georgiadis, G. and Zhu, F. (2019), op. cit.
- In this regard, some considered that the swaps put in place during the global financial crisis were “the international dimension of non-standard monetary moves” (Papadia, F and Välimäki, T., Central banking in turbulent times, Oxford University Press, 2019) and that swap agreements among central banks were a potential stabilising element increasing the resilience of the international monetary system (Bahaj, S. and Reis, R. (2018), op. cit.).
- To the extent that global funding stresses spill over to domestic financial markets, impair the transmission of monetary policy or pose a material risk to domestic financial institutions, currency swap lines can be seen as a monetary policy tool to preserve financial stability. See the article entitled “Experience with foreign currency liquidity-providing central bank swaps”, Monthly Bulletin, ECB, Frankfurt am Main, August 2014.
- See Allen, B., International Liquidity and the Financial Crisis, Cambridge University Press, 2012 and Aizenman, J. and Pasricha, G. K., “Selective Swap Arrangements and the Global Financial Crisis: Analysis and Interpretation”, NBER Working Paper, No 14821, March 2009.
- See Bahaj, S. and Reis, R. (2018), op. cit.. However, it is not clear whether this correlation could also stem from other factors, such as negative interest rates in the euro area and Japan and the ring-fencing of US entities.
- See Gopinath, G and Stein, J., “Trade Invoicing, Bank Funding, and Central Bank Reserve Holdings”, AEA Papers and Proceedings, Vol. 108, May 2018 and Gopinath, G and Stein, J., “Banking, Trade, and the Making of a Dominant Currency”, NBER Working Paper, No 24485, April 2018. However, in this study it is not clear what the ultimate direction of the causality is, and central bank swap lines are not explicitly taken into account.
- See, for example, Eichengreen, Chiţu, B, L. and Mehl, A., "Stability or Upheaval? The Currency Composition of International Reserves in the Long Run", IMF Economic Review, Vol. 64(2), 2016, pp. 354‑380.
- In fact, the US Treasury had established swap lines with foreign monetary authorities on an ad hoc basis as early as 1936 to provide short-term bridge loans in anticipation of financing from other sources. For more details, see Bordo, M., Humpage, O. and Schwartz, A., “The Evolution of the Federal Reserve Swap Lines since 1962”, NBER Working Paper, No 20755, 2014.
- See ECB, “Experience with foreign currency liquidity-providing central bank swaps”, Monthly Bulletin, ECB, Frankfurt am Main, August 2014.
- See Eichengreen, B., “The Renminbi Goes Global”, Foreign Affairs, Vol. 96(2), 2017, pp. 157‑163.
- See the Communication entitled “Towards a stronger international role of the euro”.
- The Commission also issued a Recommendation on the international role of the euro in the field of energy.
- The term “exorbitant privilege” was originally coined in the 1960s (see the discussion below).
- By accumulating a portfolio of long-duration assets and extracting duration risk from private price-sensitive investors, foreign central banks (price-insensitive investors) free up risk bearing capacity and spur a rebalancing towards other assets, thereby lowering term premia.
- See Gourinchas, P.-O. and Rey, H., “External Adjustment, Global Imbalances, Valuation Effects”, in Gopinath, G, Helpman, E. and Rogoff, K. (eds.), Handbook of International Economics, Vol. 4, 2014, pp. 585‑645.
- See Habib, M., “Excess returns on net foreign assets – the “exorbitant privilege” from a global perspective”, Working Paper Series, No 1158, ECB, Frankfurt am Main, March 2010 for estimates of the “exorbitant privilege” based on returns on net foreign asset positions of the United States and other countries.
- See Bernanke, B. S., “The Global Savings Glut and the U.S. Current Account Deficit”, Homer Jones Lecture, 14 April 2005.
- See, for instance, Bernanke, B.S., Reinhart, V.R. and Sack, B.P., “Monetary Policy Alternatives at the Zero Bound: An Empirical Assessment”, Brookings Papers on Economic Activity, Vol. 35(2004‑2), 2004, pp. 1‑100; McCauley, R. and Jiang, G., “Treasury yields and foreign official holdings of US bonds”, BIS Quarterly Review, March 2004, pp. 11–12; Rudebusch, G.D., Swanson, E.T., and Wu, T., “The Bond Yield Conundrum’ from a Macro-Finance Perspective”, Federal Reserve Bank of San Francisco Working Paper, No 2006‑16, 2006; Warnock, F.E. and Warnock, V.C., “International Capital Flows and U.S. Interest Rates”, Journal of International Money and Finance, Vol. 28(6), 2009, pp. 903‑919; Bertaut, C., DeMarco, L.P., Kamin, S. and Tryon, R., “ABS inflows to the United States and the global financial crisis”, International Finance Discussion Papers, No 1028, Board of Governors of the Federal Reserve System, 2011; Beltran, D.O., Kretchmer, M., Marquez, J. and Thomas, C.P., “Foreign Holdings of U.S. Treasuries and U.S. Treasury Yields”, Journal of International Money and Finance, Vol. 32, 2013, pp. 1120‑1143.
- The transmission channels of asset purchase programmes are incompatible with the assumption of efficient financial markets. However, in the presence of market segmentation – either in the form of imperfect asset substitutability or preferred-habitat investors – the canonical arbitrage-free model of the term structure breaks down and asset purchases can have an impact on yields. See, for example, Vayanos, D. and Vila, J.. “A Preferred-Habitat Model of the Term Structure of Interest Rates”, NBER Working Papers, No 15487, 2009.
- See, for example, Krishnamurthy, A. and Vissing-Jorgensen, A., “The Aggregate Demand for Treasury Debt”, Journal of Political Economy, Vol. 120(2), 2012, pp. 233‑267; D’Amico, S. and King, B.K., “Flow and stock effects of large-scale treasury purchases: Evidence on the importance of local supply”, Journal of Financial Economics, Vol. 108(2), 2013, pp. 425‑448; Li, C. and Wei, M., “Term Structure Modelling with Supply Factors and the Federal Reserve's Large-Scale Asset Purchase Programs”, International Journal of Central Banking, Vol. 9(1), 2013, pp. 3‑39 or Greenwood, R. and Vayanos, D., “Bond Supply and Excess Bond Returns”, Review of Financial Studies, Vol. 27(3), 2014, pp. 663‑713.
- See Coeuré, B., “The euro’s global role in a changing world: a monetary policy perspective”, speech at the Council on Foreign Relations, New York City, 15 February 2019.
- In contrast, flow effects refer to how purchases temporarily alter market liquidity and functioning and to which signals markets perceive from the purchases (about the likely path of future monetary policies).
- Most studies quantifying the effects of reserve accumulation on yields do not take stock effects into account. An exception is Beltran et al. (2013), op. cit..
- This assumption is substantiated by IMF COFER survey data from before the launch of the euro when central banks held significant amounts of debt securities issued by just three euro area sovereigns: Germany, France and the Netherlands. In addition, the sovereign debt of Austria and Luxembourg have been AAA-rated for most of their rating history, in contrast to the debt of Finland which was rated AA for most of the 1990s. Other survey evidence suggests that reserve allocations to sovereign bonds issued by other euro area countries has been limited; see, for example, RBS, Reserve Management Trends, 2011. The sovereign debt of France and Austria has been downgraded by one notch after the outbreak of the euro area debt crisis. However, the debt of other sovereigns, including Japan, the United Kingdom and the United states, was downgraded in recent years although their reserve currency status was preserved.
- See Taylor, J. B., “Discretion versus Policy Rules in Practice’’, Carnegie-Rochester Conference Series on Public Policy. Vol. 39, 1993, pp. 195‑214; and Diebold, F. and Rudebusch, G., Yield Curve Modelling and Forecasting: The Dynamic Nelson-Siegel Approach, Princeton University Press, 2013.
- For this relationship to be similar across countries, a similar degree of market liquidity and investor price sensitivity for all currencies needs to be assumed. Moreover, the impact depends on the maturity structure of official holdings. Holdings of longer-dated assets have a larger impact on the term structure of risk-free yields, in line with the duration extraction channel of asset purchases.
- In theory, the level of inflation and growth should determine the future path of short-term interest rates rather than the term premium, see Diebold, F. X., Rudebusch, G. D. and Aruoba, S. B., “The Macroeconomy and the Yield Curve: A Dynamic Latent Factor Approach”, Journal of Econometrics, Vol. 131, 2006, pp. 309‑338.
- This error-correction specification is derived from the following pooled ARDL model:
- The simple model outlined in Equation (1) does not check for cross-country spillover effects, despite the close co-movements observed in international bond yields and the well-documented international spillovers of central banks’ asset purchase programmes. However, adding additional regressors to check for foreign and domestic purchases of other countries’ safe assets is not feasible due to multicollinearity. The estimated degree of the “exorbitant privilege” may therefore be seen as an upper limit.
- The estimates are similar if the sample is restricted to the period 1980‑2014 to take into account the fact that China started to disclose the currency composition of its foreign exchange reserves to the IMF.
- Fixed effect estimates are economically large and statistically significant for the United States, the euro area and the United Kingdom. For Japan, the deflation era and the persistent and large-scale asset purchases by the Bank of Japan, which made growth and inflation less volatile than in other major countries, may in part explain the persistently lower term premia.
- A simple Wald test rejects the null-hypotheses that the coefficients are statistically significantly different.
- The finding that the impact of foreign central bank holdings on term premia is equivalent to the impact of domestic central bank holdings is in line with the spirit of the duration extraction channel of asset purchases, as described Vayanos, D. and Vila, J. (2009), op. cit. and Li, C. and Wei, M., “Term Structure Modelling with Supply Factors and the Federal Reserve’s Large-Scale Asset Purchase Programs”, International Journal of Central Banking, March 2013. Decreasing bond supply lowers aggregate duration risk and hence term premia across maturities. In this simplistic framework, it does not matter who lowers the supply of safe debt, whether it is domestic or foreign price-insensitive investors. However, there are several reasons why the impact may differ in practice. Most importantly, foreign official purchases of highly rated debt are not likely to influence the inflation risk premium, and should thus have a somewhat lower effect, ceteris paribus. Yet, Beltran et al. (2013), op. cit. find evidence that Federal Reserve asset purchases have a smaller impact on US interest rates than foreign official purchases.
- Country-specific versions of Equation (1) are estimated.
- See Bauer, M., “A New Conundrum in the Bond Market?”, FRBSF Economic Letter, No 2017‑34, November 2017.
- In 2018, foreign central banks continued to accumulate US dollar reserves, despite significant sales of US Treasuries by a number of emerging market economies in summer 2018. Foreign official holdings of US debt also increased markedly in 2015 and 2016, when large-scale Chinese sales of Treasuries, amounting to around USD 1 trillion, were more than offset by other foreign official purchases.
- See Gopinath, G., “The international price system”, NBER Working Paper, No 21646, 2015.
- See Dieppe, A., Georgiadis, G., Ricci, M., Van Robays, I. and van Roye, B., “ECB‑Global: introducing ECB's global macroeconomic model for spillover analysis,” Working Paper Series, ECB, No 2045, April 2017. US dollar-denominated debt is not covered in this special feature.
- Strictly speaking, the pricing paradigm depends on the currency in which export prices are sticky, rather than on the currency in which exports are invoiced. Empirically, however, there is a close correspondence between the currency of invoicing and the currency in which prices are sticky; see, for example, Gopinath, G. and Rigobon, R., “Sticky borders”, Quarterly Journal of Economics, Vol. 2(123), 2008, pp. 531‑575; and Fitzgerald, D. and Haller, S., “Pricing-to-market: Evidence from plant-level prices”, Review of Economic Studies, Vol. 2(81), 2013, pp. 761‑786, who document that prices are rigid for significant durations in their currency of invoicing.
- See Casas, C., Diez, F., Gopinath, G., and Gourinchas, P.-O., “Dominant currency paradigm: A new model for small open economies”, IMF Working Paper, No 17/264, 2017.
- See Boz, E., Gopinath, G., Plagborg-Moller, M., “Global trade and the dollar”, IMF Working Paper, No 17/239, 2017.
- See Georgiadis, G. and Schumann, B., “Dominant-currency pricing and the global spillovers from US shocks”, Working Paper Series, ECB, 2019, forthcoming.
- For details see Dieppe, A., G. Georgiadis, M. Ricci, I. Van Robays and van Roye, B., “ECB‑Global: introducing ECB's global macroeconomic model for spillover analysis”, Working Paper Series, ECB, No 2045, 2017.
- For details see Georgiadis, G. and Mösle, S., “Introducing dominant-currency pricing in the ECB's global macroeconomic model”, Working Paper Series, ECB, Frankfurt am Main, 2019, forthcoming.
- This special feature is based on Bénétrix, A. and Schmitz, M.,, “Euro-dollar exposures in global banking: the role of geography”, Trinity College Dublin and ECB mimeo, April 2019.
- Data for the United States were retrieved from the Treasury International Capital (TIC) System of the US Treasury.
- See Milesi-Ferretti, G.-M. and Tille, C., “The great retrenchment: international capital flows during the global financial crisis”, Economic Policy, Vol. 26(66), April 2011, pp. 289‑346; McQuade, P. and Schmitz, M., “The great moderation in international capital flows: A global phenomenon?”, Journal of International Money and Finance, Vol. 73, 2017, pp. 188‑212; and McCauley R., Bénétrix, A., McGuire, P. M. and von Peter, G., “Financial deglobalisation in banking?” Journal of International Money and Finance, forthcoming.
- McGuire, P. and von Peter, G.,“The US dollar shortage in global banking and the international policy response”, BIS Working Papers, No 291, October 2009.
- See Georgiadis, G. and Mehl, A., "Financial Globalisation and Monetary Policy Effectiveness," Journal of International Economics, 2016, Vol. 103, 2016, pp. 200‑212.
- See Bénétrix, A., Lane, P. and Shambaugh, J., “International currency exposures, valuation effects and the global financial crisis”, Journal of International Economics, Vol. 96, January 2015, pp. 98‑109.
- See Avdjiev, S, Bruno, V., Koch, C. and Shin, H., “Exchange Rates and the transmission of global liquidity”, BIS, 2017, op. cit..
- See Avdjiev, S. and Takats, E., “Monetary policy spillovers and currency networks in cross-border bank lending”, BIS Working Papers, No 549, 2016.
- See Avdjiev, S., McCauley, R. and Shin, H. S., “Breaking free of the triple coincidence in international finance”, Economic Policy, Vol. 31(87), July 2016,, pp. 409‑51.
- One example of this is the fact that the cross-border component in global banks’ foreign currency positions, in particular the use of the US dollar, has gained in importance since the global financial crisis. See Aldasoro, I. and Ehlers, T., “The geography of dollar funding of non-US banks”, BIS Quarterly Review, December 2018
- This measure follows the framework of Lane. P. R. and Shambaugh, J., “Financial exchange rates and international currency exposures”, American Economic Review, Vol. 100(1), 2010, pp. 518‑540 and Bénétrix, A. S., Lane, P. R. and Shambaugh, J. C., “International currency exposures, valuation effects and the global financial crisis”, Journal of International Economics, Vol 96(S1), 2015.
- The BIS data do not cover off-balance sheet derivatives.
- By including the asset and liability weights, one takes into account if a banking system is an overall net creditor or net debtor (in terms of the combined euro and US dollar positions). For instance, a balanced euro-US dollar exposure in the gross position (i.e. 50% of assets and liabilities denominated in euro and US dollar) can be associated with a long euro position in net terms if total assets exceed total liabilities.
- See Aldasoro, I., Ehlers, T .and Eren, E., “Business models and dollar funding of global banks”, BIS Working Papers, No 708, 2018.
- Ivashina, V., Scharfstein, D. S. and Stein, J. C., “Dollar Funding and the Lending Behavior of Global Banks,” Quarterly Journal of Economics, Vol. 130, No 3, 2015, pp. 1241‑81.
- As banks’ cross-border asset and liability positions in US dollars tend to be vis-à-vis global rather US-based counterparts, we define the relative exposure vis-à-vis euro area and rest of the world counterparts.
- The geographic exposures for assets and liabilities is defined by , where are bank’s cross-border positions vis-à-vis the euro area. Similarly, denotes banking positions vis-à-vis non-euro area countries. As before, a second step is required to combine exposures for assets and liabilities into a net position measure. To this end, , is computed with the weights and defined equivalently to FXAGG.
- This is given by , where the local currency exposures to the euro for the gross positions are given by . are banks’ local positions denominated in euro and are local positions denominated in US dollars, while and are defined as and . and representing total local assets and liabilities respectively, denominated in euro and US dollar.
-
12 June 2019