
The ECB Survey of Professional Forecasters - Fourth quarter of 2022
Summary
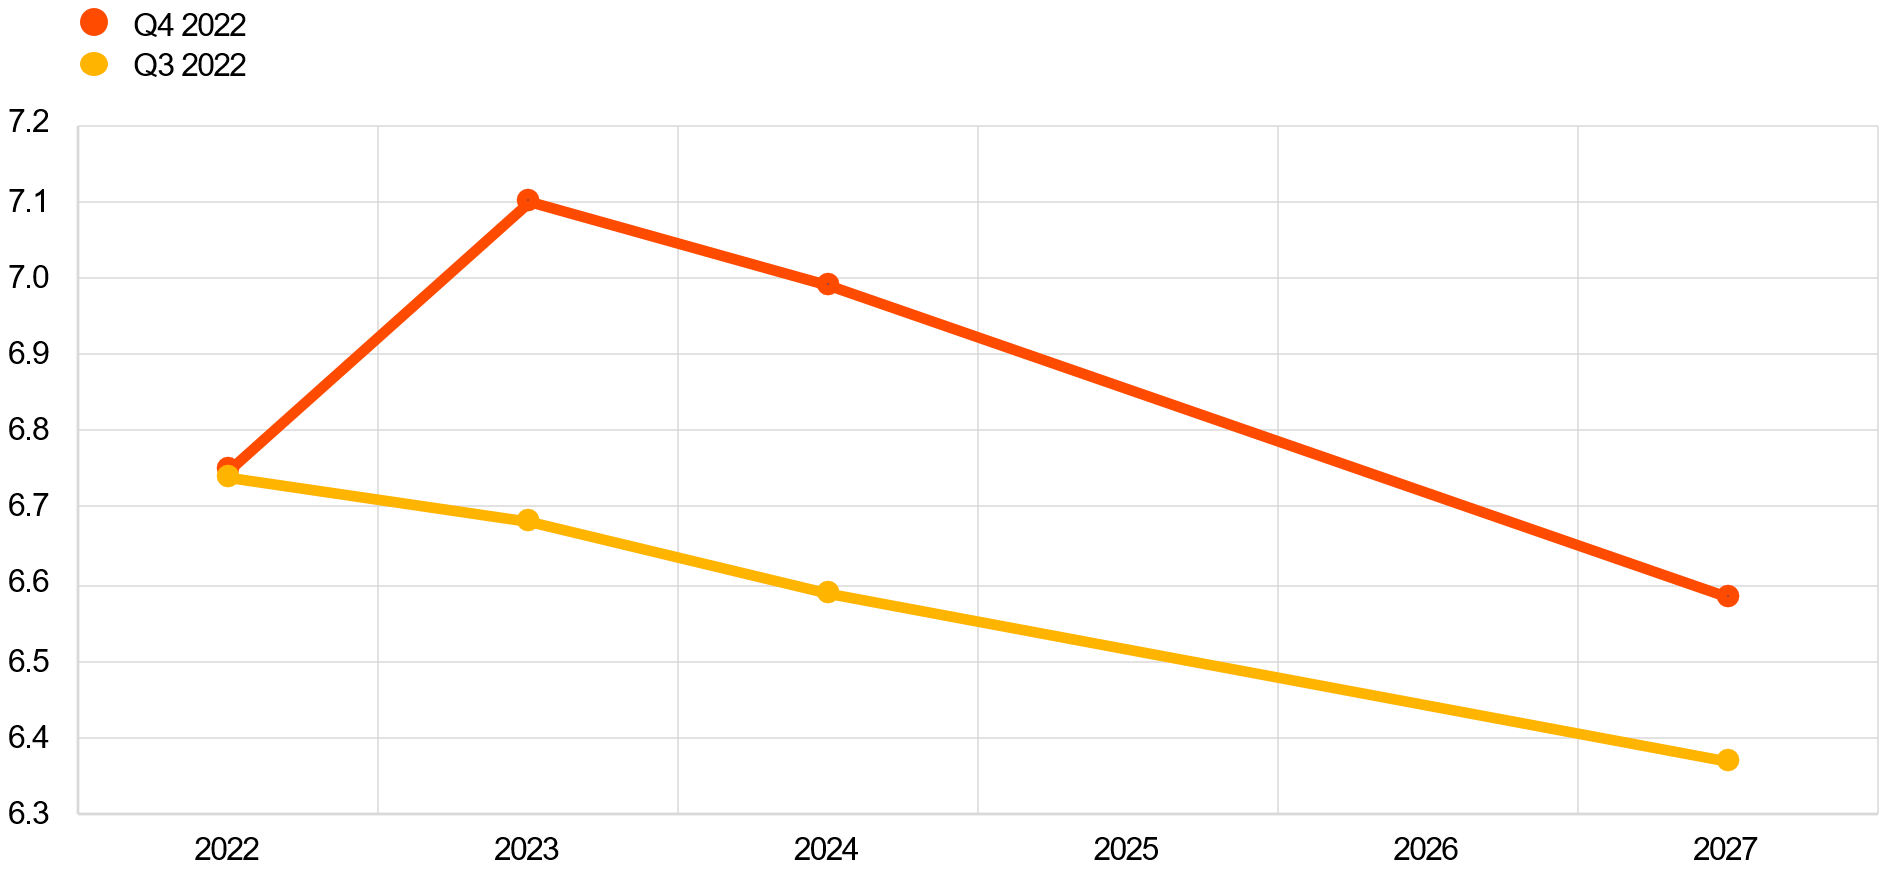
In the ECB Survey of Professional Forecasters (SPF) for the fourth quarter of 2022, HICP inflation expectations were revised up further for the 2022-2024 horizons, standing at 8.3%, 5.8% and 2.4% for 2022, 2023 and 2024 respectively.[1] According to respondents, the upward revisions primarily reflect a combination of higher (non-oil) energy and food prices as well as their pass-through into other prices. Longer-term inflation expectations (for 2027) were unchanged at 2.2%. Expectations for inflation excluding energy, food, alcohol and tobacco (HICPX) were also revised up for the period 2022-2024. According to respondents, these revisions mainly reflect ongoing stronger and broader indirect effects as well as higher forecast wage growth. GDP growth expectations were revised down substantially for 2023. Respondents now expect a broad stagnation of economic activity in 2023 (0.1% growth), and three quarters of negative growth between the third quarter of 2022 and the first quarter of 2023, with a cumulative decline of 0.7%. Longer-term growth expectations were revised down marginally to 1.4%. The profile of the expected unemployment rate was revised up for all horizons by between 0.1-0.4 percentage points. The expected profile for the future unemployment rate is hump-shaped, increasing to 7.1% in 2023 and gradually declining thereafter to 6.6% by 2027.
Table 1
Results of the SPF in comparison with other expectations and projections
(annual percentage changes, unless otherwise indicated)
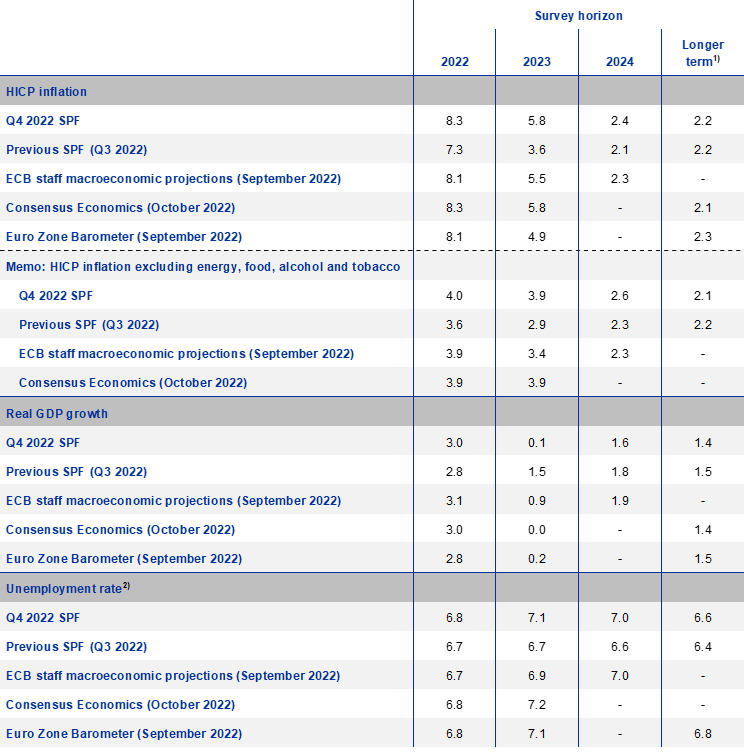
1) Longer-term expectations refer to 2027, except for the Euro Zone Barometer, which refers to 2026. Longer-term expectations from the Euro Zone Barometer are from the July 2022 survey.
2) As a percentage of the labour force.
1 HICP inflation expectations revised up further for 2022, 2023 and 2024
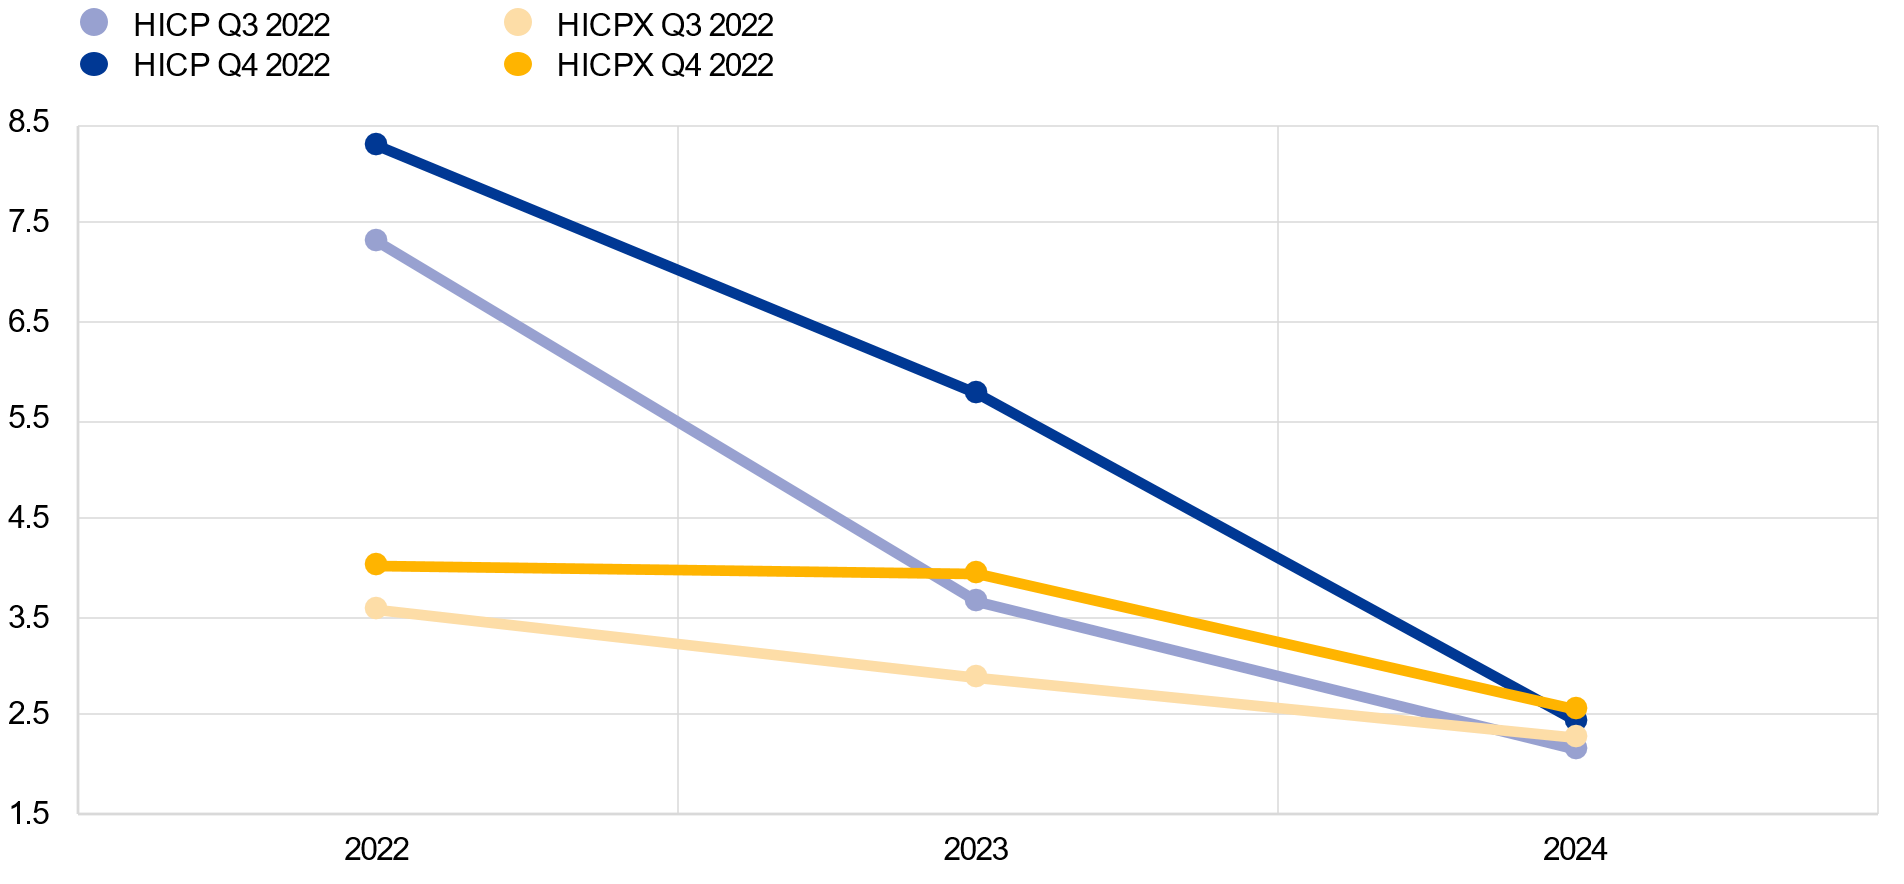
SPF respondents revised up further their inflation expectations for 2022, 2023 and 2024. These stand at 8.3%, 5.8% and 2.4% respectively; 1.0, 2.2 and 0.3 percentage points higher compared with the previous survey round (see Chart 1). Compared with the September 2022 ECB staff macroeconomic projections, inflation expectations in this SPF round were higher by 0.2 percentage points for 2022, by 0.3 percentage points for 2023 and by 0.1 percentage point for 2024 (see Table 1).
Chart 1
Inflation expectations: overall HICP inflation and HICP inflation excluding energy, food, alcohol and tobacco
(annual percentage changes)
Respondents considered current inflation to be largely driven by supply-side factors, with energy and food prices cited as the main factors behind upward revisions to the 2022 and 2023 inflation forecasts. In addition to their direct impact on consumer prices, respondents also noted that indirect effects working through the pricing chain, together with higher expected wage growth as well as the weaker euro (against the dollar) were the factors behind the higher forecasts for HICP inflation excluding food and energy. While respondents reported that these factors were stronger than previously expected, they thought that underlying demand pressures on inflation would be more moderate, reflecting lower expected economic activity.
For the shorter- and medium-term horizons, uncertainty surrounding the inflation outlook increased again to record levels.[2] Quantitative indicators of uncertainty for inflation derived from the reported probability distributions increased further from the already historically high levels in the previous round. The high level of “aggregate uncertainty” is owing to unprecedented “disagreement” among forecasters about their point forecasts combined with a high average level of “individual uncertainty”. Disagreement about two-year-ahead inflation expectations (measured by the standard deviation of point expectations) stood at 1.25 percentage points, which is five times the historical average since 1999. The aggregate probability distributions for the calendar years from 2022 to 2024 are presented in Chart 2. The quantitative balance of risk indicator (calculated as the estimated mean of the aggregate probability distribution minus the average reported point expectation) for the two-year-ahead horizon eased back. However, this movement must be interpreted with caution as the weight associated with outcomes in the open-ended interval (i.e. inflation being 5% or higher) increased to 6.8% from 1.4% in the previous round.[3] In their qualitative remarks, respondents noted that the main risks related to energy prices and their pass-through, the conflict in Ukraine and possible wage developments. For energy prices, downside as well as upside risks were mentioned, but the latter predominated. Wage developments were generally considered an upward risk. Some respondents spoke of weaker economic activity as a possible downside risk factor.
SPF expectations for inflation excluding energy, food, alcohol and tobacco (HICPX) were also revised up for the 2022-2024 horizons. HICPX expectations stood at 4.0%, 3.9% and 2.6% for 2022, 2023 and 2024 respectively, representing upward revisions of 0.4 percentage points for 2022, 1.0 percentage point for 2023 and 0.3 percentage points for 2024. Similar to the previous round, respondents again indicated that the upward revisions reflect a more intense and broader pass-through from higher energy and food prices. They also considered that higher wage increases would play a role. The SPF forecasts for HICPX were higher than those from the September 2022 ECB staff macroeconomic projections for 2022, 2023 and 2024 by 0.1, 0.5 and 0.3 percentage points respectively (see Table 1).
Chart 2
Aggregate probability distributions for expected inflation in 2022, 2023 and 2024
(x-axis: HICP inflation expectations, annual percentage changes; y-axis: probability, percentages)
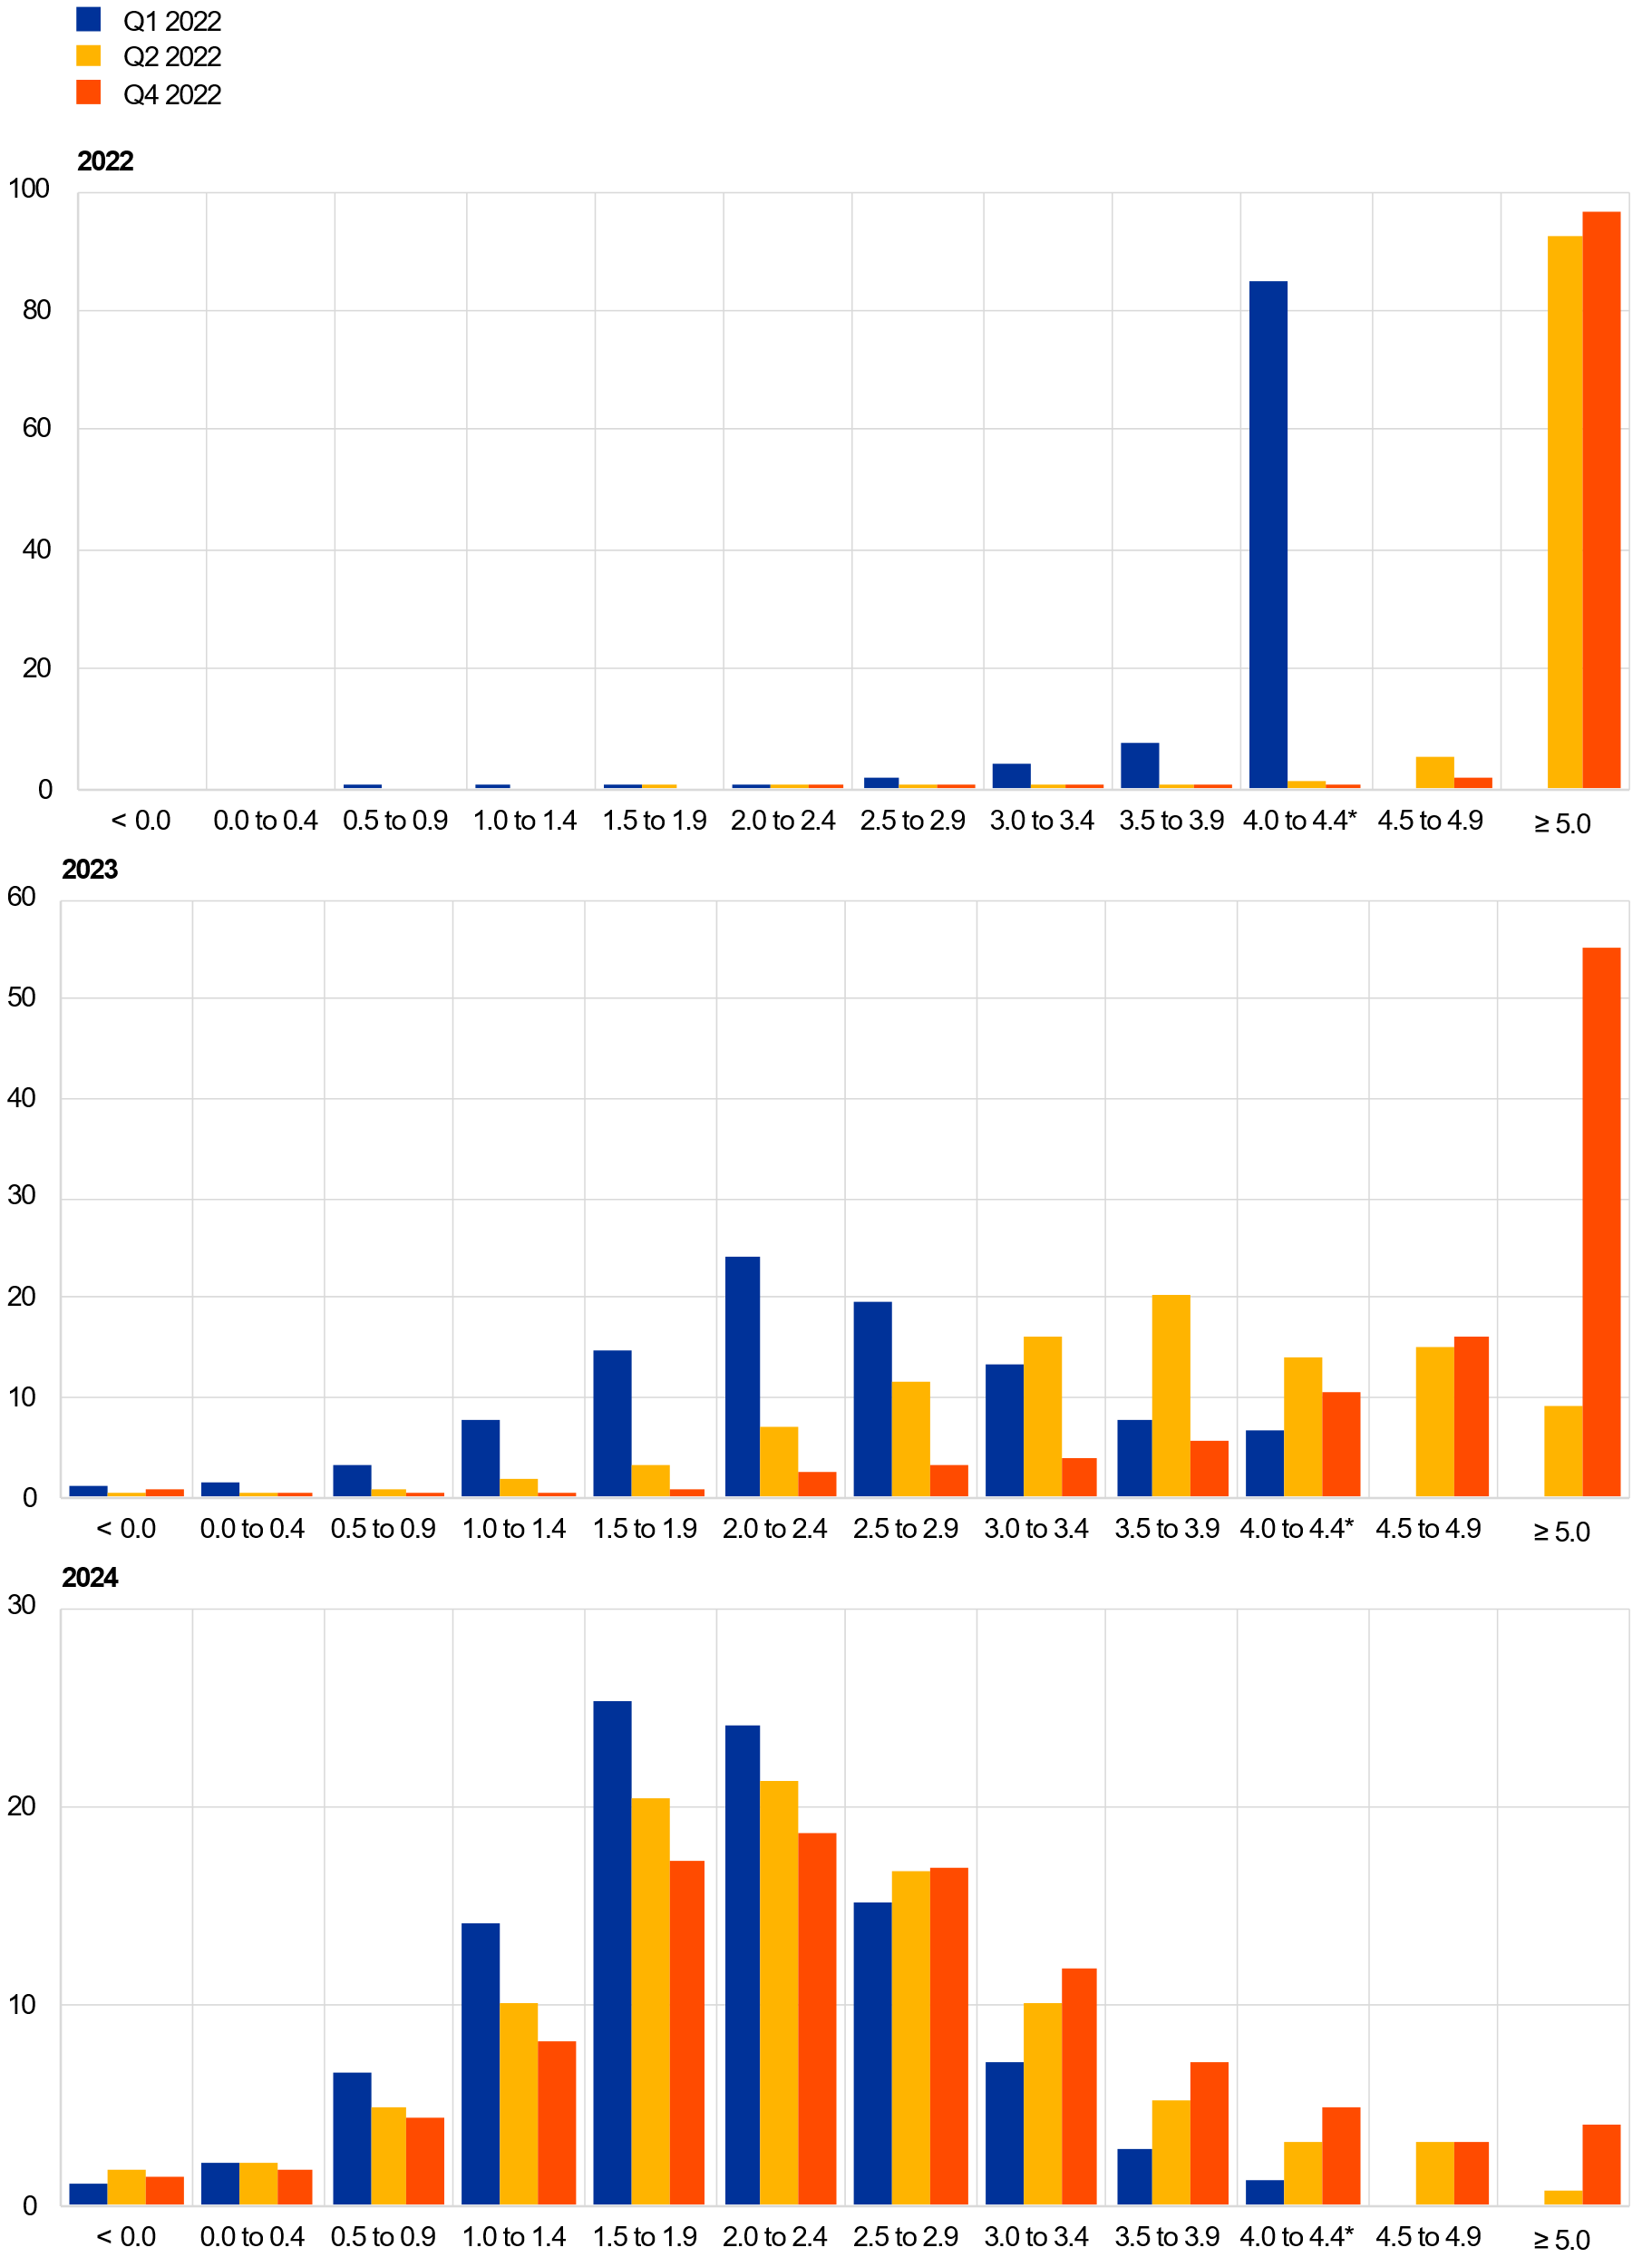
Notes: The SPF asks respondents to report their point forecasts and to separately assign probabilities to different ranges of outcomes. This Chart shows the average probabilities they assigned to different ranges of inflation outcomes in 2022, 2023 and 2024. To minimise the number of bins in the questionnaire, the upper bin for inflation outcomes was set to ≥ 5.0%. The fact that this would lead to most probability being assigned to the upper bin for some horizons was flagged to respondents when sending out the questionnaire. *The highest bin used in the second quarter of 2022 rounds was ≥4.0%.
2 Longer-term inflation expectations remained unchanged
Longer-term inflation expectations (for 2027) were unchanged at 2.2%. With a trimmed mean, where the highest response and the two lowest responses are removed, in both the current and previous rounds, the average would be unchanged at 2.1%. The median (and modal) point expectation was unchanged at 2.0%. The estimated mean of the aggregate probability distribution was unchanged at 2.2% (see Chart 3). In the most recent round (fourth quarter of 2022), considering a balanced panel of 38 respondents who also replied in the previous round, nine respondents revised their longer-term inflation expectations downwards and nine revised their expectations upwards, while 20 respondents reported unchanged longer-term inflation expectations. The average expectation of this balanced panel was also unchanged at 2.2%. The distribution of individual point forecasts was broadly unchanged in this round (see Chart 4). Similar to the previous two rounds, there was again a number of respondents who reported longer-term inflation expectations at or above 2.5% (7, or 16%, in the fourth quarter of 2022 round compared with 8, or 17%, in the third quarter of 2022 round).
Chart 3
Longer-term inflation expectations
(annual percentage changes)
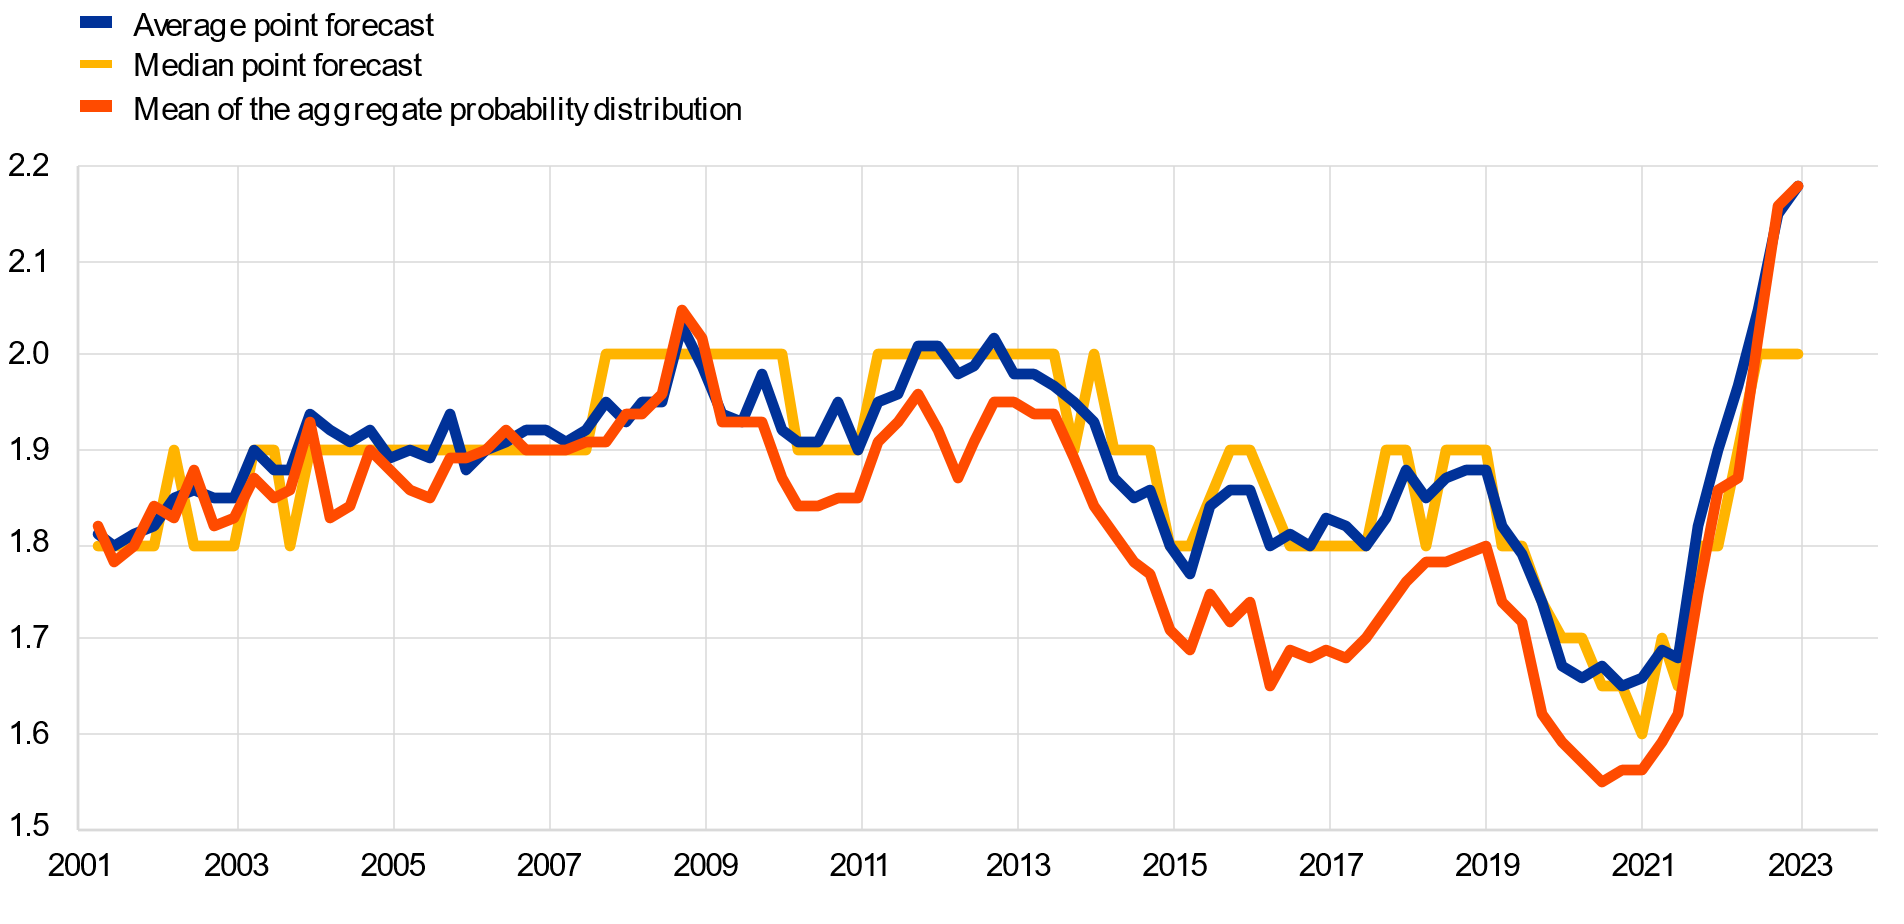
Chart 4
Distribution of point expectations for HICP inflation in the longer term
(x-axis: longer-term HICP inflation expectations, annual percentage changes; y-axis: percentages of respondents)

Notes: The SPF asks respondents to report their point forecasts and to separately assign probabilities to different ranges of outcomes. This Chart shows the spread of point forecast responses. Longer-term expectations refer to 2027 in the third and fourth quarter of 2022 rounds and to 2026 in the second quarter of 2022 round.
Uncertainty surrounding longer-term inflation expectations again increased sharply, and the balance of risks remained broadly balanced. The increase in “aggregate uncertainty” – the standard deviation of the aggregate probability distribution (see Chart 5) – was primarily owing to increased “individual uncertainty”, as measured by the average width of the individual probability distributions, while “disagreement” edged back slightly from the historically high level in the previous round. The balance of risk indicator remained close to zero (i.e. balanced). The probability associated with longer-term inflation being in the 1.5-2.5% range remained broadly unchanged at 46%, with a 33% probability above this range (i.e. >2.5%) and a 20% probability below this range (i.e. <1.5%).
Chart 5
Aggregate probability distribution for longer-term inflation expectations
(x-axis: HICP inflation expectations, annual percentage changes; y-axis: probability, percentages)

Notes: The SPF asks respondents to report their point forecasts and to separately assign probabilities to different ranges of outcomes. This Chart shows the average probabilities they assigned to different ranges of inflation outcomes in the longer term. *The highest bin used in the first quarter of 2022 and the second quarter of 2022 rounds was ≥4.0. Longer-term expectations refer to 2027 in the third quarter of 2022 round and to 2026 in the previous rounds shown.
The longer-term expectations for HICP inflation excluding energy, food, alcohol and tobacco (HICPX) decreased to 2.1% from 2.2% in the previous round. Respondents mentioned lower demand and economic activity as factors influencing their inflation expectations. Thus, the substantial downward revision to the expected profile of economic activity (see Chart 8) may be behind the downward revision to longer-term HICPX. The median longer-term point expectation for HICPX also decreased to 1.9% from 2.0%, while the modal (most frequent) response remained 2.0%. While 30% of participants reported 2.0%, 50% reported 1.9% or lower and 20% reported 2.1% or higher. Of the 27 respondents who provided longer-term HICPX expectations in both the fourth quarter of 2022 and third quarter of 2022 rounds, eight revised them down, 15 were unchanged and four revised them up. While the evolution of longer-term expectations for HICP and HICPX inflation had been broadly similar for the period of available data since the fourth quarter of 2016 up to the second quarter of 2022 (with a level difference of around 0.1 percentage point on average), the evolution in the most recent two rounds has been somewhat different (with the sharp increase in HICPX in the third quarter of 2022 being reverted this round).
3 Real GDP growth expectations revised down
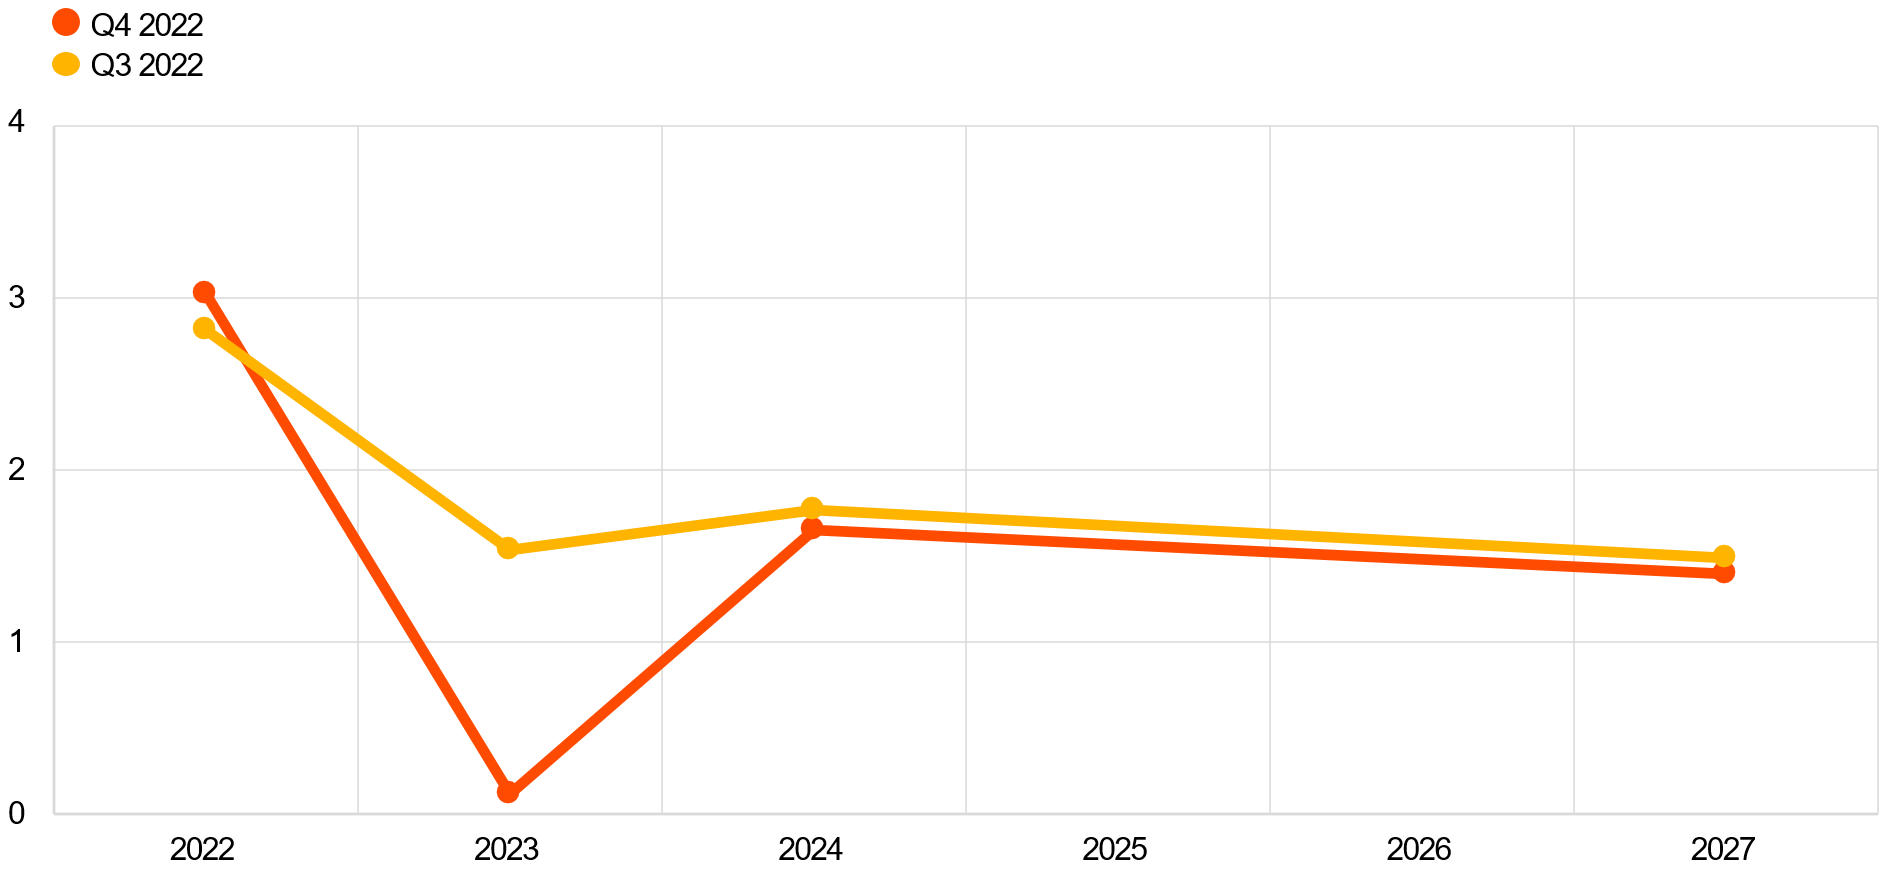
GDP growth expectations in the fourth quarter of 2022 survey round stood at 3.0% for 2022, 0.1% for 2023 and 1.6% for 2024 (see Chart 6). Compared with the previous round, these imply an upward revision of 0.2 percentage points for 2022, but downward revisions of 1.4 percentage points for 2023 and 0.2 percentage points for 2024. The upward revision to the 2022 annual growth rate expectation reflected the stronger than expected outcomes in the first two quarters of 2022, the impact of which outweighed the downward revisions for the third and fourth quarters of 2022. Respondents expected economic activity to contract in the second half of 2022 and in early 2023. This was attributed to ongoing high energy price pressures, inflation harming households’ purchasing power, a weaker global economy and a more restrictive monetary policy. High uncertainty regarding possible energy supply shortages was considered to have a strong negative impact on the outlook. Nonetheless, some respondents noted that fiscal responses are building up and may partly mitigate the loss in purchasing power. They also expected that the weaker euro would stimulate exports, partly offsetting the weaker global demand. Risks were viewed as largely negative and dominated by the danger of energy shortages and the possibility of rationing policies. A harsher winter may add to these. Whether or not Europe can find alternative suppliers and reduce consumption was seen as crucial. In addition, respondents remarked that a fast monetary policy tightening could worsen financial conditions and global demand, notably through a potential US recession. Coronavirus (COVID-19) pandemic risks and supply chain disruptions, although still present, were less prominent in respondents’ qualitative comments. New virus waves were still reported as a threat to the service sector, but also to global supply chains via China, where policy space was considered to be limited and to not allow for a strong reaction. Downward risks related to the war in Ukraine were seen to remain. Longer-term growth expectations (which refer to 2027) were marginally lower at 1.4%, down by 0.1 percentage point.
Chart 6
Expectations for real GDP growth
(annual percentage changes)
Respondents were again asked to provide the profile of their short-term GDP outlook (from the third quarter of 2022 until the second quarter of 2023).[4] Actual quarter-on-quarter real GDP growth for the second quarter of 2022 was 0.8%, substantially more than the forecast of 0.2% in the previous SPF. In this round, forecasters expected quarter-on-quarter growth to fall into negative territory, at around -0.1% on average between the third quarter of 2022 and the second quarter of 2023 (ranging from -0.4% to 0.2%). This is about 0.5 percentage points lower per quarter from the third quarter of 2022 to the first quarter of 2023 than forecast in the previous round (see Chart 7). Almost all forecasters who provided a forecast quarterly growth profile expected at least one quarter of negative growth between the third quarter of 2022 and the second quarter of 2023 (mostly for the fourth quarter of 2022 and for the first quarter of 2023), and 86% of these respondents forecast a so-called “technical recession” – two consecutive quarters of negative growth – over the period. Compared with the September 2022 macroeconomic projection exercise, SPF expectations were more pessimistic for all four quarters (by about 0.3 percentage points per quarter on average).
Chart 7
Expected profile of quarter-on-quarter GDP growth
(quarter-on-quarter percentage changes)
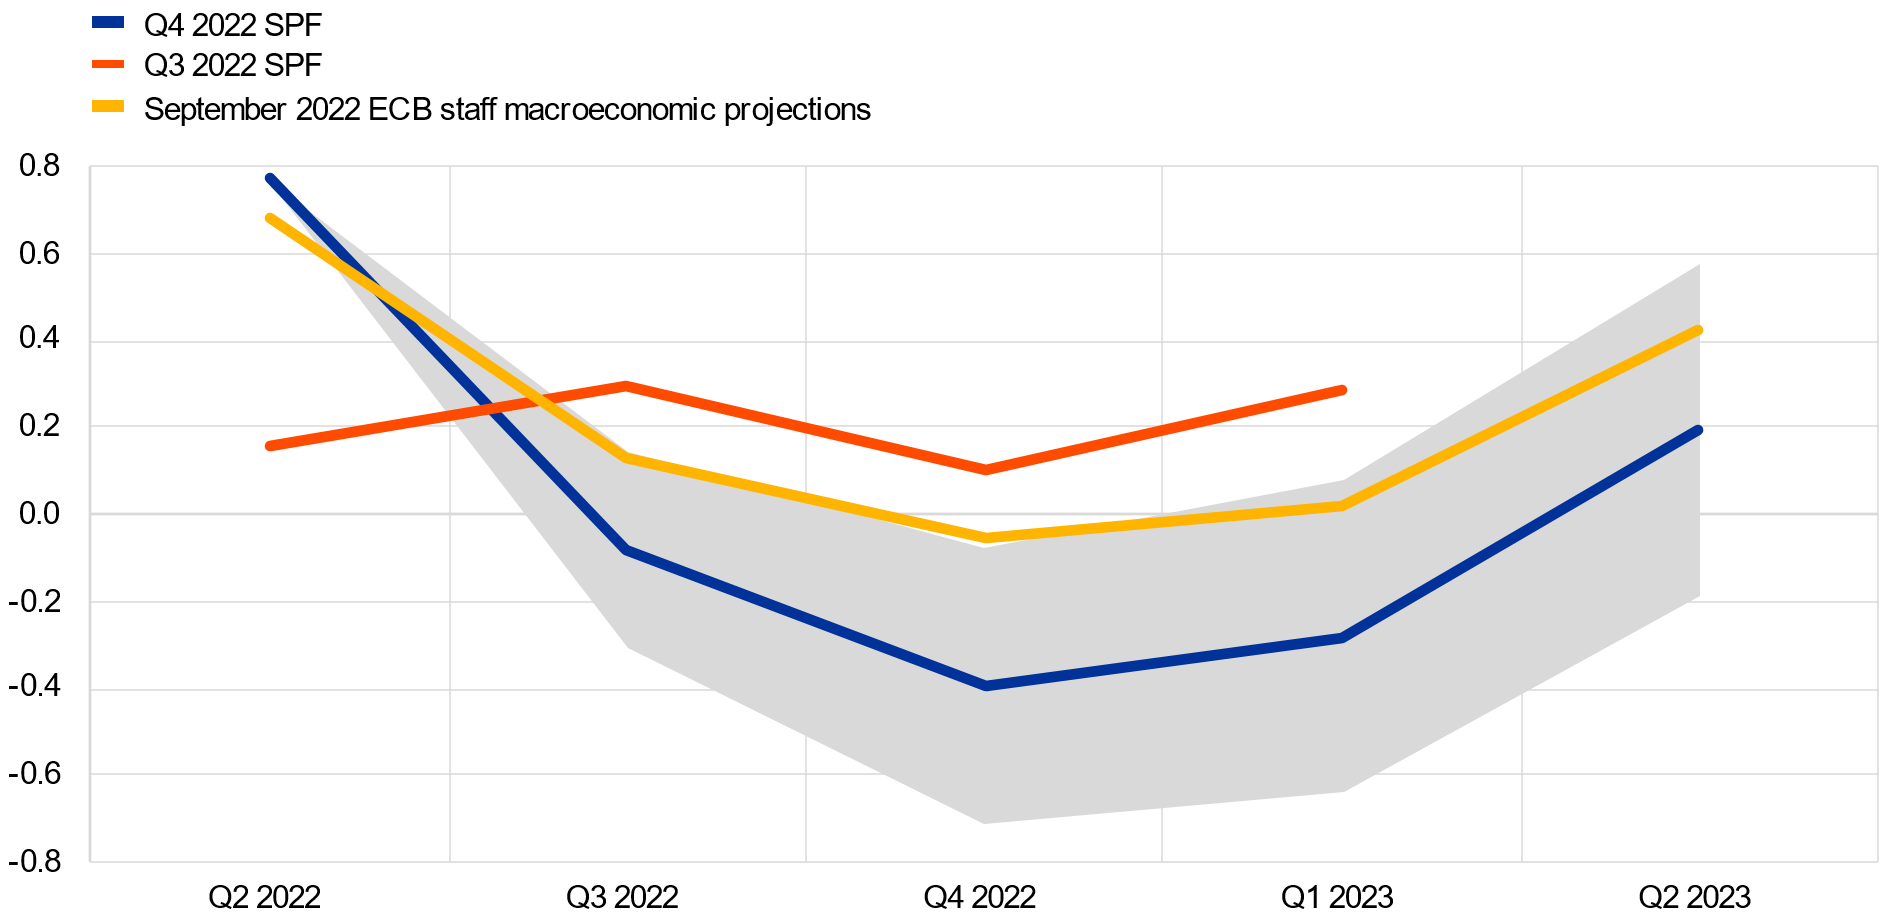
Notes: Grey area indicates one standard deviation (of individual expectations) around average SPF expectation.
Although real GDP returned to above its pre-pandemic level in the fourth quarter of 2021, the strong downward revision to expected growth in 2023 have again delayed its expected return to the pre-pandemic profile (see Chart 8). Compared with the profile expected in the first quarter of 2022 round (conducted in early January, before Russia’s invasion of Ukraine) where it was expected to overtake the pre-pandemic trend during the course of 2023, the level profile of GDP has been revised down (by about 4% in 2026). Expected GDP levels are also lower than forecast in the September macroeconomic projection exercise (by about 1% in 2024).
Chart 8
Forecast profile of real GDP level
(2019 = 100)
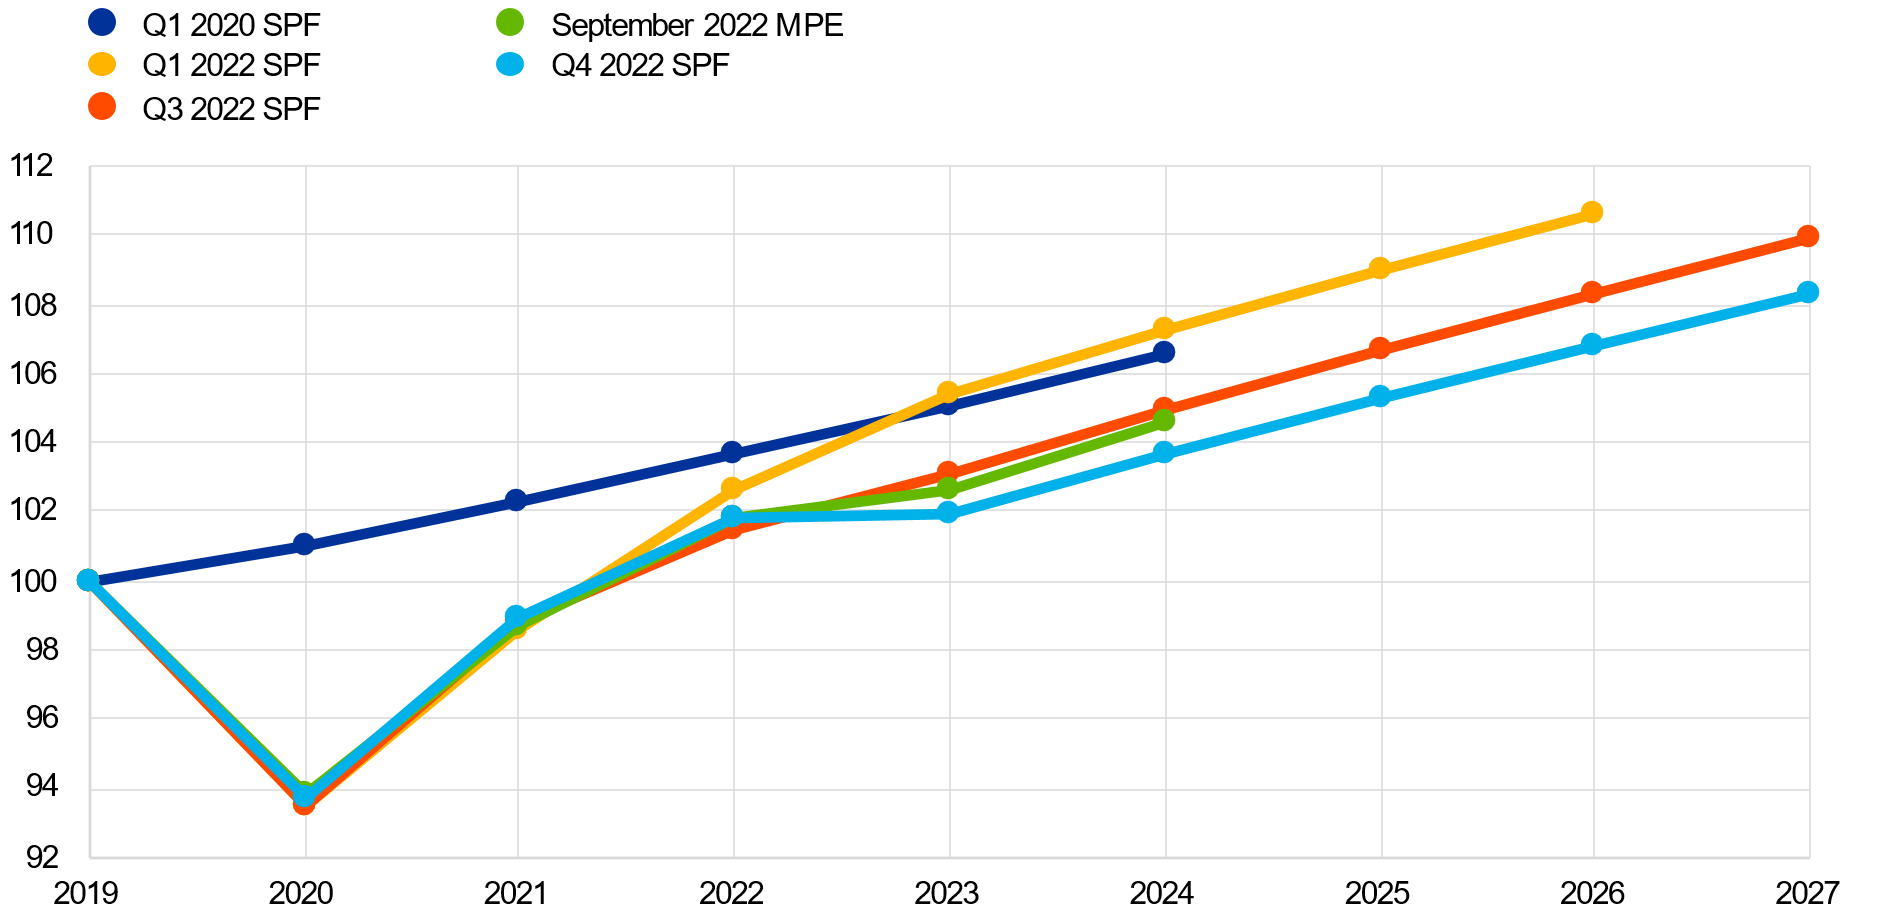
Note: Growth expectations for years not surveyed have been interpolated linearly.
Quantitative measures of uncertainty moderated this round and the two-year-ahead balance of risks remained strongly negative (see Chart 9 and Chart 10). Aggregate uncertainty decreased both at the two-year-ahead and longer-term horizons, although remaining above levels which prevailed prior to the COVID-19 pandemic. The balance of risks improved for the two-year-ahead horizon, but it remained strongly on the downside.
Chart 9
Aggregate probability distributions for GDP growth expectations for 2022, 2023 and 2024
(x-axis: real GDP growth expectations, annual percentage changes; y-axis: probability, percentages)
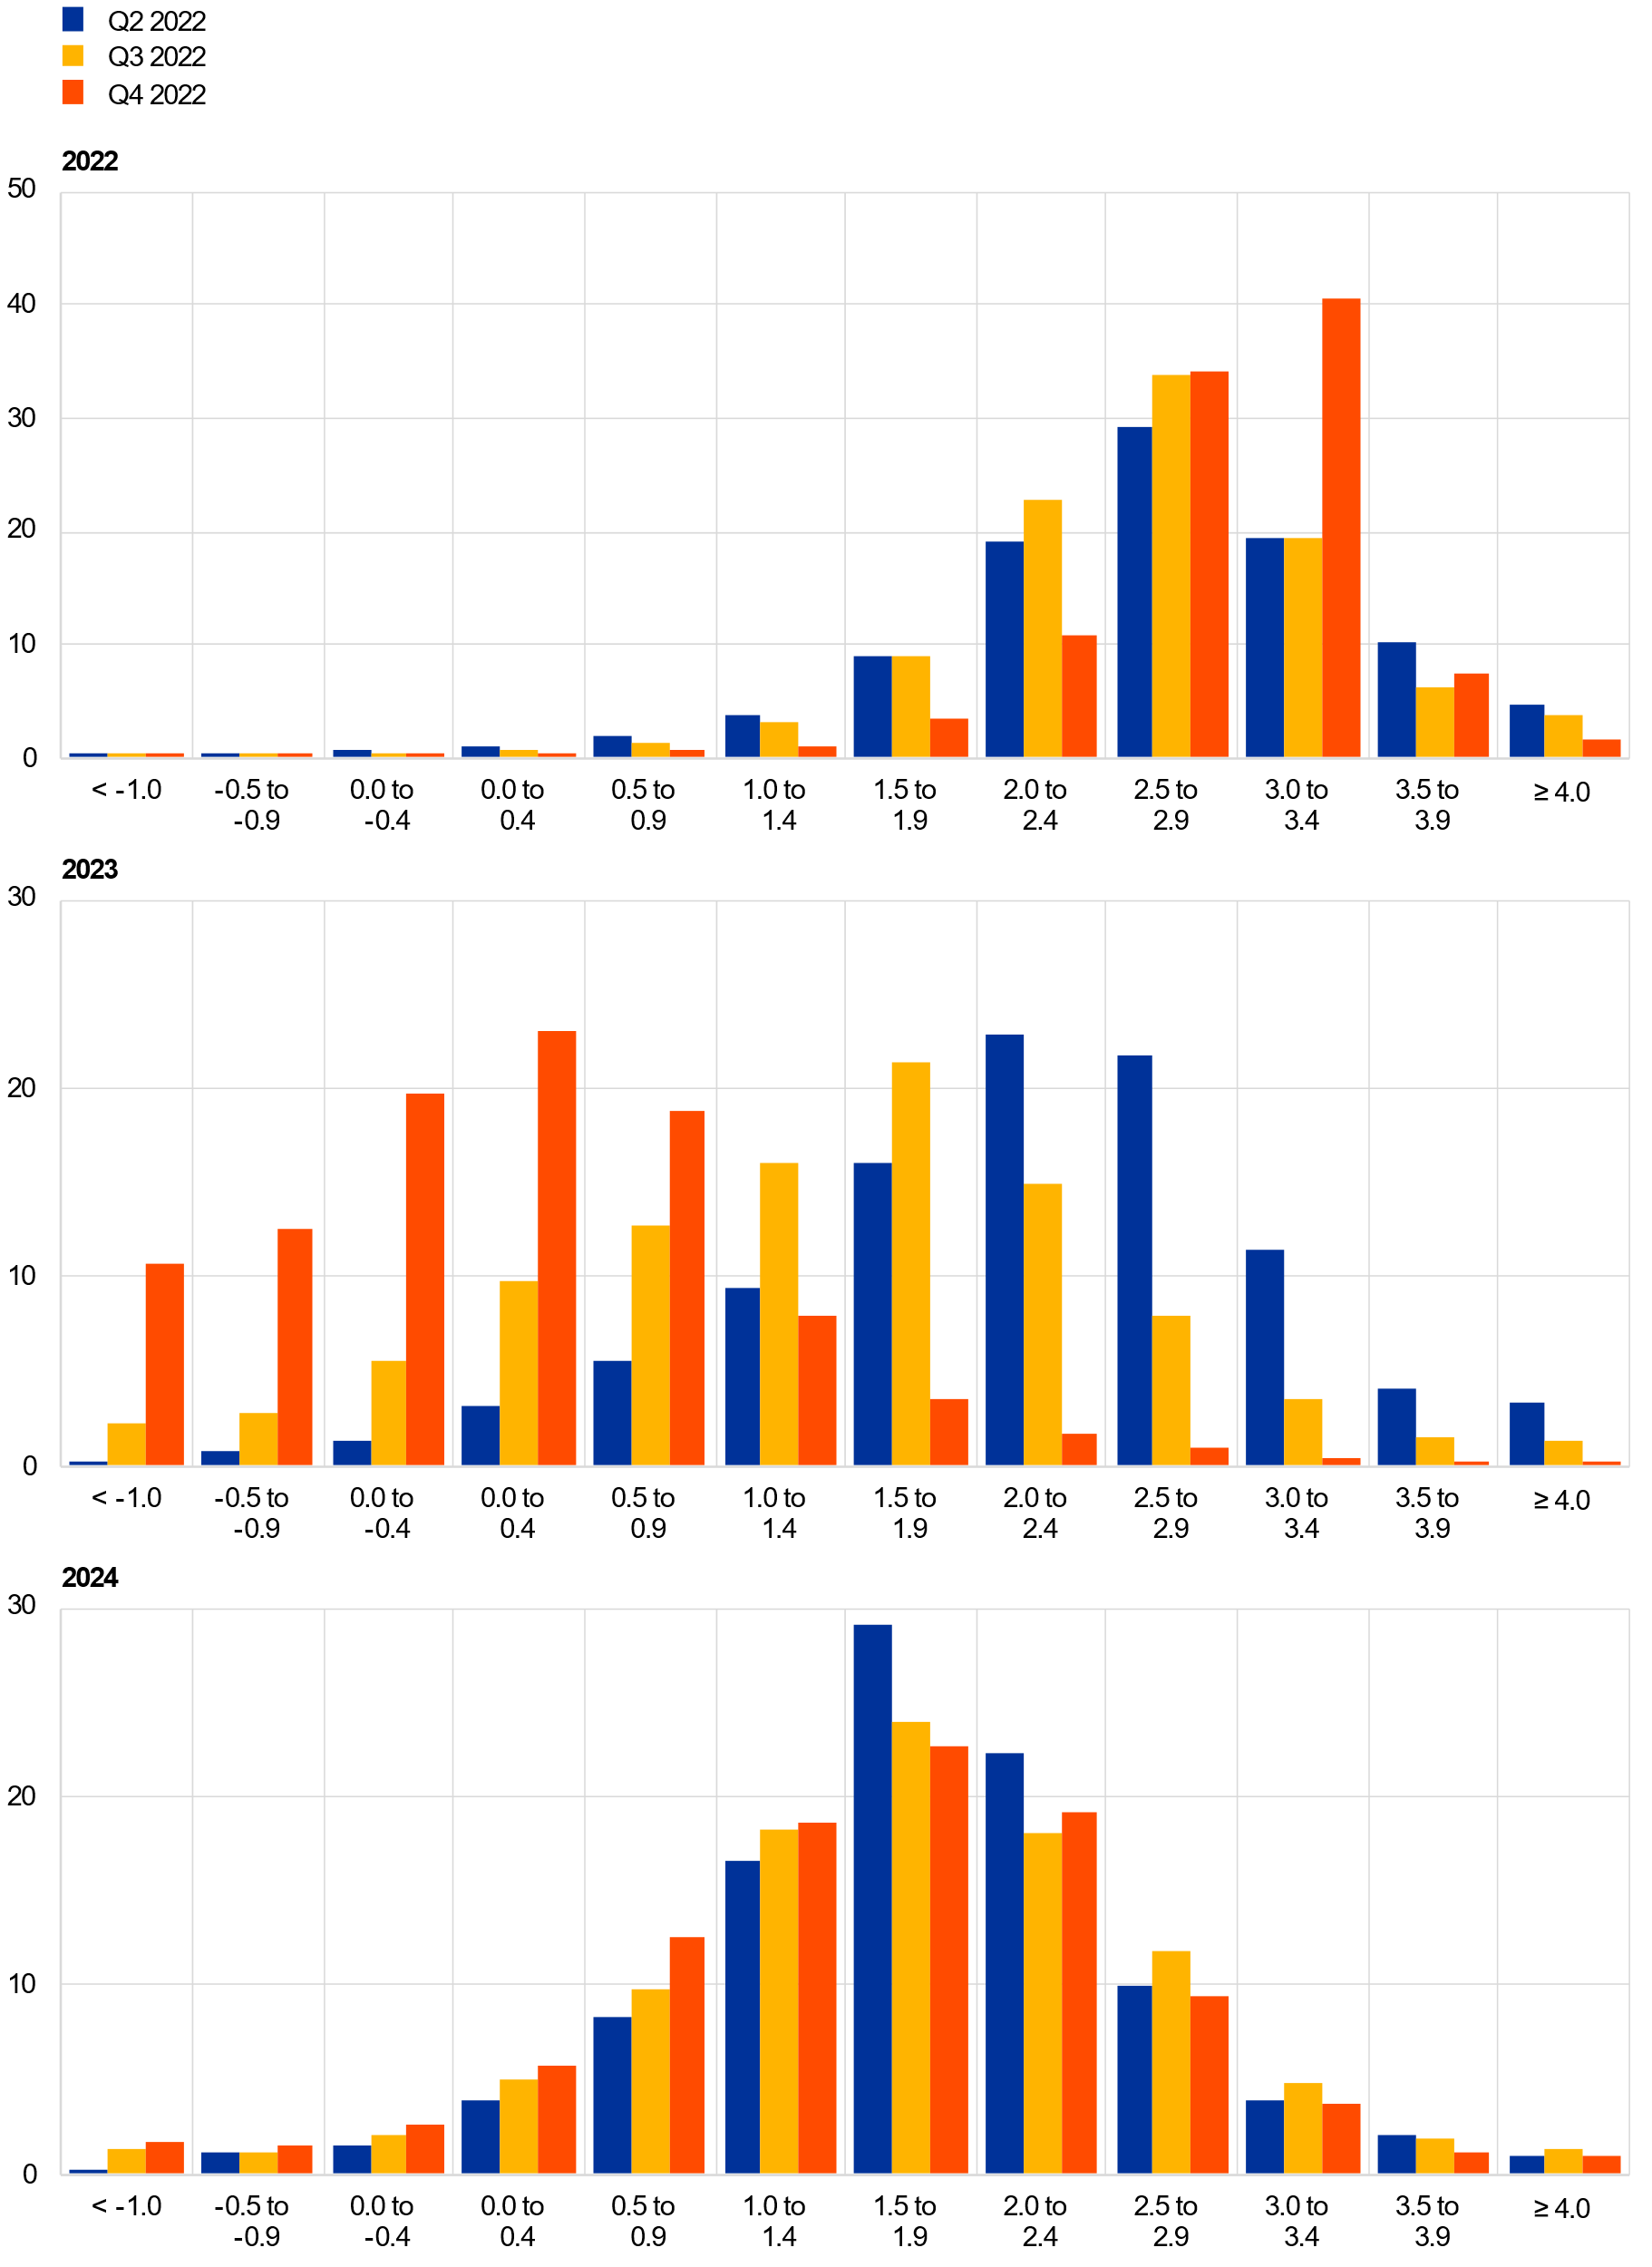
Notes: The SPF asks respondents to report their point forecasts and to separately assign probabilities to different ranges of outcomes. This Chart shows the average probabilities they assigned to different ranges of real GDP growth outcomes in 2022, 2023 and 2024.
Chart 10
Aggregate probability distribution for longer-term GDP growth expectations
(x-axis: real GDP growth expectations, annual percentage changes; y-axis: probability, percentages)
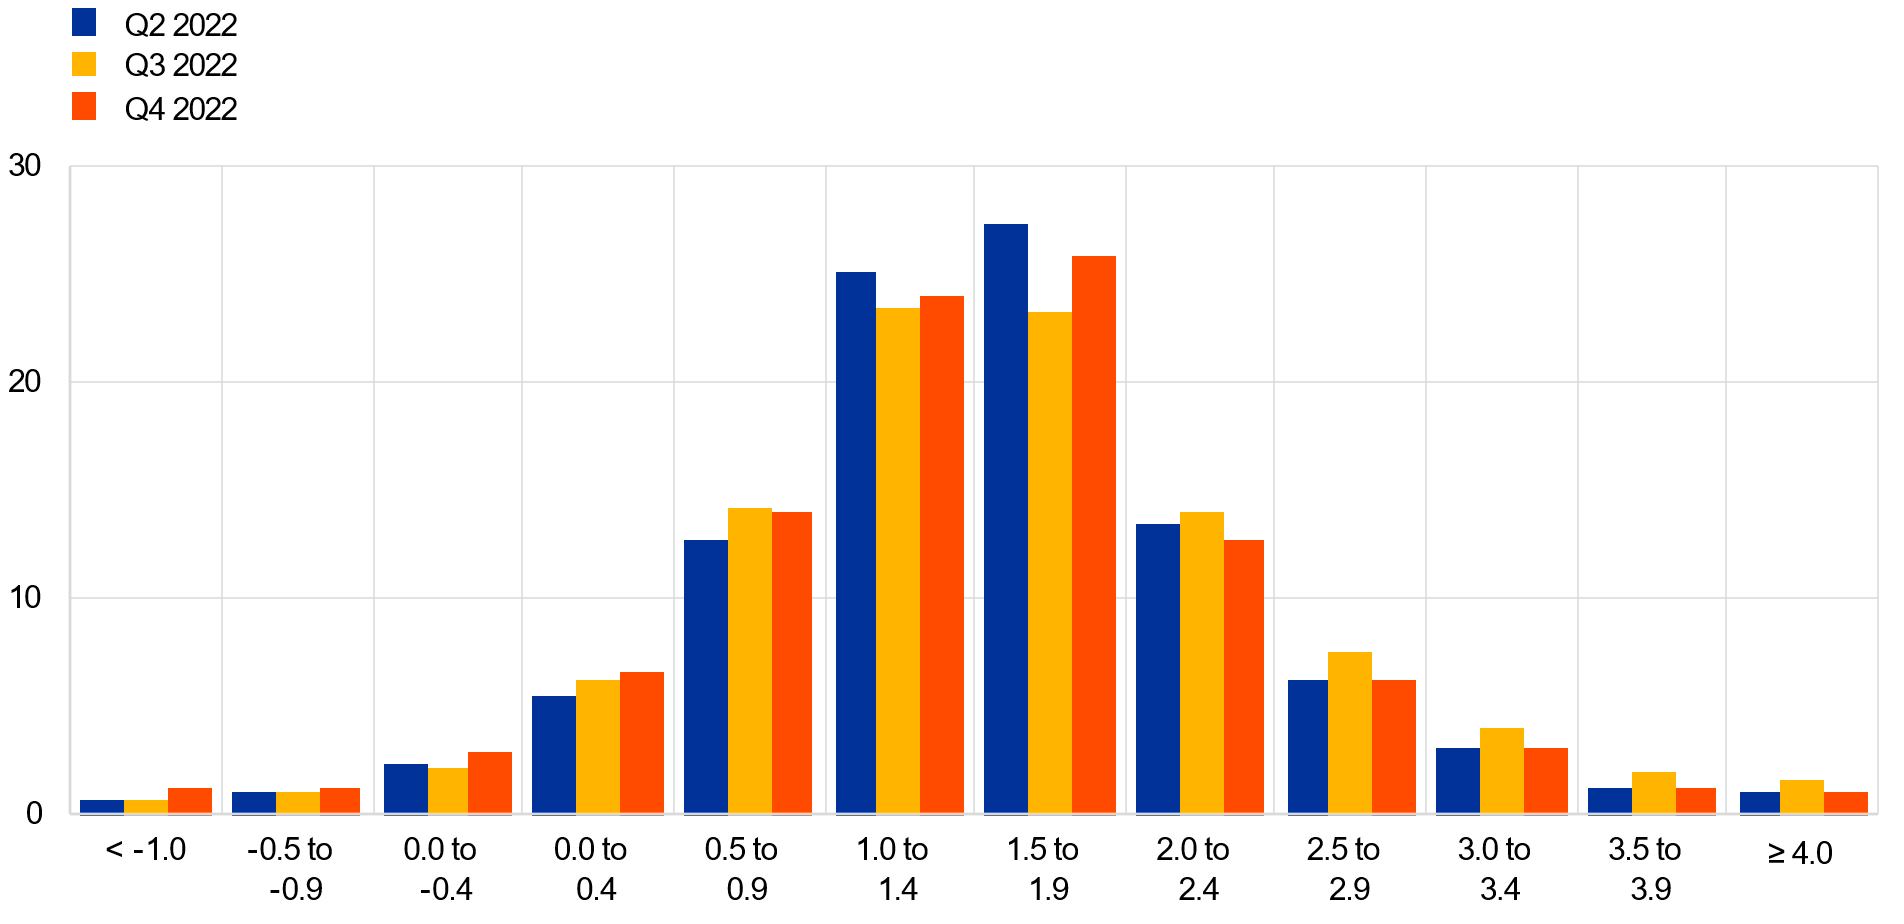
Notes: The SPF asks respondents to report their point forecasts and to separately assign probabilities to different ranges of outcomes. This Chart shows the average probabilities they assigned to different ranges of real GDP growth outcomes in the longer term. Longer-term expectations refer to 2027 in the third and fourth quarters of 2022 rounds and to 2026 in the second quarter of 2022 round.
4 Unemployment rate expectations broadly revised up
The average point forecasts for the unemployment rate in the fourth quarter of 2022 round were 6.8%, 7.1% and 7.0% for 2022, 2023 and 2024 respectively. These were revised upwards from the previous round by 0.1 percentage point for 2022 and 0.4 percentage points for 2023 and 2024. The expectation for 2027 was 6.6%, an upward revision of 0.2 percentage points but still close to the historical lows observed for the long-term unemployment expectations. The unemployment rate is expected to increase until 2023 and then follow a downward sloping trajectory – steeper than in the previous round, although hovering at higher levels (see Chart 11). The upward revisions to unemployment expectations are the first since the third quarter of 2020 round. Respondents reported the same factors as for lower growth expectations – for example, high energy inflation, weaker domestic and international demand – as the reasons for an upward revision of short- and medium-term unemployment expectations. Upside risks were perceived in a further slowdown of economic activity. By contrast, demographic factors and labour shortages in certain sectors were frequently mentioned as downside risks.
Chart 11
Expectations for the unemployment rate
(percentages of the labour force)
Uncertainty around expectations for the unemployment rate increased slightly for all horizons, remaining at relatively high levels, and the balance of risks was broadly neutral for all horizons. On balance, the distributions continued losing the somewhat positive skewness of previous rounds and are now showing a greater degree of symmetry for all horizons (see Chart 12 and Chart 13). The balance of risk indicator for longer-term expectations remained positive, as the mean of the aggregated probability distribution (at 6.7%) was slightly higher than the average point forecast (6.6%).
Chart 12
Aggregate probability distributions for the unemployment rate in 2022, 2023 and 2024
(x-axis: unemployment rate expectations, percentages of the labour force; y-axis: probability, percentages)
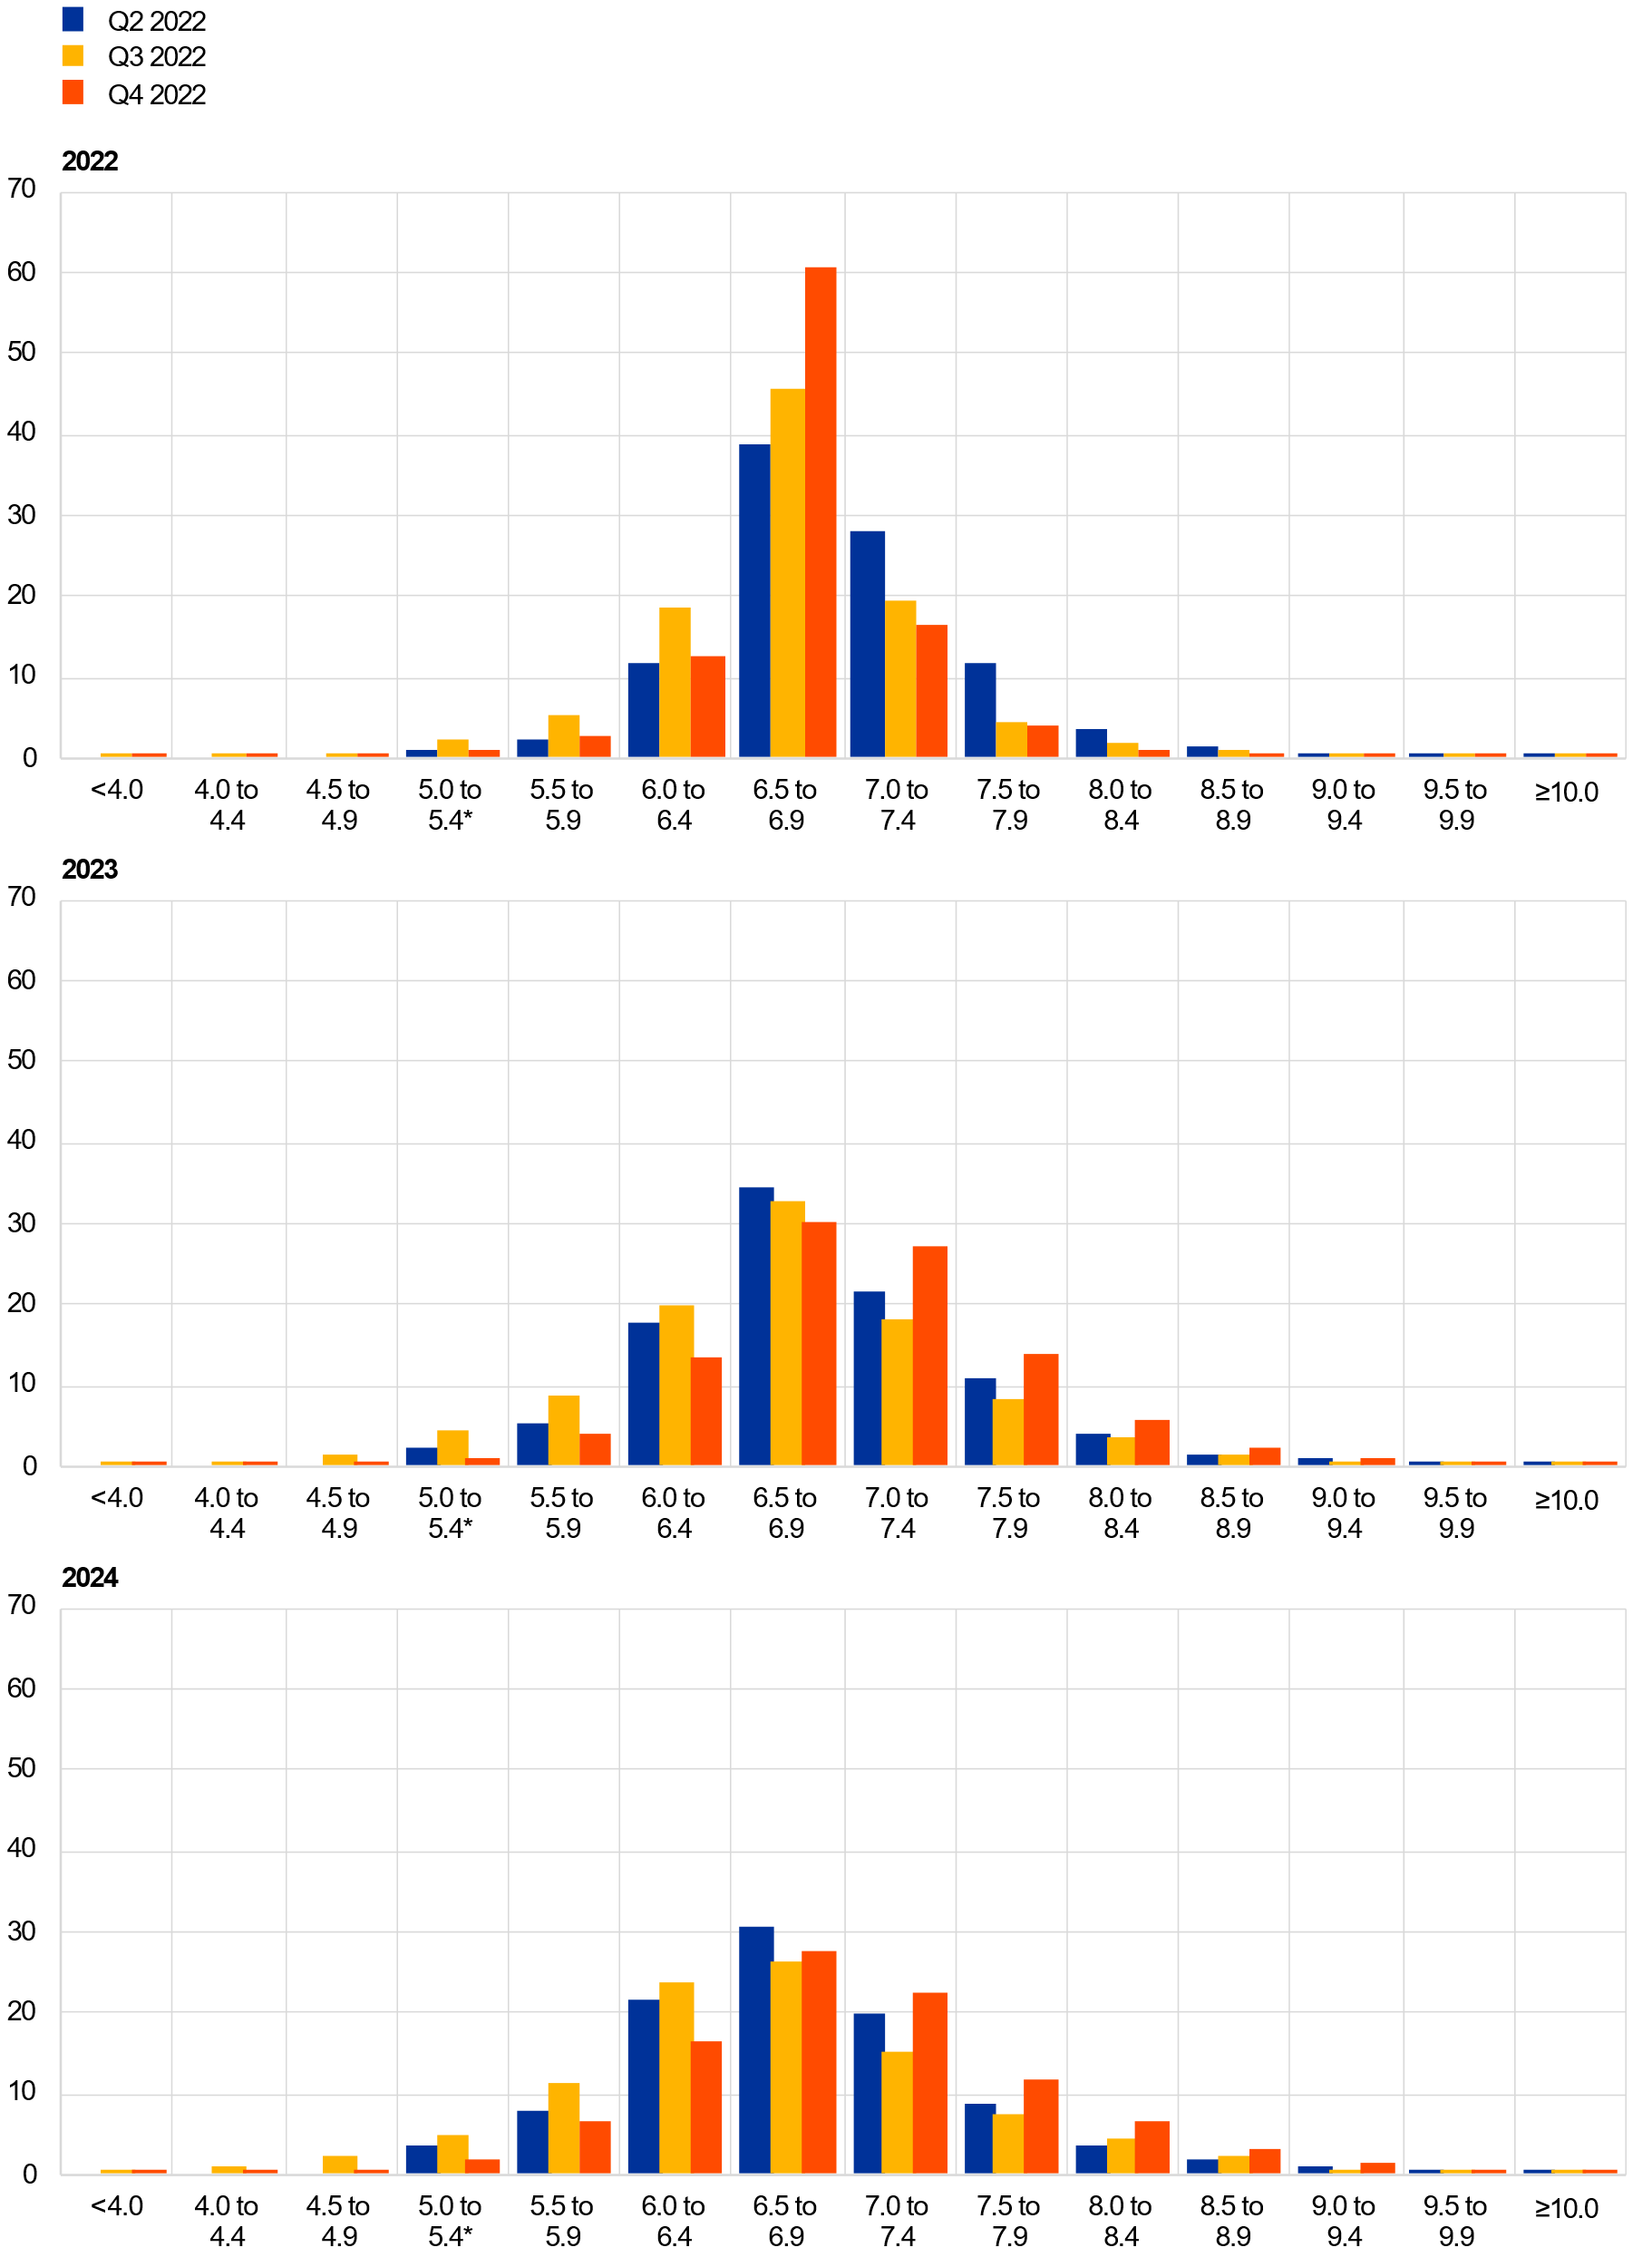
Notes: The SPF asks respondents to report their point forecasts and to separately assign probabilities to different ranges of outcomes. This Chart shows the average probabilities they assigned to different ranges of unemployment rate outcomes for 2022, 2023 and 2024. *The lowest bin used in the second quarter of 2022 round was ≤5.0.
Chart 13
Aggregate probability distribution for the unemployment rate in the longer term
(x-axis: unemployment rate expectations, percentages of the labour force; y-axis: probability, percentages)
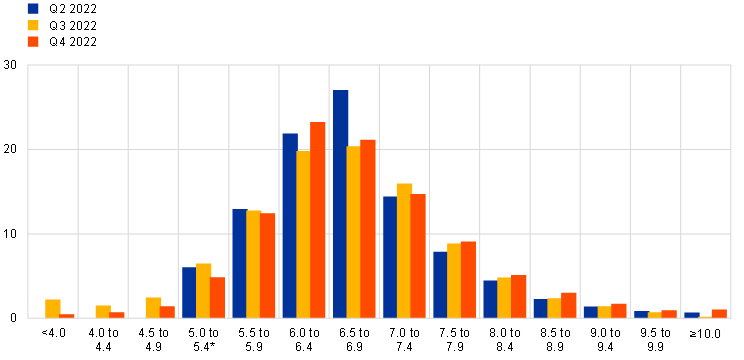
Notes: The SPF asks respondents to report their point forecasts and to separately assign probabilities to different ranges of outcomes. This Chart shows the average probabilities they assigned to different ranges of unemployment rate outcomes in the longer term. *The lowest bin used in the second quarter of 2022 round was ≤5.0. Longer-term expectations refer to 2027 in the third and fourth quarter of 2022 rounds and to 2026 in the second quarter of 2022 round shown.
5 Expectations for other variables
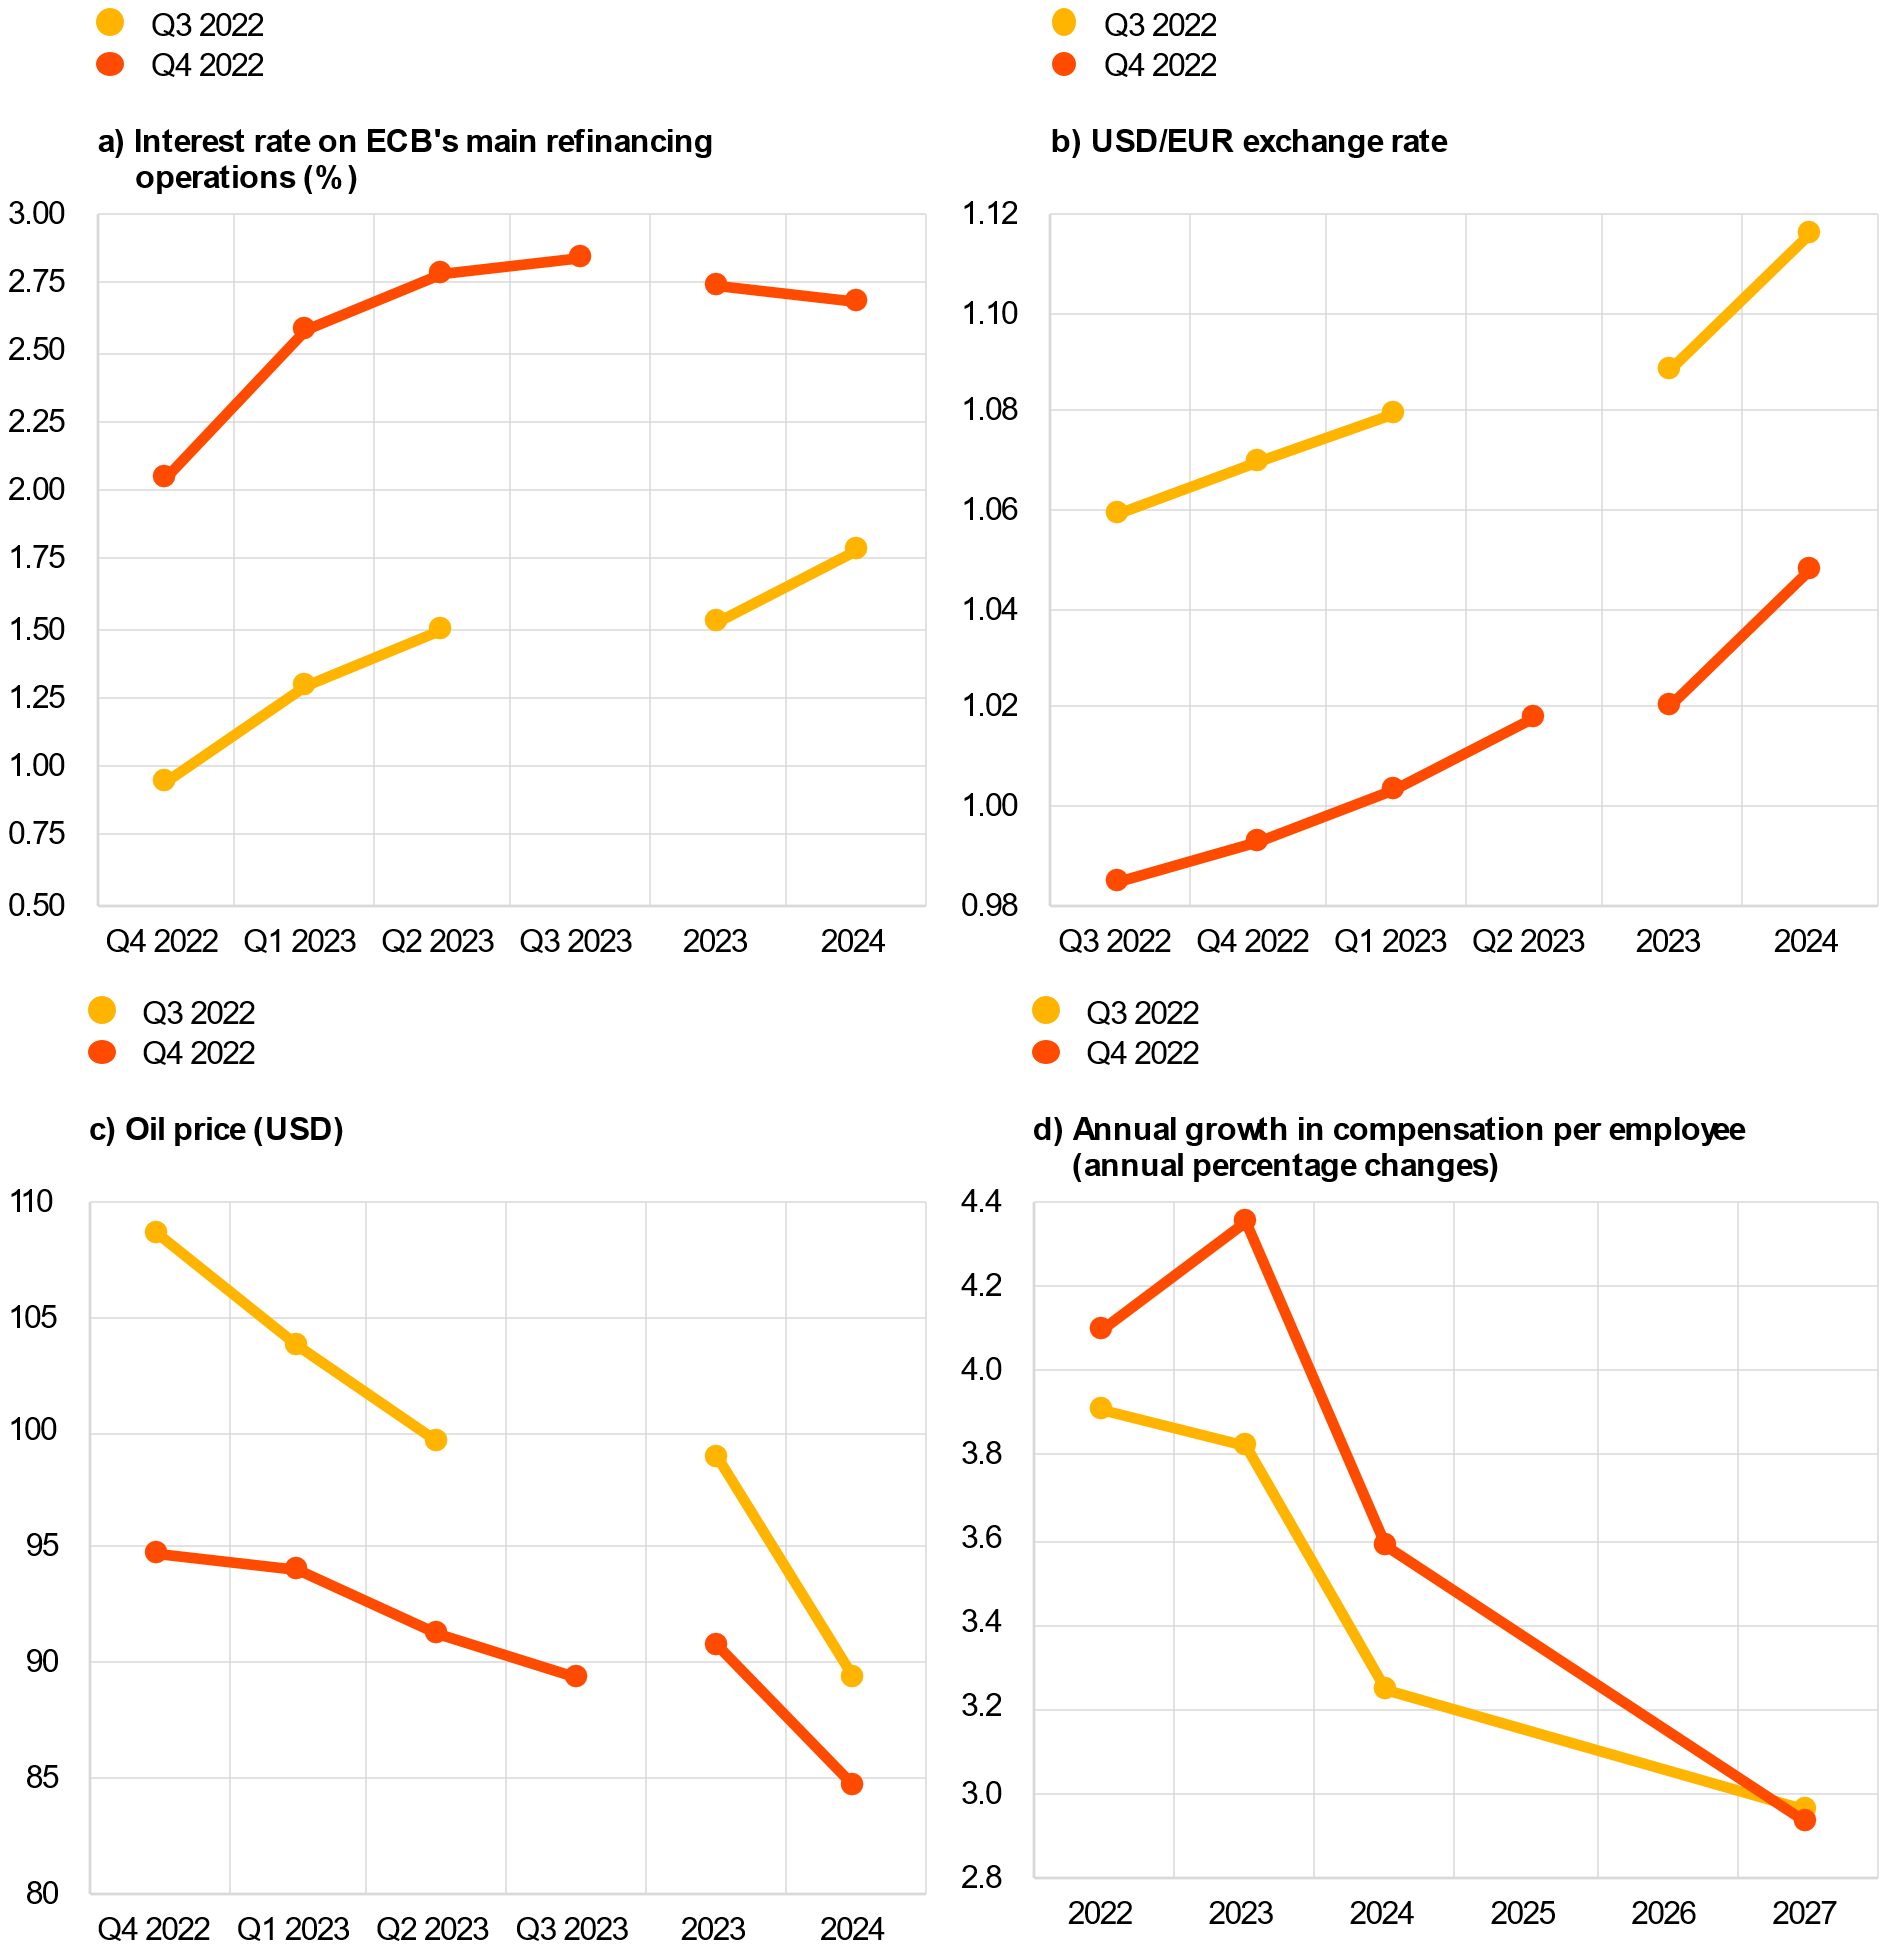
Forecasters expected: the ECB’s key main refinancing operations (MRO) interest rate to increase steadily from 2.0% in the fourth quarter of 2022 to 2.6% in the first quarter of 2023 and stabilise at around an average of 2.7% until 2024; the euro to marginally appreciate against the dollar from 0.98 in the fourth quarter of 2022 to 1.05 in 2024; oil prices to progressively decrease to levels around USD 85 per barrel until 2024; and nominal wage growth to increase at a rate higher than 4% until 2023 but to moderate to below 3% in the long-term.
The median (and majority) expectation, based on approximately 50 replies, was for the rate on the Eurosystem’s main refinancing operations to increase steadily from 2.0% in the fourth quarter 2022 to 2.9% in the third quarter of 2023. Interest rates are expected to fluctuate around an average level of 2.7% between 2023 (up from 1.5%) and 2024 (up from 1.8%) (see Chart 14a). Concerning the 2023 average, 36% of the replies reported values below 2.5% (down from 98%). Similarly, 18% (down from 83%) of respondents expected interest rates to be, on average, below 2% in 2024 and about 58% (up from 5%) to be above 2.5%.
The expected average USD/EUR exchange rate was revised downward over all horizons and it is expected to stand at around 1.02 in 2023, to then marginally increase up to 1.05 by 2024 (see Chart 14b).
Compared with the previous round, the level of US dollar-denominated oil prices (per barrel) was revised downwards. The revisions were about USD 8 and USD 5 per barrel for 2023 and 2024, respectively. This resulted in a flatter downward trajectory from about USD 95 per barrel in the fourth quarter of 2022 to around USD 85 per barrel in 2024 (see Chart 14c). Notwithstanding the weaker expected USD/EUR exchange rate, the implied revisions to the profile for the oil price in euro terms are lower than those in US dollar terms – EUR 1.9 in 2023 and EUR 0.8 in 2024.
Expectations for the annual growth in compensation per employee were revised up by 0.2-0.5 percentage points over all horizons up to 2024 (see Chart 14d). At 2.2 percentage points, the combined revisions in the past two rounds to the next and year after next calendar year horizons have been the largest since this question was first asked in 2004. However, expectations for 2027 were recorded to stand at about 2.9%, essentially unchanged from the previous round.
Chart 14
Expectations for other variables
6 Annex (Chart data)
Excel data for all charts can be downloaded here.
© European Central Bank, 2022
Postal address 60640 Frankfurt am Main, Germany
Telephone +49 69 1344 0
Website www.ecb.europa.eu
All rights reserved. Reproduction for educational and non-commercial purposes is permitted provided that the source is acknowledged.
For specific terminology please refer to the ECB glossary (available in English only).
PDF ISSN 2363-3670, QB-BR-22-003-EN-N
HTML ISSN 2363-3670, QB-BR-22-003-EN-Q
The survey was conducted between 30 September and 6 October 2022, with 59 responses received. This is in line with the historical average response rate. Participants were provided with a common set of the latest available data for annual HICP inflation (September 2022 flash estimates: overall inflation, 10.0%; underlying inflation, 4.8%), annual GDP growth (second quarter of 2022, 4.1%) and unemployment (August 2022, 6.6%). This report was drafted on the basis of data available 14 October 2022.
The width of the reported probability distributions indicates the perceived degree of overall uncertainty, whereas the asymmetry of the distributions indicates whether that uncertainty is more concentrated on higher or lower outturns, i.e. it measures the perceived balance of risks. Regarding uncertainty, it can be shown that the width (or standard deviation) of the aggregated probability distribution (i.e. “aggregate uncertainty”) is a function of the average width (or standard deviations) of the individual probability distribution (i.e. “individual uncertainty”) and standard deviation of the individual point forecasts (i.e. “disagreement”).
It is assumed that the midpoint of the open-ended interval lies 0.5 percentage points (the width of the bins provided) above/below the midpoint of the interval below/above. For example, the midpoint of the bin >5% is assumed to be 5.2%, which is 0.5 percentage points above the midpoint of 4.7% of the bin below, i.e. 4.5-4.9%.
49 respondents provided this profile.
-
28 October 2022