
The ECB Survey of Professional Forecasters - Second quarter of 2021
Summary
In the ECB Survey of Professional Forecasters (SPF) for the second quarter of 2021, HICP inflation expectations were revised upward for 2021 but were largely unchanged for other horizons, standing at 1.6%, 1.3% and 1.5% for 2021, 2022 and 2023, respectively.[1] Longer-term inflation expectations (for 2025) stood at 1.7%, also unchanged compared with the previous round. Regarding GDP growth, SPF respondents revised down their expectations for 2021 but up for 2022, implying a further delay in the expected recovery. The profile of unemployment has been revised down for 2021-23, but longer-term expectations were unchanged at 7.4%, implying an overall slightly less pronounced downward trajectory. Indicators of the uncertainty surrounding expectations for the main macroeconomic variables mostly eased somewhat but remained elevated by historical standards.
Table 1
Results of the SPF in comparison with other expectations and projections
(annual percentage changes, unless otherwise indicated)
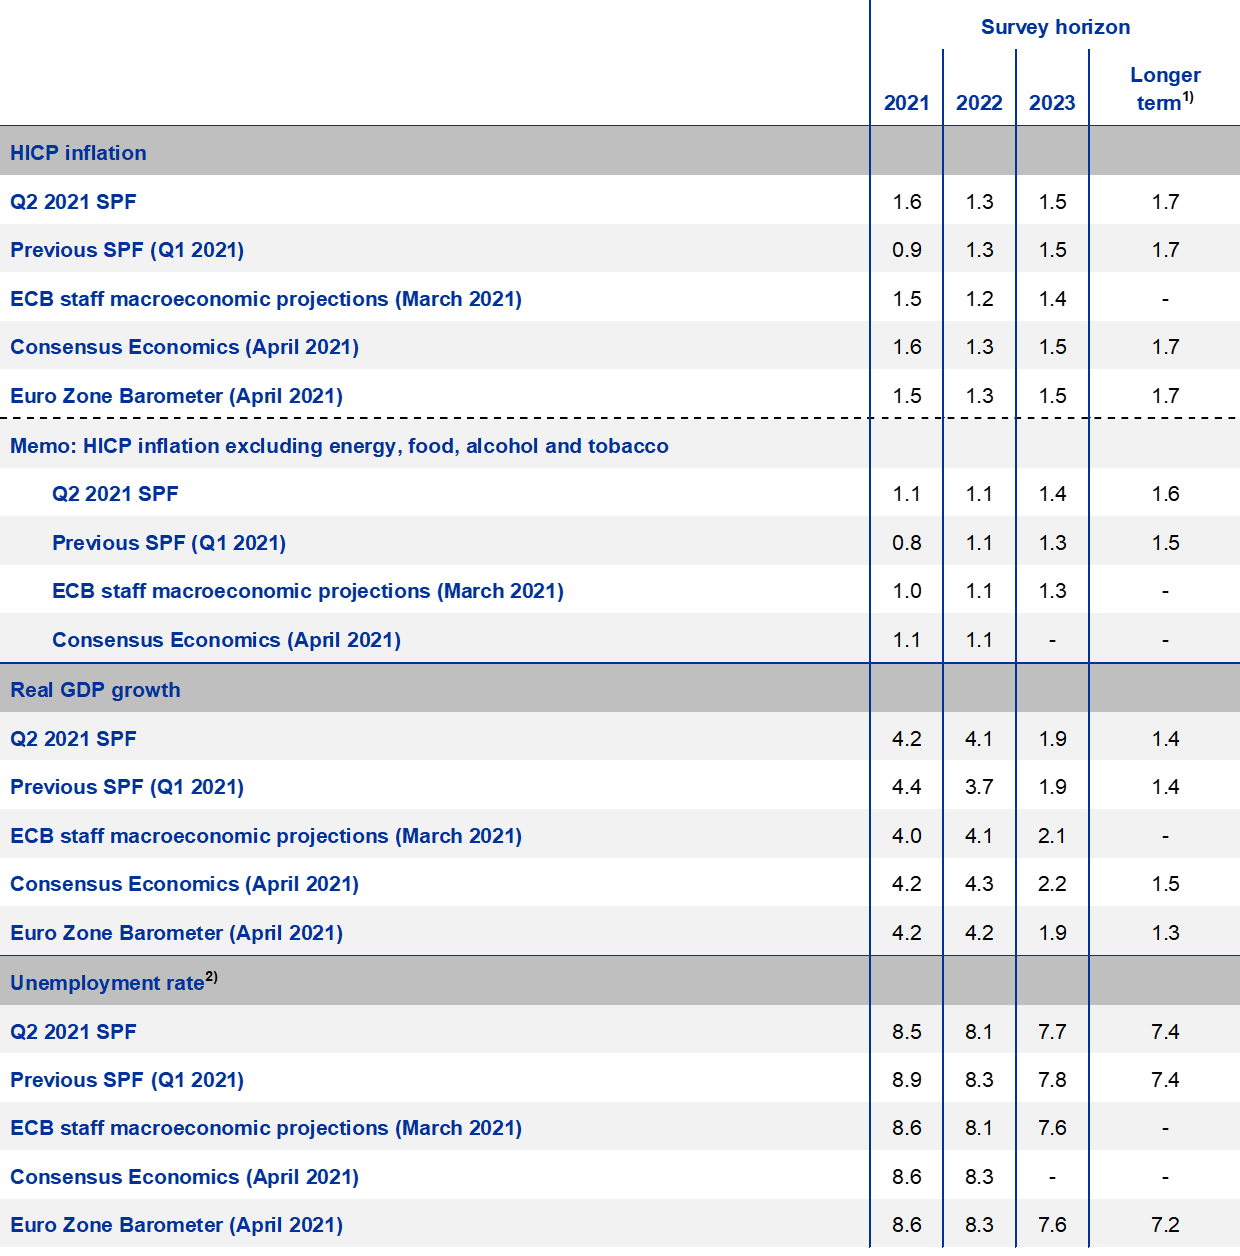
1) Longer-term expectations refer to 2025.
2) As a percentage of the labour force.
1 HICP inflation expectations revised up for short term but otherwise largely unchanged
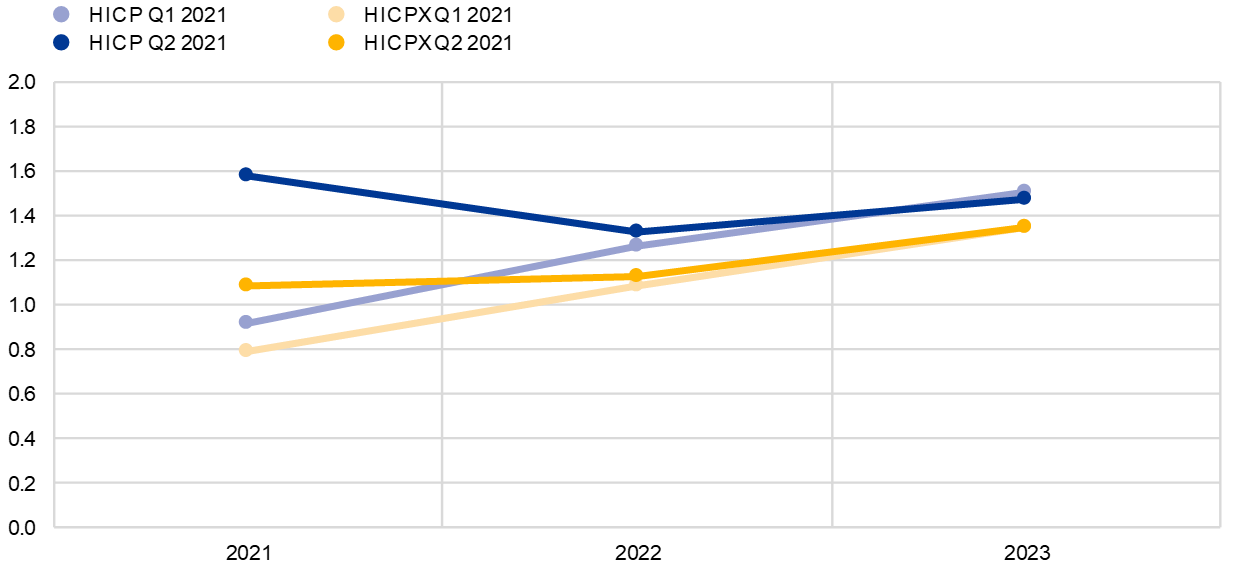
SPF inflation expectations were revised upward for 2021 but kept largely unchanged thereafter. Average inflation expectations for 2021, 2022 and 2023 were 1.6%, 1.3% and 1.5% respectively (see Chart 1). For 2021 these were revised upward (by 0.7 percentage point) from the previous round but they were unchanged for 2022 and 2023. Compared with the March 2021 ECB staff macroeconomic projections, inflation expectations were slightly higher, by 0.1 percentage point, for each year from 2021 to 2023 (see Table 1).
Respondents considered the factors behind the upward revision for 2021 to be largely temporary. Some respondents stated they were (upwardly) surprised by the inflation data at the beginning of 2021. They cited a number of factors, including the recent rise in oil prices, a stronger than anticipated impact from the normalisation of VAT rates in Germany, the shifting of seasonal sales patterns in some countries and changes in HICP weights stemming from the impact of the pandemic on consumption patterns in 2020. Looking ahead, respondents considered that these factors would be confined to 2021 as the expected profile for oil prices was broadly flat out to 2023, the VAT impact would be once-off and impacts of shifting of seasonal sales patterns and changing HICP weights could even be reversed during the year.
Regarding the broader factors in the inflation outlook, respondents, on average, continued to believe that the downward impact from weak demand in the context of the ongoing pandemic would outweigh any possible upward impact from supply restrictions. While some respondents thought that the prices for goods and services most affected by pandemic-related restrictions (such as package holidays, restaurants and clothing) would remain weak, others considered that there could be a strong rebound if pent-up demand and forced savings were released. Some respondents noted the recent increase in some commodity, transportation and producer prices more generally but considered that further increases were unlikely once shorter-term supply issues had been resolved.
Looking beyond the “temporary” factors in 2021, expectations for inflation excluding energy, food, alcohol and tobacco (HICPX) continued to be for a gradual upward movement (see Chart 1). Some of the factors behind the upward revision to short-term headline inflation expectations were seen to also affect the HICPX (namely the stronger than expected impact of the VAT normalisation in Germany, the shifting of seasonal sales patterns and changing HICP weights). Thus, while expectations for HICPX inflation in 2021 were revised upward by 0.3 percentage point (to 1.1%), they were unchanged for 2022 at 1.1% and also essentially for 2023 as the 1.4% (1.3% previously) effectively reflected rounding. For 2022 and 2023, the expected profiles of HICP and HICPX inflation both show a broadly similar upward movement, although the expected rate of HICPX inflation was approximately 0.2 percentage point lower than that for HICP. The SPF forecasts for HICPX in 2021 were slightly higher than those from the March 2021 ECB staff macroeconomic projections but essentially the same for 2022 and 2023.
Chart 1
Inflation expectations: overall HICP inflation and HICP inflation excluding energy, food, alcohol and tobacco
(annual percentage changes)
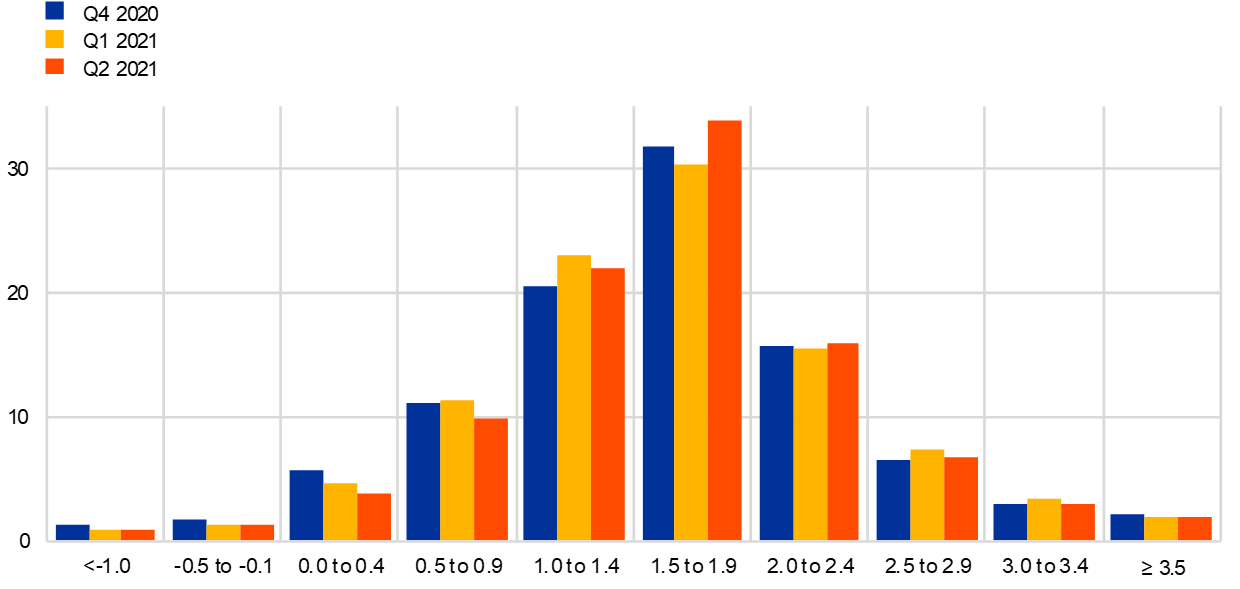
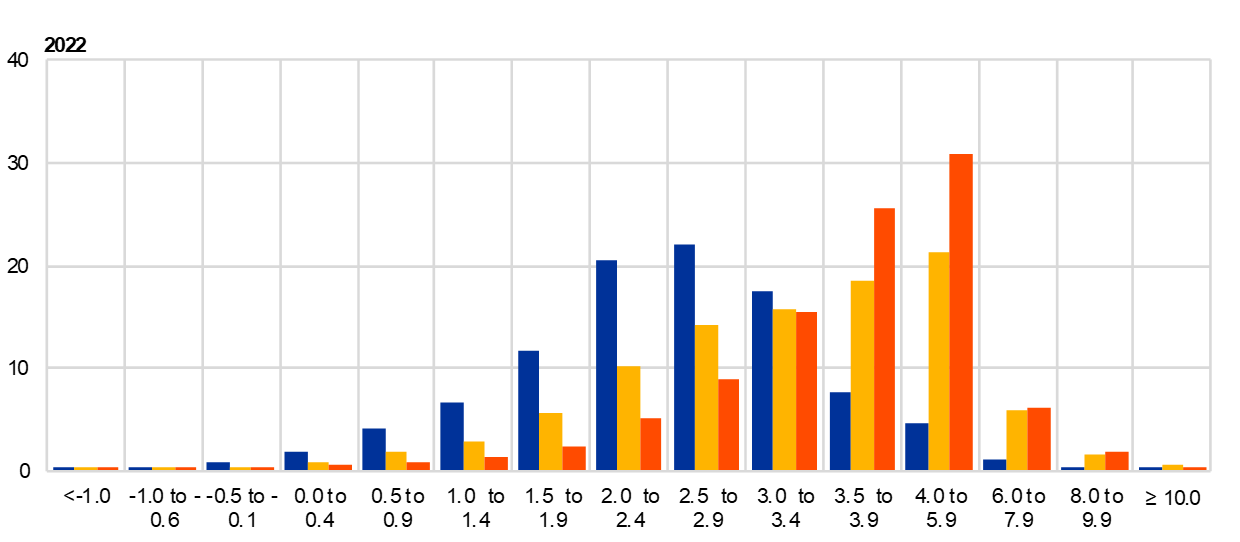
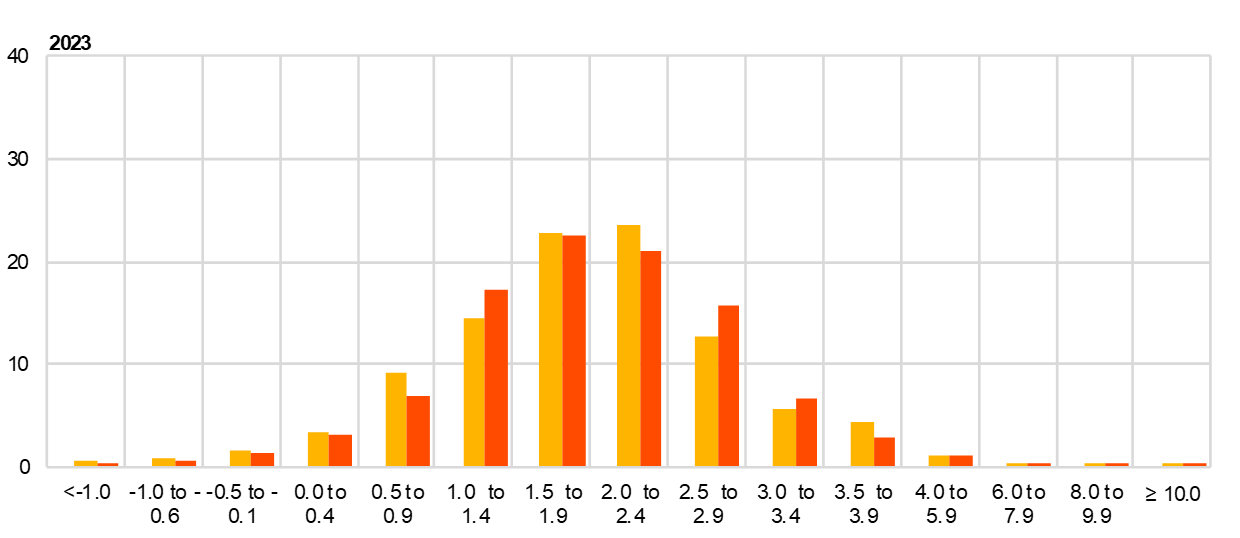
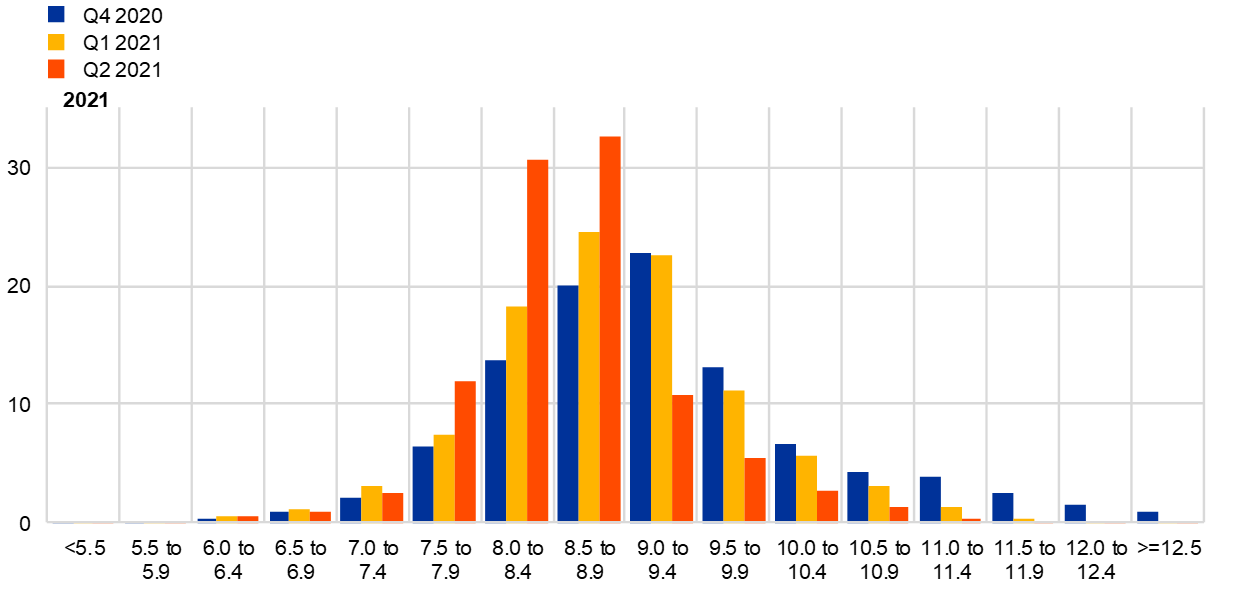
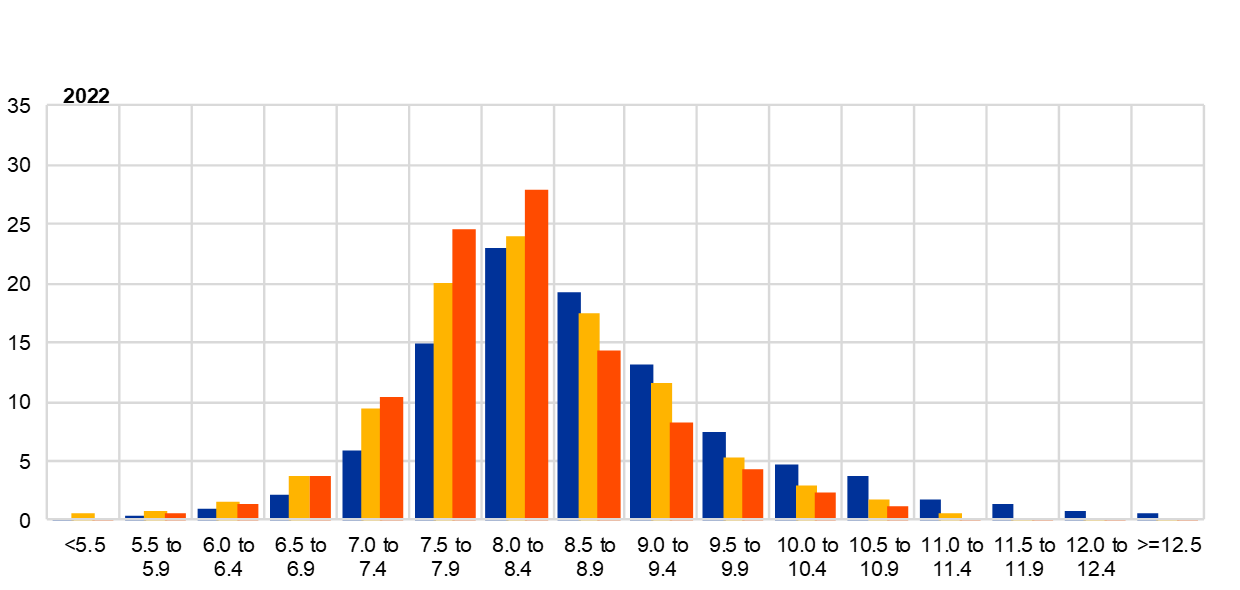
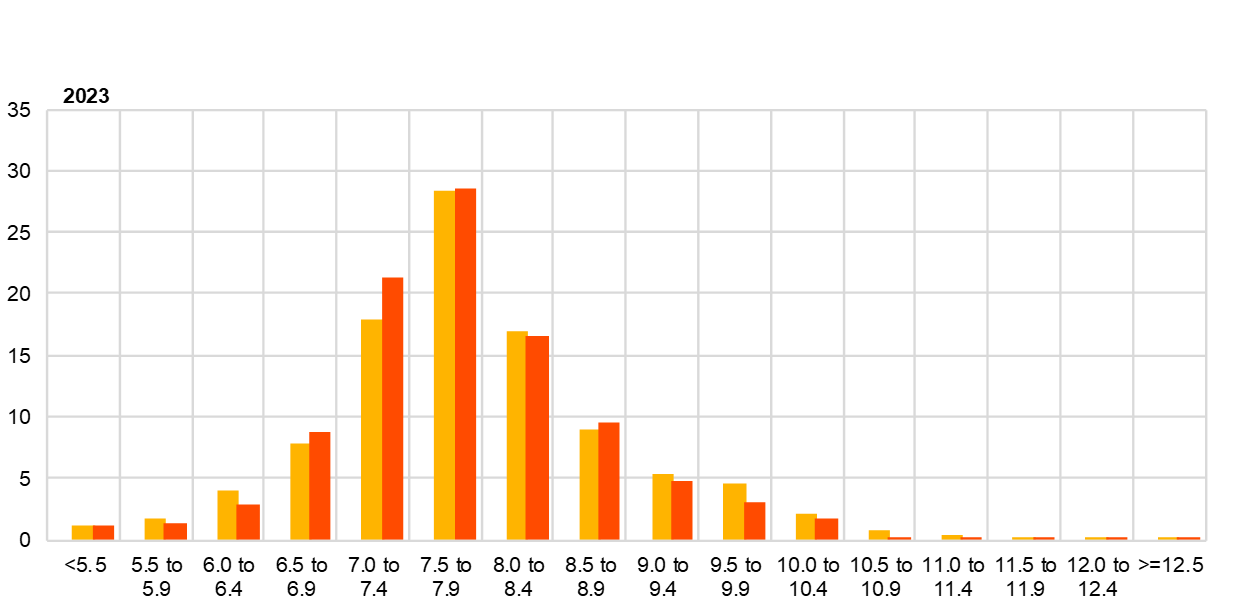
Quantitative indicators of perceived uncertainty eased back somewhat further and risks were assessed to have remained broadly balanced. The main source of uncertainty remained the evolution and impact of the pandemic. While third waves of the pandemic and intensified lockdowns cloud the near-term inflation outlook (downside risk), some respondents believed there could be an upward impact should vaccination rollout efforts prove successful and pent-up demand be released (upside risk). Quantitative indicators of uncertainty for inflation derived from the reported probability distributions eased somewhat further. The width of the reported probability distributions indicates the perceived degree of uncertainty, whereas the asymmetry of the distributions indicates whether that uncertainty is more concentrated on higher or lower outturns, i.e. it measures the perceived balance of risks. The aggregate probability distributions for the calendar years 2021-23 are presented in Chart 2. For 2021, the modal bin range (i.e. the one with the largest associated probability) shifted to 1.5-1.9% (from 0.5-0.9%), while the probability mass in the modal bin range for 2022 (1.0-1.4%) remained largely unchanged.
Chart 2
Aggregate probability distributions for expected inflation in 2021, 2022 and 2023
(x-axis: HICP inflation expectations, annual percentage changes; y-axis: probability, percentages)


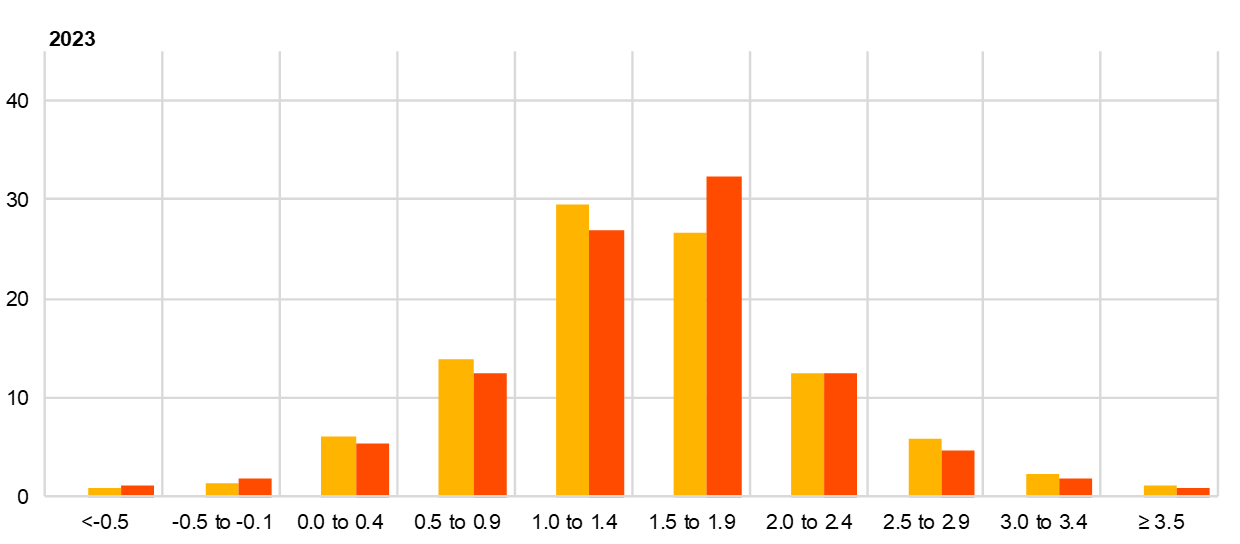
Notes: The SPF asks respondents to report their point forecasts and to separately assign probabilities to different ranges of outcomes. This chart shows the average probabilities they assigned to different ranges of inflation outcomes in 2021, 2022 and 2023.
2 Average longer-term inflation expectations unchanged at 1.7%
Longer-term inflation expectations averaged 1.7% for 2025, unrevised from the previous round. Considering a balanced panel between the two rounds, slightly more respondents revised their longer-term inflation expectations upward than downward while the bulk kept them unchanged. Overall, longer-term inflation expectations continued to hover around the historically low levels observed since the round for the fourth quarter of 2019. The same holds for other summary statistics such as the median point forecast and the estimated mean of the aggregate probability distribution (see Chart 3). The peak of the distribution of individual point forecasts was largely similar to that observed since the first quarter of 2019, with the modal response unchanged at 1.6% (see Chart 4) although (as already in the previous round) a number of respondents reported longer-term inflation expectations slightly above 2%.
The longer-term expectations for HICP inflation excluding energy, food, alcohol and tobacco (HICPX) were also broadly unchanged. The increase to 1.6% for 2025, up from 1.5% in the previous round, largely reflected rounding as the increase was at the second decimal. The median longer-term point forecast for HICPX increased somewhat further – standing also at 1.6%.
Chart 3
Longer-term inflation expectations
(annual percentage changes)

Chart 4
Distribution of point expectations for HICP inflation in the longer term
(x-axis: longer-term HICP inflation expectations, annual percentage changes; y-axis: percentages of respondents)

Notes: The SPF asks respondents to report their point forecasts and to separately assign probabilities to different ranges of outcomes. This chart shows the spread of point forecast responses.
Uncertainty surrounding longer-term inflation expectations moderated slightly further, albeit remaining elevated, and the balance of risks stayed to the downside. In line with uncertainty indicators for shorter horizons, there was some moderation in the standard deviation of the aggregate probability distribution (although it remained at a relatively high level by historical standards). The balance of risks remained clearly to the downside, albeit to a slightly lesser degree than in the previous round. The probability associated with longer-term inflation being negative remained unchanged from the previous round at 2% (see Chart 5).
Chart 5
Aggregate probability distribution for longer-term inflation expectations
(x-axis: HICP inflation expectations, annual percentage changes; y-axis: probability, percentages)
Notes: The SPF asks respondents to report their point forecasts and to separately assign probabilities to different ranges of outcomes. This chart shows the average probabilities they assigned to different ranges of inflation outcomes in the longer term.
3 Real GDP growth expectations imply a further delay in recovery, with growth revised downward in 2021 and upward in 2022
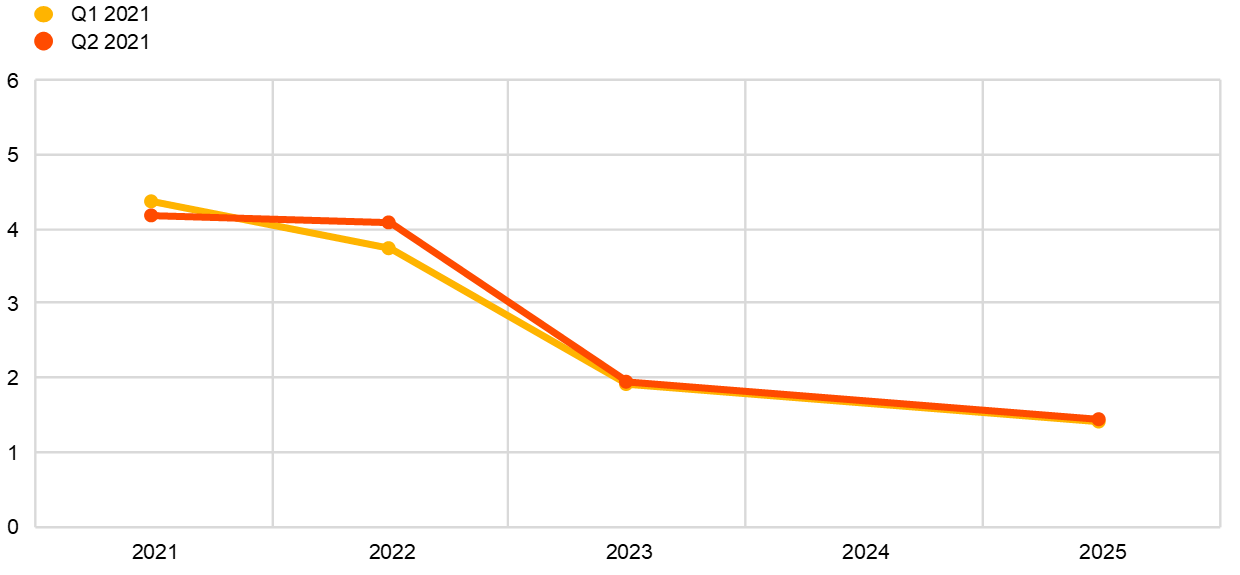
GDP growth expectations in the survey round for the second quarter stood at +4.2% for 2021, at +4.1% for 2022 and at +1.9% for 2023 (see Chart 6). Similar to the previous round, albeit at a smaller scale, these expectations reflected counteracting revisions – a downward revision of 0.2 percentage point for 2021 and an upward revision of 0.4 percentage point for 2022. Respondents mainly flagged the recent re-emergence of new infections (with more infectious virus variants) and associated lockdown measures as the reason to revise downward their expectations for 2021, with a recovery of the economy now only happening later in the year and continuing longer into 2022. Nonetheless, a number of respondents also mentioned that the strong survey data indicate that the lockdowns have hurt the economy less than expected. Some also noted that the industrial sector continues to be supported by robust foreign demand from China and the United States. Compared with the baseline of the March 2021 ECB staff macroeconomic projections, the average SPF point forecasts were somewhat higher for 2021, in line for 2022 and somewhat lower for 2023 (see Table 1). Longer-term growth expectations (which refer to 2025) remained stable at 1.4%.
Chart 6
Expectations for real GDP growth
(annual percentage changes)
Respondents were again asked to specifically discuss the profile of their short-term GDP outlook. More than 50 respondents provided their expected quarterly profile of quarter-on-quarter GDP growth from the first to the fourth quarter of 2021. On average, they expected real GDP to have declined by 0.6% in the first quarter of 2021 and to increase by 1.4% in the second quarter of 2021, implying downward revisions by 0.7 and 0.9 percentage point, respectively (see Chart 7). For the third and fourth quarters, their expectations remained broadly in line with those in the previous survey round, that is quarter-on-quarter growth of 2.5% and 1.2%, respectively. This short-term pattern reflected the slower rollout of vaccinations in the first months of 2021 as well as renewed lockdown measures but also more confidence that the expected recovery will materialise as containment restrictions are gradually lifted. Compared with the March 2021 macroeconomic projection exercise, SPF respondents were on average more optimistic for the third quarter of 2021 and broadly in line with the other quarters (see Chart 7).
Chart 7
Expected profile of quarter-on-quarter GDP growth
(quarter-on-quarter percentage changes)
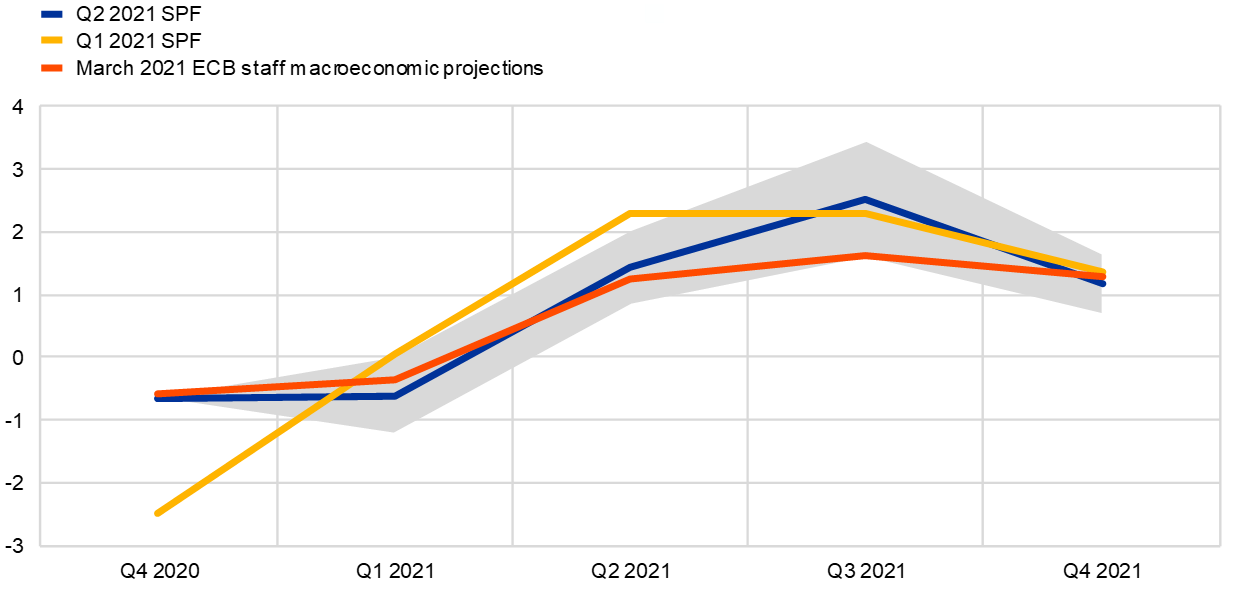
Notes: Grey area indicates one standard deviation (of individual expectations) around average SPF expectation.
The growth expectations still imply a return of GDP above its 2019 level during 2022 (see Chart 8). However, this essentially reflects the stronger than anticipated growth outturn in the fourth quarter of 2020, meaning that realised GDP in 2020 was higher (by 0.5 percentage point) than expected in the previous round, and this higher starting point than in the previous survey round carries forward across the whole forecast horizon. As a result, at the point in 2022 where GDP is expected to be above its 2019 level, it stands higher (by 0.7 percentage point) than anticipated in the previous survey round. However, this would still be 2.6 percentage points lower than the level forecast for 2022 in the round for the first quarter of 2020, i.e. before Europe was affected by the coronavirus (COVID-19).
Chart 8
Forecast profile of real GDP level
(2019 = 100)
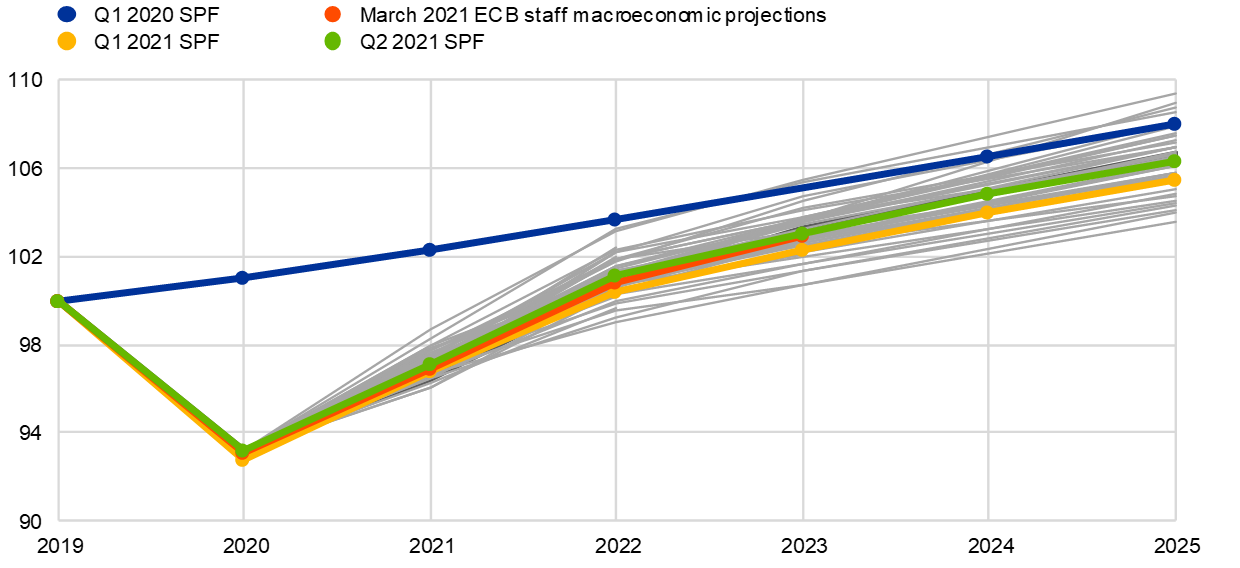
Notes: Growth expectations for years not surveyed have been interpolated linearly. Grey lines denote individual forecaster profiles in the Q2 2021 round.
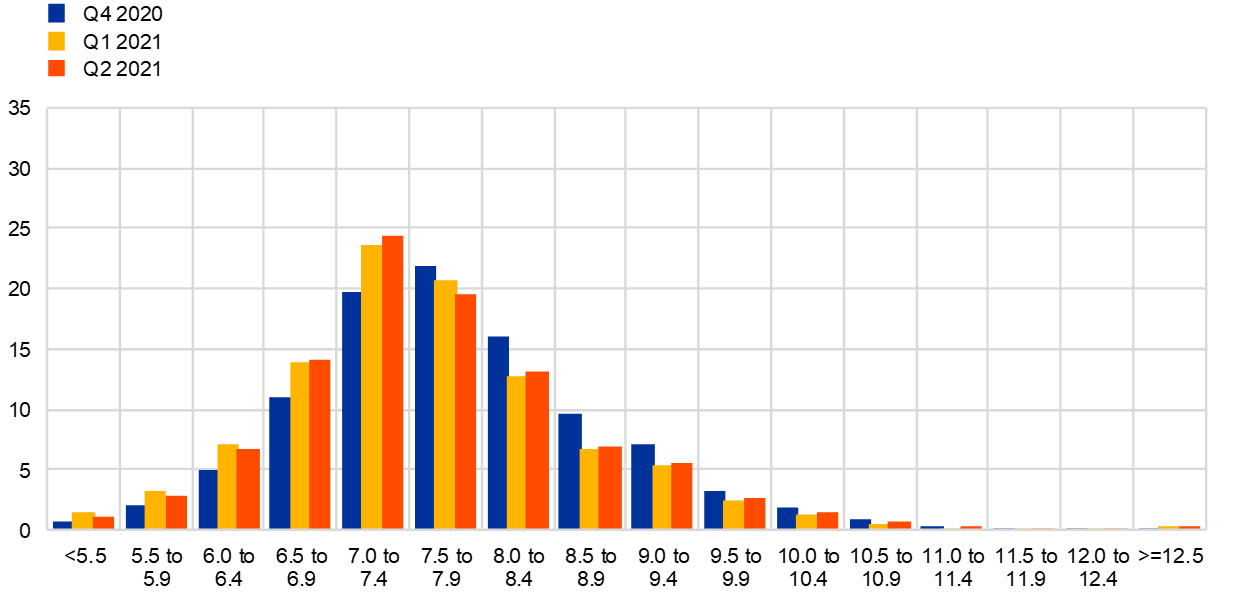
The quantitative measures of uncertainty have increased marginally and remained at high levels, while the balance of risk indicators has stabilised around broadly neutral territory. Uncertainty as measured by the width of the aggregate probability distribution remained higher than before the pandemic but was considerably lower than at its peak in the second and third quarters of 2020. For the shorter-term horizons, this mostly reflected lower disagreement among forecasters about point expectations, whereas for the longer-term horizon, it resulted more from lower individual uncertainty. Chart 9 and Chart 10 present the aggregate probability distributions for GDP growth for the years 2021-23 and in the longer term (2025) respectively. Qualitative comments continued to point to downside risks, with the most cited one being that of a further worsening of the pandemic (including the potential of new and more resistant virus variants emerging) and further delays in the vaccination campaign. A number of respondents particularly expressed doubts that the situation will have normalised by the start of the tourism season, thus expecting the economies in southern Europe to suffer for longer. Upside risks mentioned related mainly to a stronger than assumed materialisation of pent-up consumer demand as the containment measures are gradually lifted.
Chart 9
Aggregate probability distributions for GDP growth expectations for 2021, 2022 and 2023
(x-axis: real GDP growth expectations, annual percentage changes; y-axis: probability, percentages)
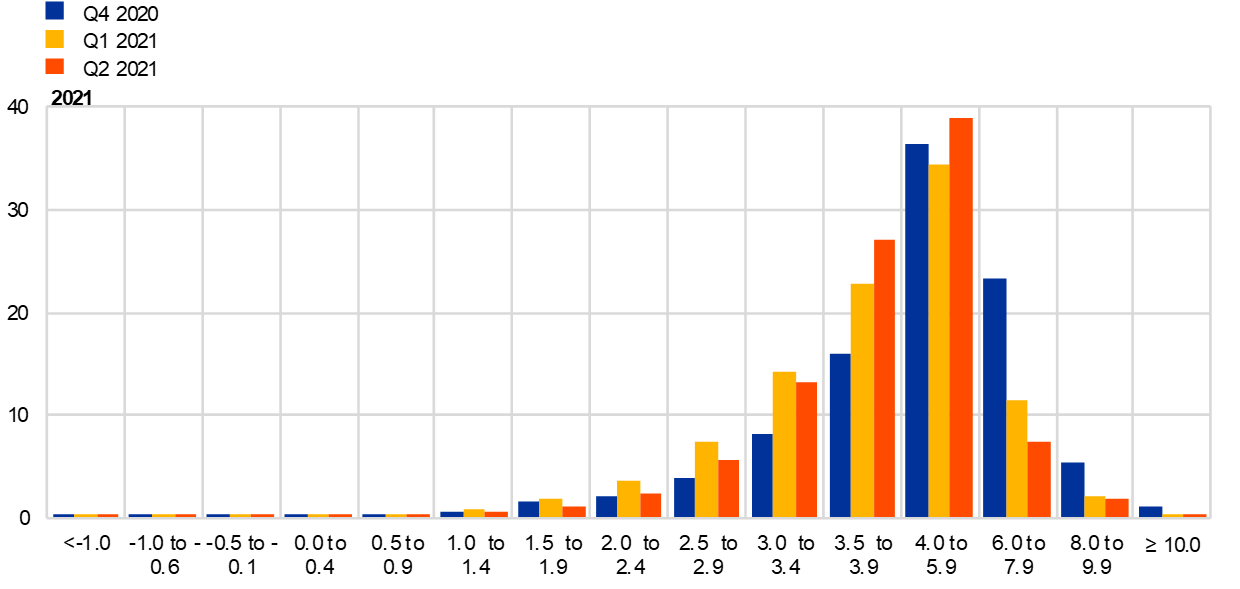
Notes: The SPF asks respondents to report their point forecasts and to separately assign probabilities to different ranges of outcomes. This chart shows the average probabilities they assigned to different ranges of real GDP growth outcomes in 2021, 2022 and 2023. For outcomes above 4%, bins are 2 percentage points wide.
Chart 10
Aggregate probability distribution for longer-term GDP growth expectations
(x-axis: real GDP growth expectations, annual percentage changes; y-axis: probability, percentages)
Notes: The SPF asks respondents to report their point forecasts and to separately assign probabilities to different ranges of outcomes. This chart shows the average probabilities they assigned to different ranges of real GDP growth outcomes in the longer term.
4 Unemployment rate expectations revised downward for 2021-23
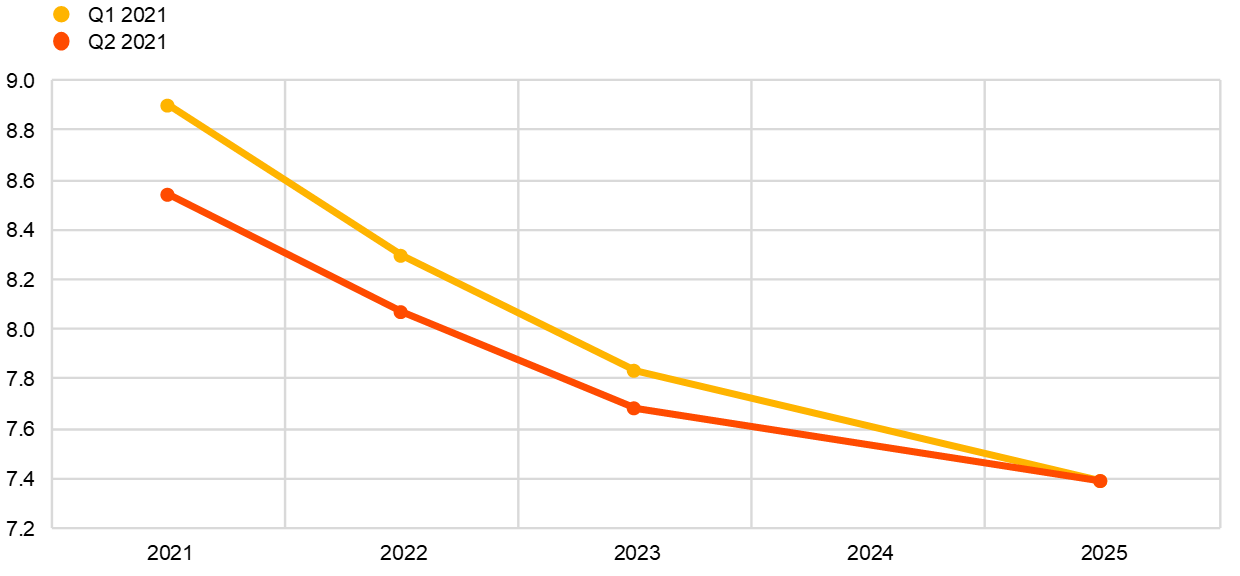
The average point forecasts for the unemployment rate in the round for the second quarter of 2021 were 8.5%, 8.1% and 7.7% for 2021, 2022 and 2023, respectively (see Chart 11). This implies progressively smaller downward revisions, from 0.4 percentage point in 2021 to 0.1 percentage point in 2023. Given the lower starting point and the unchanged long-term unemployment rate expectation of 7.4%, the pace of the expected decline is slightly less steep when compared with the previous round. Respondents attributed the larger downward revision in 2021 to lower realised data at the beginning of the year and the extension of government measures to dampen the effects of the COVID-19 crisis on the labour market. In the medium term, unemployment expectations seemed to depend on the strength of economic growth after the end of fiscal support for job retention schemes. Some forecasters suggested that the reopening of the service sector might ease job market conditions. However, others expected an increase in the participation rate which might result in a higher unemployment rate if labour demand was weak. For the longer term, a few respondents mentioned the risk that part of current unemployment might become structural due to some businesses remaining closed after the crisis.
Chart 11
Expectations for the unemployment rate
(percentages of the labour force)
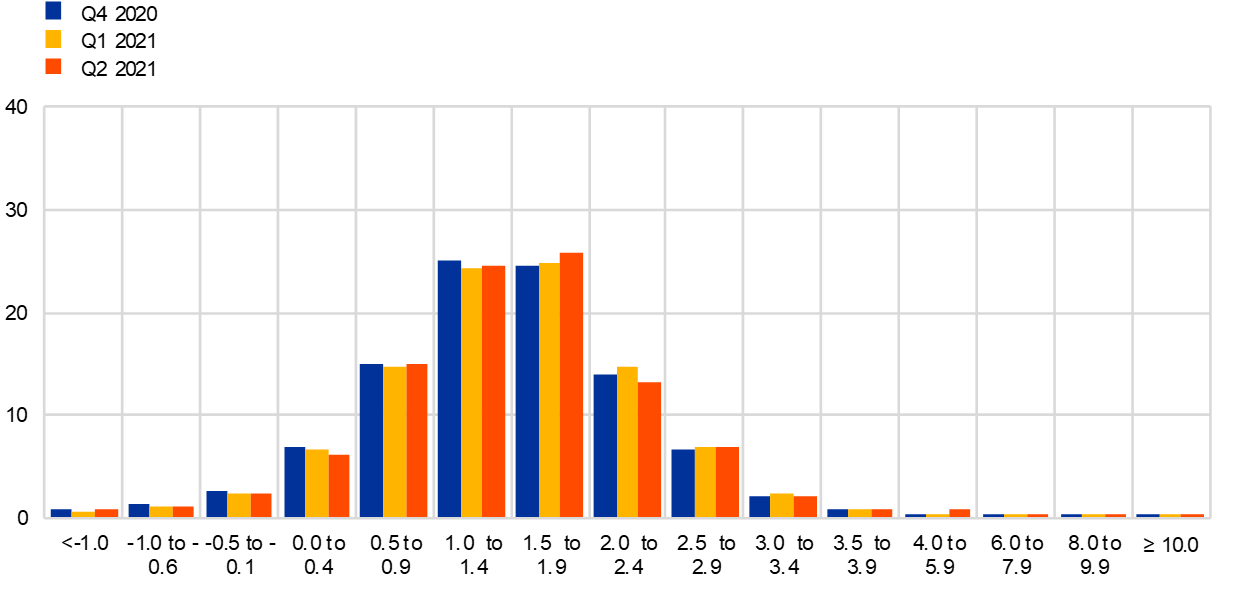
Uncertainty surrounding unemployment rate expectations eased slightly across horizons but still stood at very high levels, while risks remained broadly neutral. Aggregate uncertainty about the expected unemployment rate (as measured by the average width or standard deviations of the aggregated probability distributions) eased slightly further over all horizons from the levels reached during 2020 but remained at historically high levels. The easing was most notable for the shorter-term horizons and mostly reflected lower disagreement but also, to some extent, lower individual uncertainty. On balance, the probability distributions were broadly neutral for the shorter horizons but remained somewhat skewed to the upside for the longer horizon (see Chart 12 and Chart 13).
Chart 12
Aggregate probability distributions for the unemployment rate in 2021, 2022 and 2023
(x-axis: unemployment rate expectations, percentages of the labour force; y-axis: probability, percentages)
Notes: The SPF asks respondents to report their point forecasts and to separately assign probabilities to different ranges of outcomes. This chart shows the average probabilities they assigned to different ranges of unemployment rate outcomes for 2021, 2022 and 2023.
Chart 13
Aggregate probability distribution for the unemployment rate in the longer term
(x-axis: unemployment rate expectations, percentages of the labour force; y-axis: probability, percentages)
Notes: The SPF asks respondents to report their point forecasts and to separately assign probabilities to different ranges of outcomes. This chart shows the average probabilities they assigned to different ranges of unemployment rate outcomes in the longer term.
5 Expectations for other variables
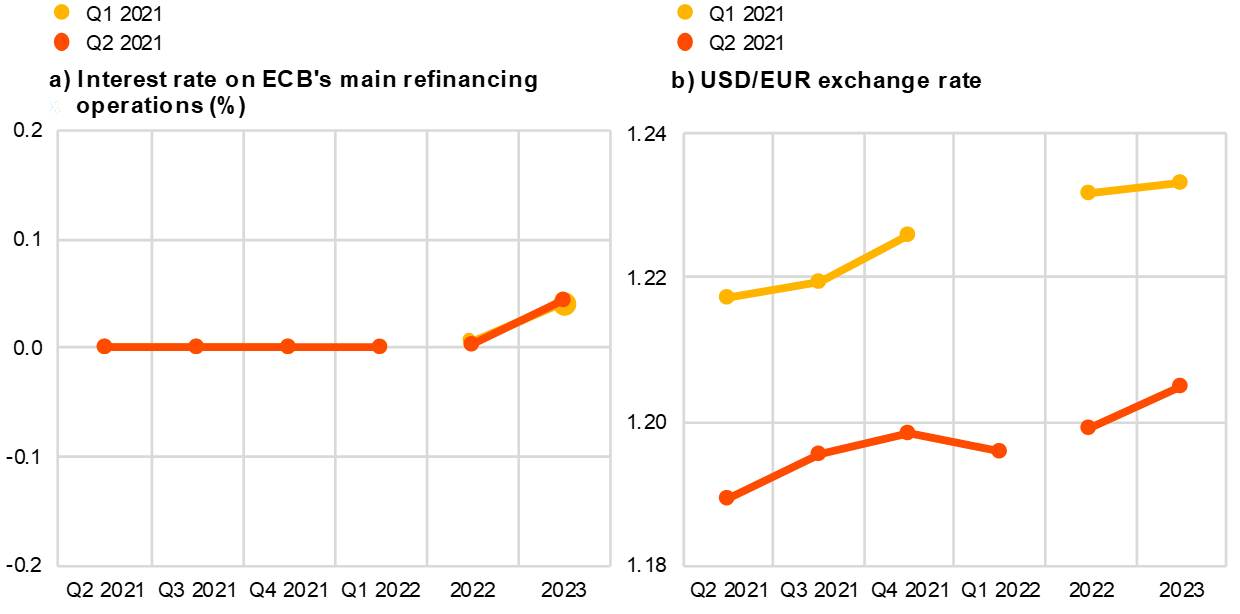
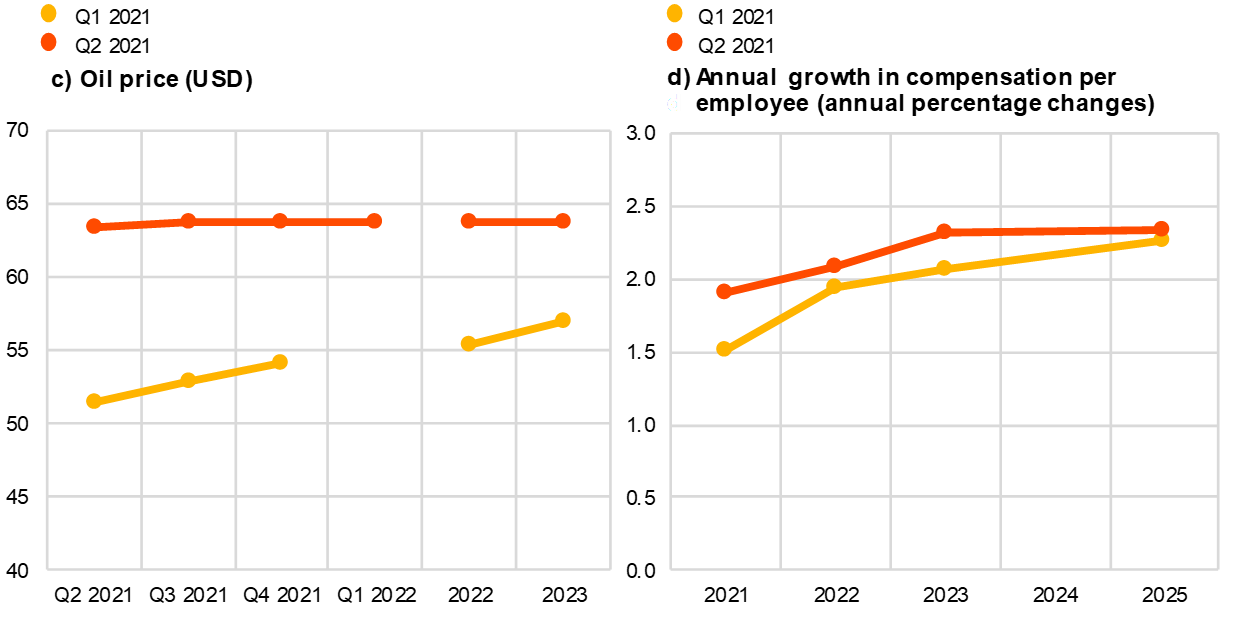
Respondents expected: (i) the ECB’s main policy rates to remain unchanged until at least 2023; (ii) the euro to be largely stable against the dollar at about 1.20 until 2023; (iii) oil prices to remain constant at levels slightly below USD 65 per barrel until 2023; and (iv) nominal wage growth to slightly increase over the whole forecast horizon from around 1.9% in 2021 to 2.3% by 2025.
The median (and majority) expectation for the rate on the ECB’s main refinancing operations was for it to remain at 0% until at least 2023. Overall, interest rate expectations were essentially unchanged from the previous round (see panel (a) of Chart 14).
The average USD/EUR exchange rate was expected to remain broadly constant over the reported period – moving from 1.19 in the second quarter of 2021 to 1.20 in the third quarter of 2021 and thereafter. This profile was slightly lower compared with the previous SPF round (see panel (b) of Chart 14).
Compared with the previous round, the expected level of US dollar-denominated oil prices (per barrel) was revised upward across all horizons (see panel (c) of Chart 14). The price per barrel increased by around USD 11 in 2021, USD 8 in 2022 and USD 7 in 2023, thus, standing at a level slightly below USD 65 per barrel until 2023. Given the expectation for the USD/EUR exchange rate, this implied that the profile for the oil price in euro was somewhat higher (by 13-18%) compared with the previous round.
The profile of the average expectation for the annual growth in compensation per employee was largely unchanged from the previous round and was expected to follow an upward sloping trajectory. Average point forecasts were 1.9% in 2021, 2.0% in 2022, 2.1% in 2023, marginally higher than in the previous round. For 2025, it was expected to be 2.3%, being at the same level as in the previous round – see panel (d) of Chart 14.
Chart 14
Expectations for other variables
6 Annex (chart data)
Excel data for all charts can be downloaded here.
© European Central Bank, 2021
Postal address 60640 Frankfurt am Main, Germany
Telephone +49 69 1344 0
Website www.ecb.europa.eu
All rights reserved. Reproduction for educational and non-commercial purposes is permitted provided that the source is acknowledged.
For specific terminology please refer to the ECB glossary (available in English only).
PDF ISSN 2363-3670, QB-BR-21-002-EN-N
HTML ISSN 2363-3670, QB-BR-21-002-EN-Q
- The survey was conducted between 31 March and 12 April 2021 with 63 responses received. Participants were provided with a common set of the latest available data for annual HICP inflation (March 2021 flash estimates: overall inflation, -1.3%; underlying inflation, 0.9%), annual GDP growth (fourth quarter of 2020, -4.9%) and unemployment (February 2021, 8.3%).