
The ECB Survey of Professional Forecasters (SPF) - Fourth quarter of 2019
Summary
The latest ECB Survey of Professional Forecasters (SPF) implies a more pessimistic outlook for inflation, growth and unemployment. The results for the fourth quarter of 2019 show HICP inflation expectations of 1.2% for 2019 and 2020 and 1.4% for 2021.[1] This represents a further downward revision of 0.1 percentage points on average for each horizon relative to the previous survey. Longer-term inflation expectations remained at 1.7%. Real GDP growth expectations were also revised down, notably for 2020, and now stand at 1.1%, 1.0%, and 1.3% for 2019, 2020 and 2021, respectively. However, they remained unchanged at 1.4% for the longer term. Unemployment rate expectations were revised upwards for horizons from 2020 and ahead, and point to a longer-term rate of 7.4%.
Table 1
Results of the SPF in comparison with other expectations and projections
(annual percentage changes, unless otherwise indicated)
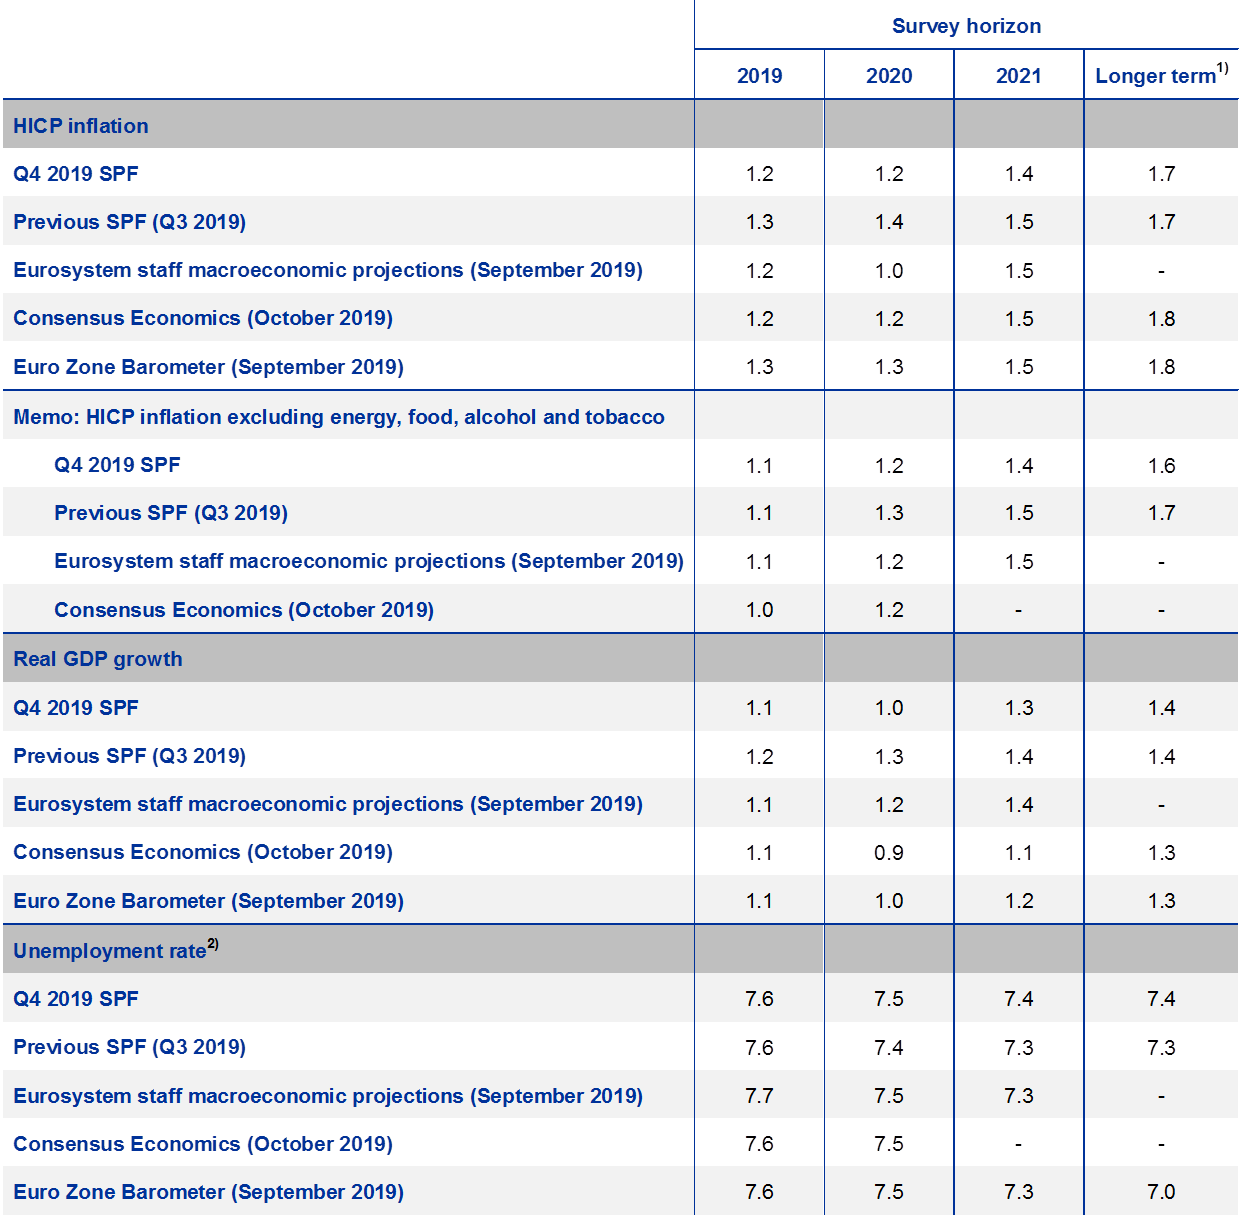
1) Longer-term expectations refer to 2024 in the SPF and Consensus Economics and to 2023 in the Eurozone Barometer. Eurozone Barometer longer-term expectations are from the July 2019 survey.
2) As a percentage of the labour force.
1 Inflation expectations revised down for the period 2019-21
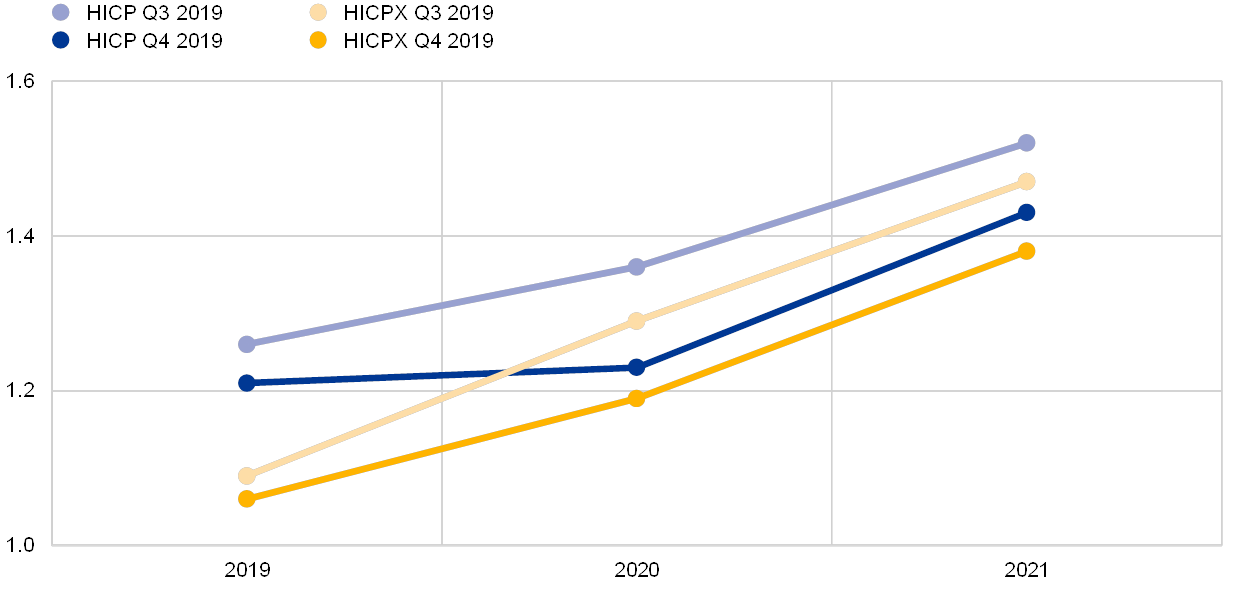
HICP inflation expectations for 2019, 2020 and 2021 were revised down to stand at 1.2%, 1.2% and 1.4%, respectively (see Chart 1). These results represent average downward revisions of 0.1 percentage points (p.p.) for each year surveyed, following similarly sized downward revisions across these horizons in the surveys conducted for the first three quarters of 2019. In respondents’ qualitative comments, the downward revisions were mainly attributed to lower oil prices, to actual inflation outturns being lower than anticipated and to the worsened economic outlook. With regard to the ECB’s September monetary policy package, SPF respondents, on average, reported that it had a small net positive impact on their inflation and growth expectations, although the precise magnitude is difficult to assess. The upward profile of expected inflation is similar to forecasts published in other surveys, albeit at a slightly lower level (see Table 1).
Average expectations for inflation excluding energy, food, alcohol and tobacco (HICPX) stood at 1.1%, 1.2% and 1.4% for 2019, 2020 and 2021, respectively. This represents downward revisions of 0.1 p.p. for 2020 and 2021 (see Chart 1).
Chart 1
Inflation expectations: overall HICP and HICP excluding energy, food, alcohol and tobacco
(annual percentage changes)
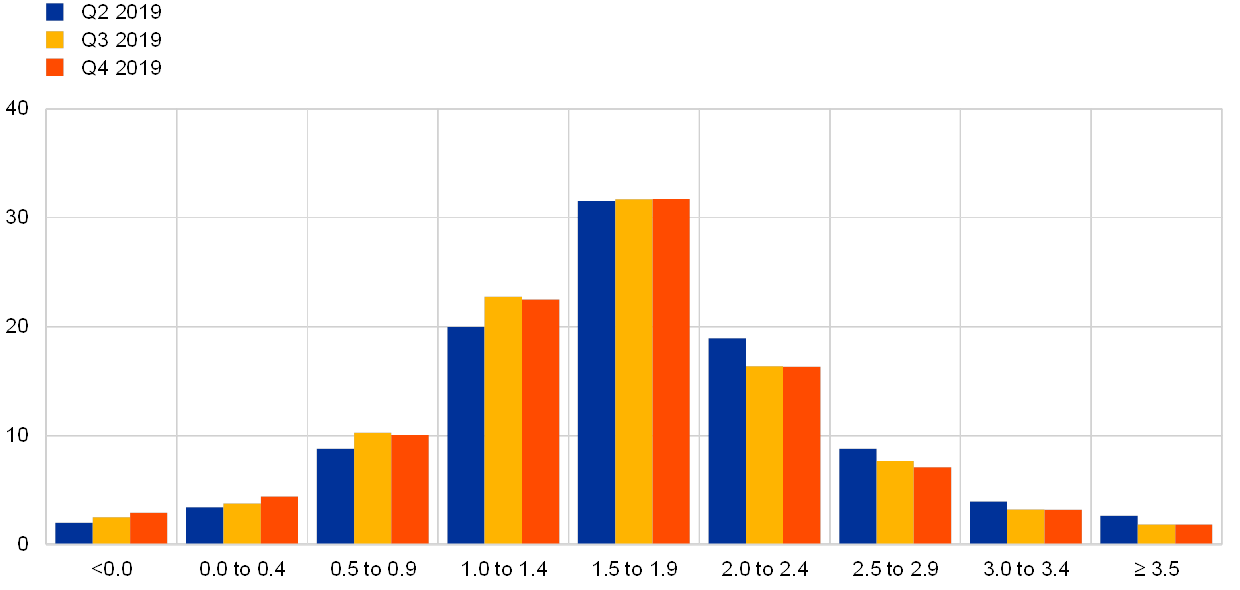
The balance of risks remained to the downside, although less than before, perhaps owing to some of the previous downside risks having been incorporated into a lower baseline forecast. With the exception of 2019, the aggregate probability distributions shifted further to the left, largely mirroring the reductions in the point forecasts (see Chart 2).
Chart 2
Aggregate expected probability distributions for inflation in 2019, 2020 and 2021
(x-axis: HICP inflation expectations, annual percentage changes; y-axis: probability, percentages)
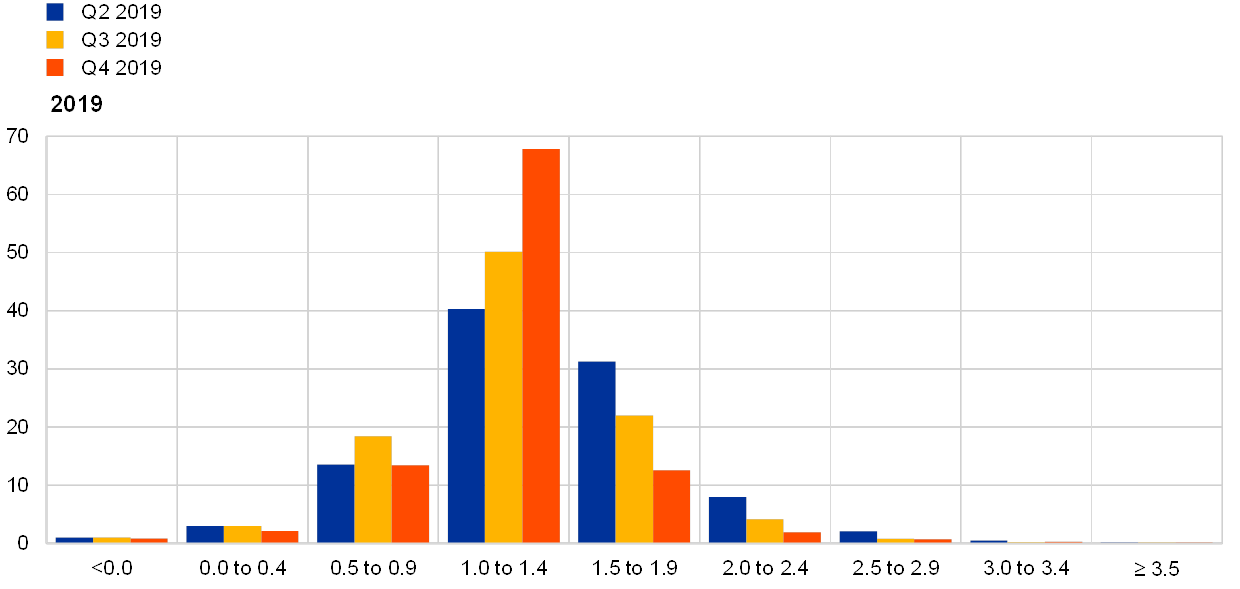
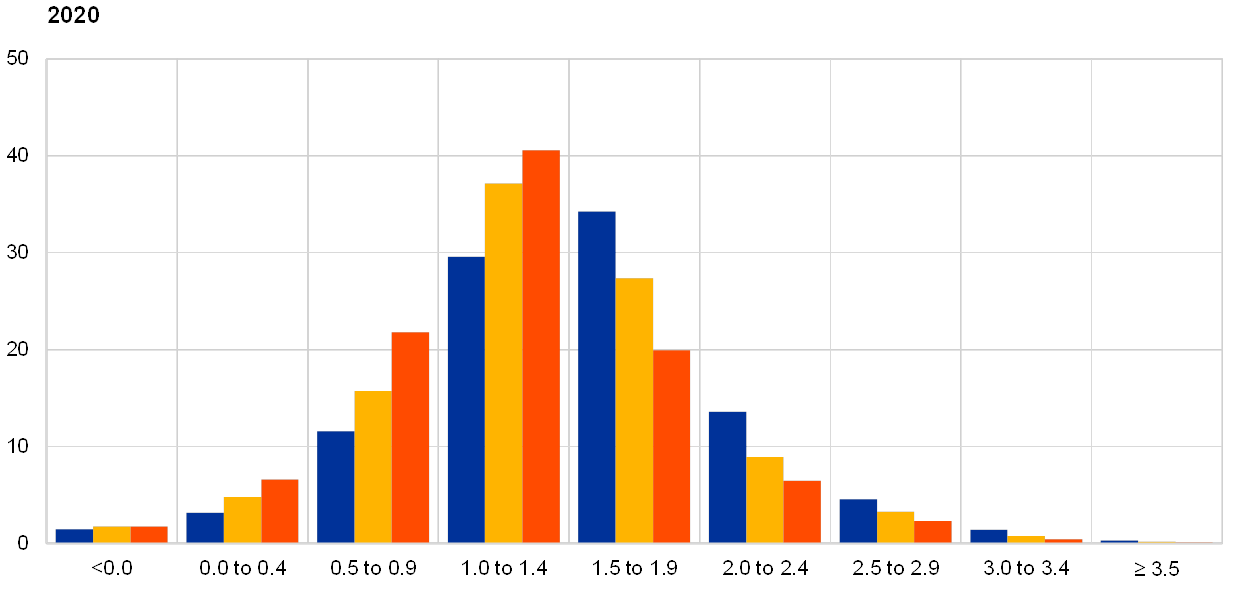
Note: The SPF asks respondents to report their point forecasts and to separately assign probabilities to different ranges of outcomes. This chart shows the average probabilities they assigned to inflation outcomes in 2019, 2020 and 2021.
In general, the average width of forecasters’ probability distributions remained around their elevated post-global financial crisis averages. However, the balance of risks narrowed. In their qualitative comments, some respondents explained that they saw the risks to the downside, citing both the risk that the euro area economy will grow more slowly than expected and the risk that the external environment will prove more disinflationary than at present in their baseline forecasts. Other risks cited were oil prices (both to the upside and downside) and labour cost developments (mainly to the upside in terms of either higher outcomes or more pass-through to prices).
2 Longer-term inflation expectations remain at 1.7%
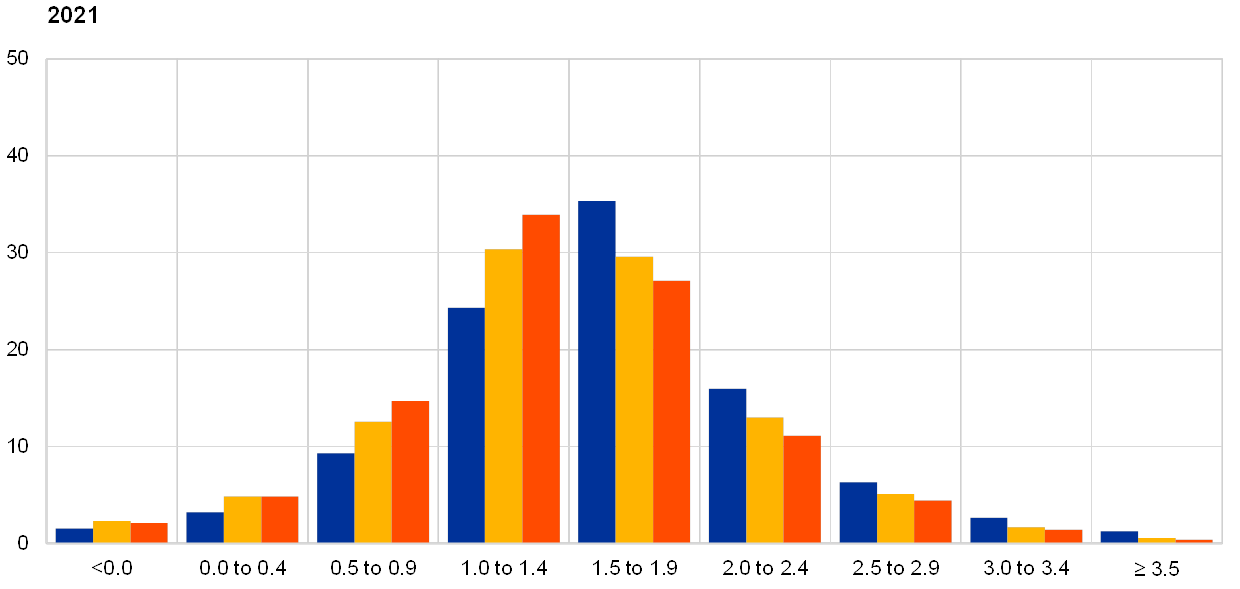
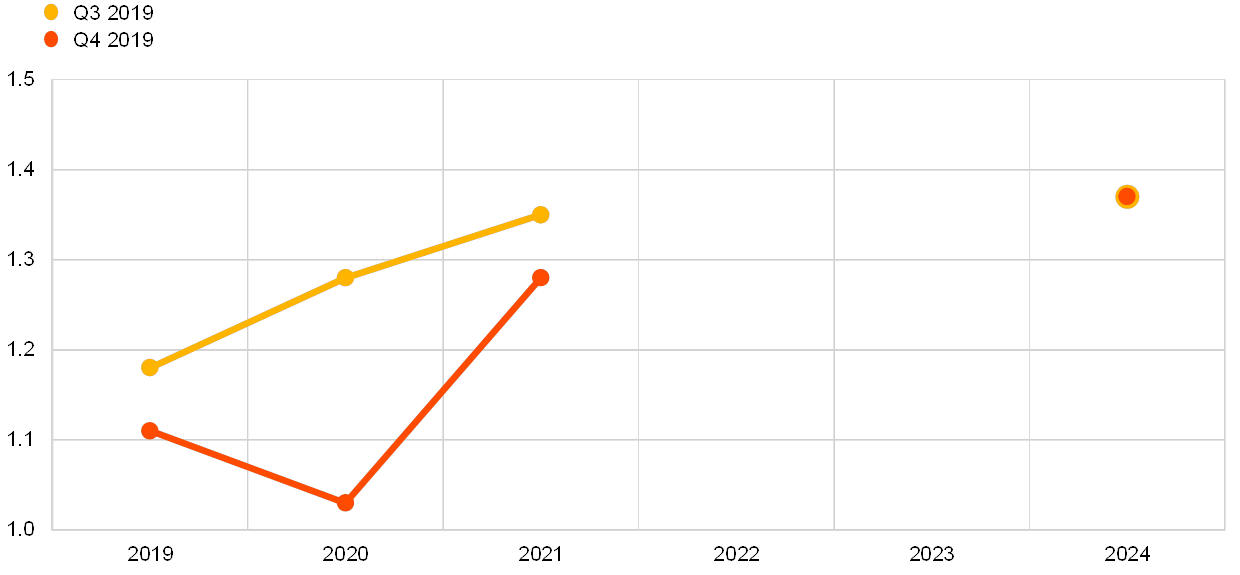
The average point forecast for inflation in the longer term (2024) is unchanged at 1.7%. The median point forecast also stood at 1.7% and the mean of the aggregate probability distribution was 1.6%, (see Chart 3). In the 2019 rounds there has been a noticeable shift in the distribution of individual point forecasts (see Chart 4) from the pattern observed for most of the previous 20 years. Historically, the frequency distribution of individual point forecasts for longer-term inflation has been concentrated in a tight range (1.8%-2.0% up to 2014 and slightly wider, 1.7%-2.0%, from 2014-18) with the modal forecast being 2.0%. The distribution also tended to be truncated at the lower and upper ends of these ranges (i.e. very few forecasters provided point forecasts below the lower end or above the upper end of these ranges). In the 2019 rounds there has been a sharp fall in the portion of forecasters expecting 2.0% and an increase in the number of forecasters reporting 1.6%, 1.5% and 1.4%. On average, in 2019 43% of SPF respondents reported longer-term inflation expectations of 1.7% or lower compared with the average of 17% over the period from the first quarter of 1999 to the first quarter of 2014. Longer-term expectations for HICP inflation excluding energy, food, alcohol and tobacco were revised down by 0.1 p.p. to 1.6%.
Chart 3
Longer-term inflation expectations
(annual percentage changes)
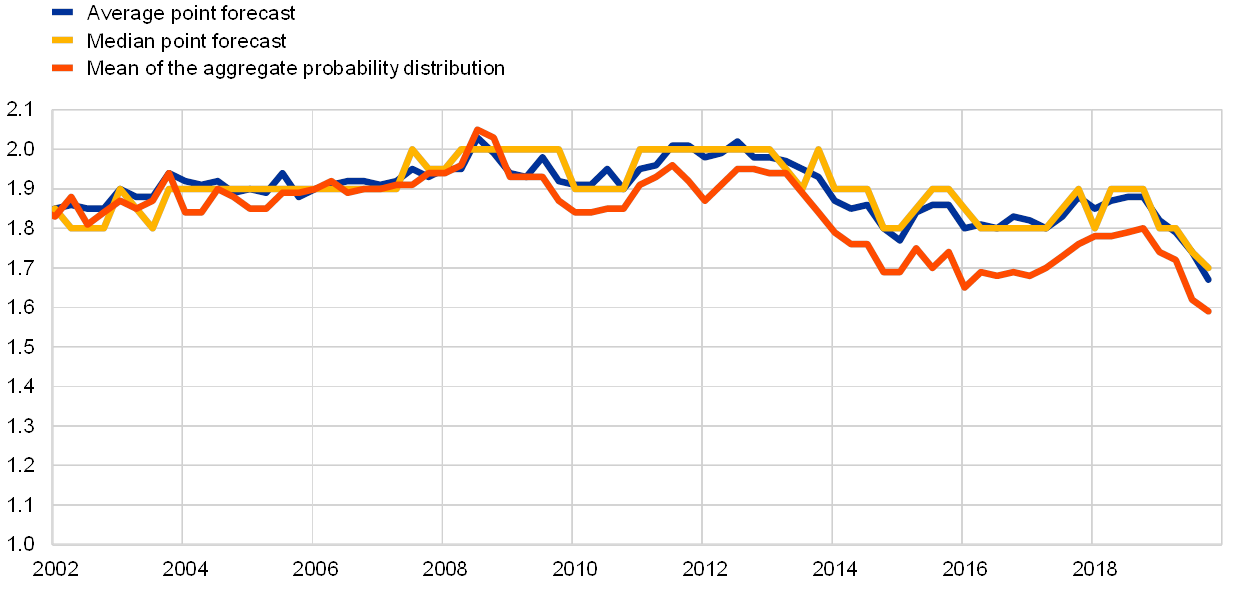
Chart 4
Distribution of point expectations for HICP inflation in the longer term
(x-axis: HICP longer-term inflation expectations, annual percentage changes; y-axis: percentages of respondents)

Notes: The SPF asks respondents to report their point forecasts and to separately assign probabilities to different ranges of outcomes. This chart shows the spread of point forecast responses.
Perceptions of overall uncertainty surrounding longer-term expectations remained high and the balance of risks remained to the downside, albeit to a lesser degree. In 2018 the width of forecasters’ probability distributions for inflation in the longer term ticked up from the level around which it had fluctuated for most of the post-global financial crisis period. This has continued to remain high in the 2019 rounds, indicating ongoing elevated uncertainty. The balance of risks remained to the downside, as has been the case for most of the period since the global financial crisis. This measure has recovered somewhat from the lows seen over the 2016-17 period and the reduction could reflect the fact that forecasters have incorporated some of their previous downside risks into their baseline forecasts (see Chart 5).
Chart 5
Aggregate probability distribution of longer-term inflation expectations
(x-axis: HICP inflation expectations, annual percentage changes; y-axis: probability, percentages)
Notes: The SPF asks respondents to report their point forecasts and to separately assign probabilities to different ranges of outcomes. This chart shows the average probabilities they assigned to inflation outcomes in the longer term.
3 Real GDP growth expectations revised down, particularly for 2020
SPF respondents have revised down their real GDP growth forecasts, in particular for 2020, and now forecast real GDP growth of 1.1% for 2019, 1.0% for 2020 and at 1.3% for 2021 (see Chart 6). These expectations imply downward revisions of 0.1 p.p. for both 2019 and 2021 and a significantly larger downward revision of 0.3 p.p. for 2020. Longer-term growth expectations (which refer to 2024) remained at 1.4%. Most respondents who had also replied in the previous round revised down their forecasts for 2019-21. These respondents attributed their revisions to weak economic data and the persistence of uncertainty related to Brexit and foreign trade in general. Some respondents mentioned that their baseline scenarios factor in some stimulus from fiscal loosening, on top of the small expected effect of the ECB’s recent monetary policy measures. The latest SPF results are broadly in line with those published in other surveys across horizons (see Table 1).
Chart 6
Expectations for real GDP growth
(annual percentage changes)
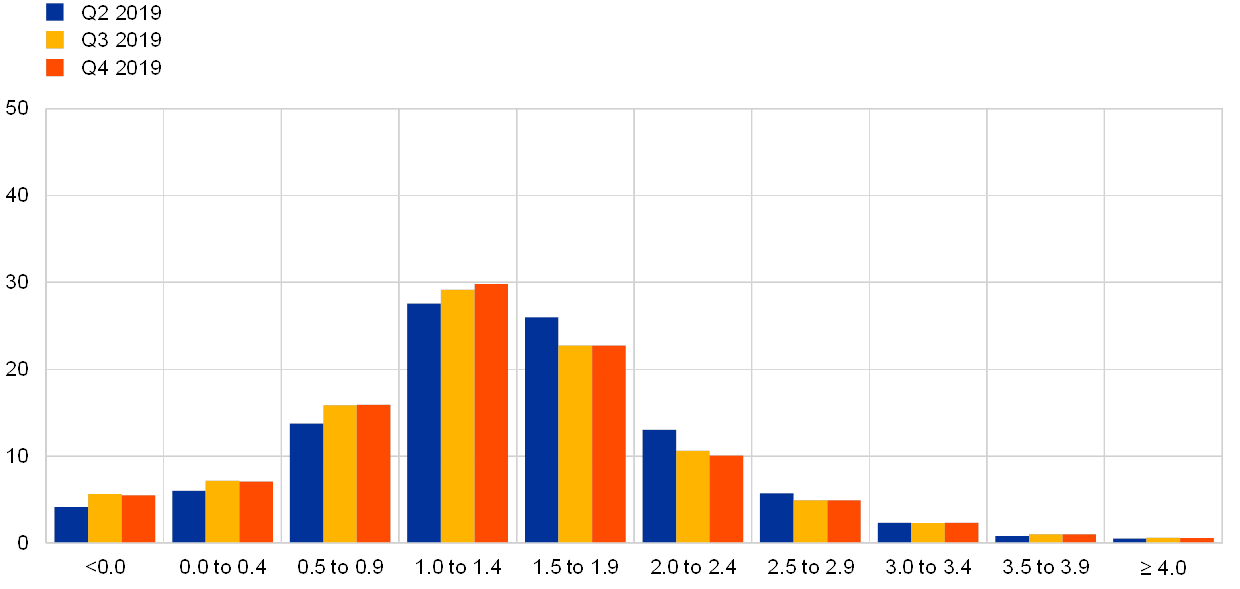
In line with the downward revisions to point forecasts, the aggregate probability distributions also shifted towards lower values. Nonetheless, at all horizons, respondents continued to assign the highest likelihood to outcomes between 1.0% and 1.4%. However, for 2020 and 2021 there was a noticeable increase in the probabilities associated with outcomes between 0.4% and 0.9% (see Chart 7). There was no substantive change in the longer term distribution (see Chart 8).
Chart 7
Aggregate probability distributions for GDP growth expectations for 2019, 2020 and 2021
(x-axis: real GDP growth expectations, annual percentage changes; y-axis: probability, percentages)
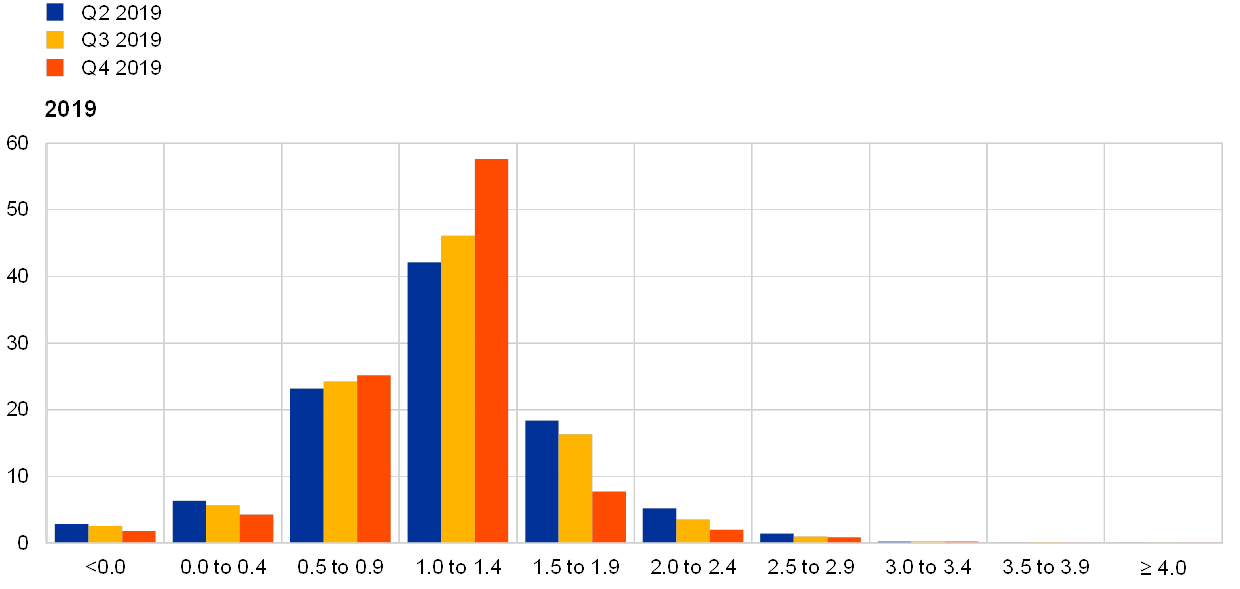
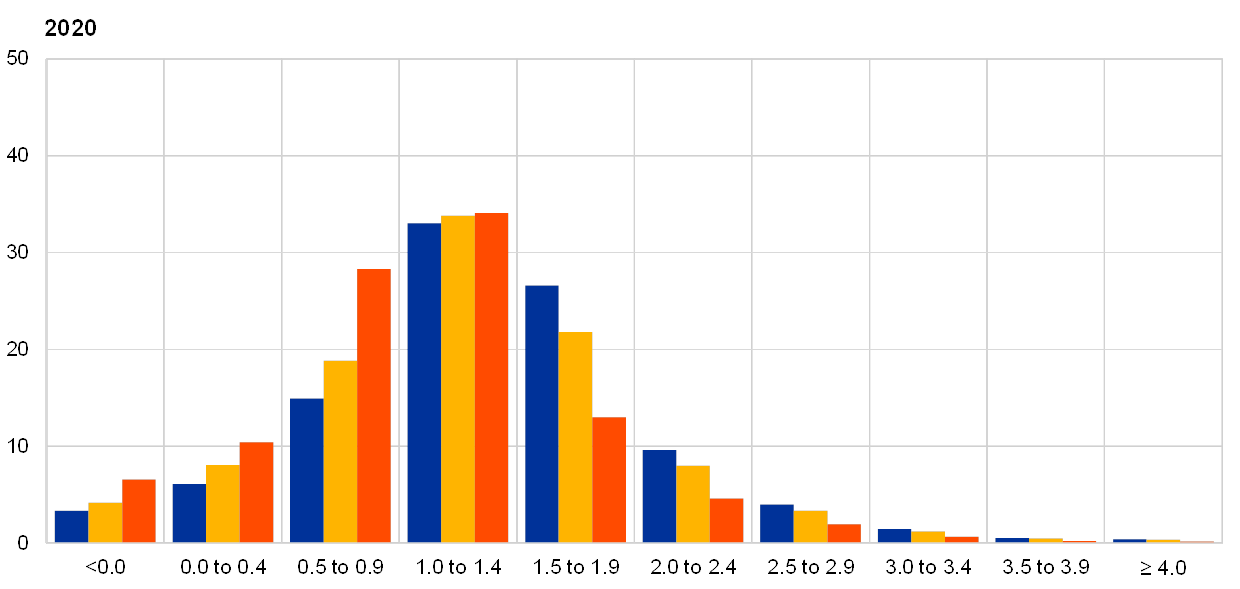
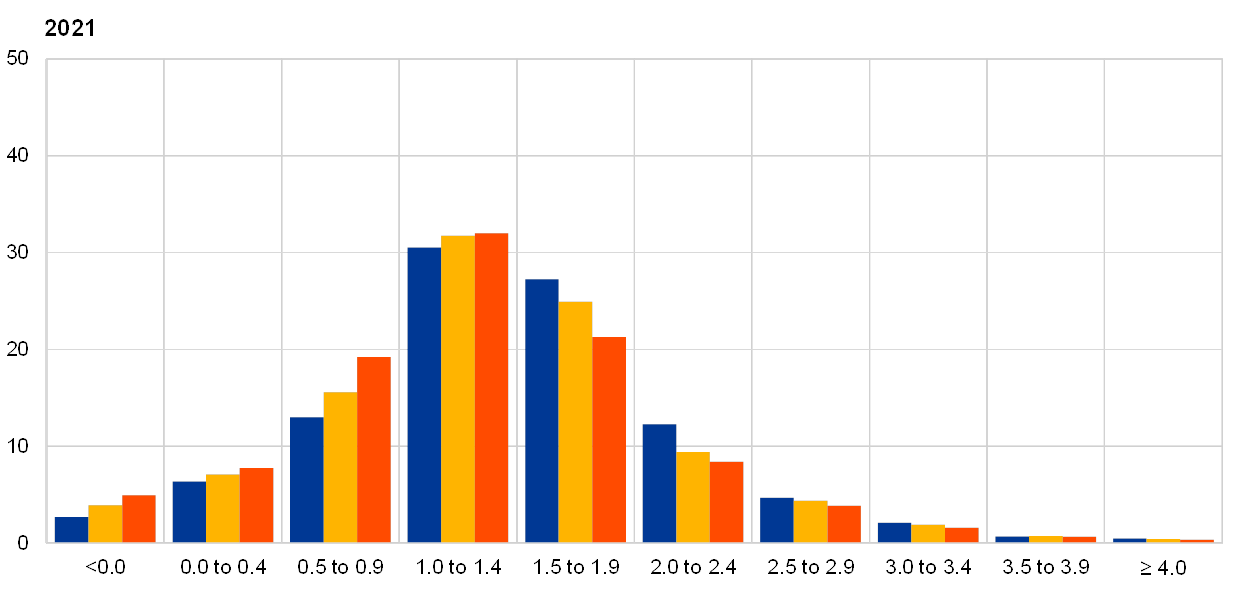
Notes: The SPF asks respondents to report their point forecasts and to separately assign probabilities to different ranges of outcomes. This chart shows the average probabilities they assigned to real GDP growth outcomes in 2019, 2020 and 2021.
The balance of risks to real GDP growth forecasts remained slightly to the downside. Like for inflation, the moderation of the elevated downside risks reported in 2016 has occurred in the context of reducing baseline forecasts. Probabilities of low growth (e.g. less than 1.0%) have risen sharply over the latest three rounds. The risk assessment of the respondents based on their qualitative comments remained very similar to the previous survey and was, on balance, tilted to the downside. Many of the risks stem from external factors. The impact of a further escalation of the trade conflict between the United States and China and a possible increase of tariffs on car imports from the European Union continued to be the most cited downside risks. In addition, many respondents referred to risks related to a no-deal Brexit. Other downside risks mentioned included a stronger than expected weakening of the external environment, in particular owing to China, and the conflict in the Persian Gulf. On the domestic side, some respondents saw a risk of a continued weakness of the automotive industry and a risk of the current weakness in the European manufacturing sector spilling over to domestic demand, which has, so far, been more resilient. On the upside, some forecasters mentioned higher activity in the event of fiscal stimulus in the euro area. A few forecasters mentioned upside risks including an early resolution of the trade conflicts and an orderly Brexit.
Chart 8
Aggregate probability distribution for longer-term GDP growth expectations
(x-axis: real GDP growth expectations, annual percentage changes; y-axis: probability, percentages)
Note: The SPF asks respondents to report their point forecasts and to separately assign probabilities to different ranges of outcomes. This chart shows the average probabilities they assigned to real GDP growth outcomes in the longer term.
4 Unemployment rate expectations revised up
The average point forecasts for the unemployment rate were revised upwards for the horizons after 2019 (see Chart 9). For 2019 expectations are unchanged at 7.6%. For 2020, 2021 and the longer term they were revised up by 0.1 p.p. to stand at 7.5%, 7.4% and 7.4%, respectively. More than one-third of the panellists who also participated in the previous survey round have revised up their unemployment forecasts for 2020 and the years further ahead, driven mainly by expectations of a further deterioration of the business cycle. In addition, some saw upward risks, particularly from spillovers from the weakness in the manufacturing sector to the broader economy and the labour market.
Chart 9
Expectations for the unemployment rate
(percentages of the labour force)
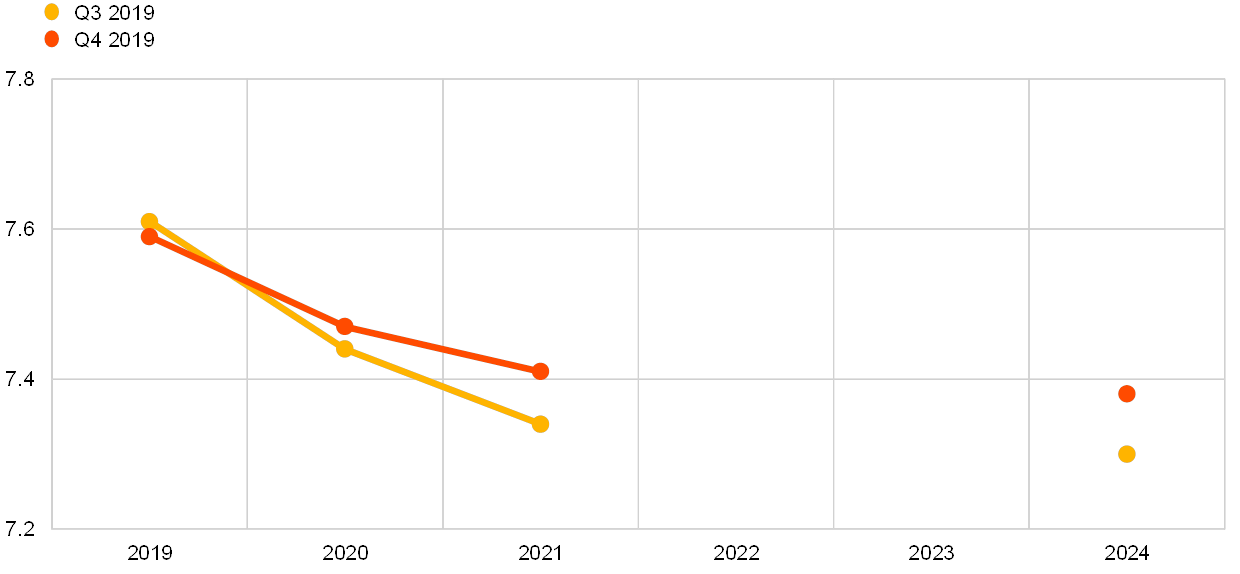
Longer-term unemployment rate expectations remained unusually uncertain and the balance of risks are perceived to be to the upside. As with other variables (across horizons), forecasters’ uncertainty about the unemployment rate in the future, as measured by the average width (standard deviations) of the reported probability distributions, has been greater after the financial crisis than it was before. However, uncertainty around unemployment rate expectations had increased further in 2018 and largely remained elevated in the latest survey such that, for longer-term expectations, this measure stood at levels significantly higher than those previously seen. Across horizons, the probability distributions remained skewed towards higher unemployment rate outcomes, indicating that the balance of risks is perceived to be to the upside (see Chart 10 and Chart 11).
Chart 10
Aggregate probability distributions for the unemployment rate in 2019, 2020 and 2021
(x-axis: unemployment rate expectations, percentages of the labour force; y-axis: probability, percentages)

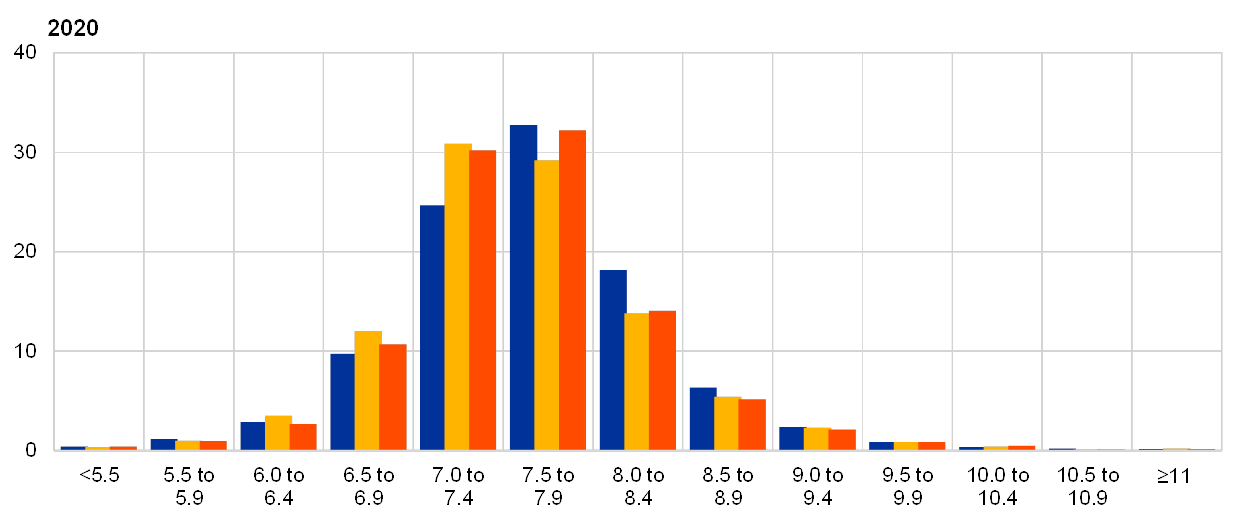
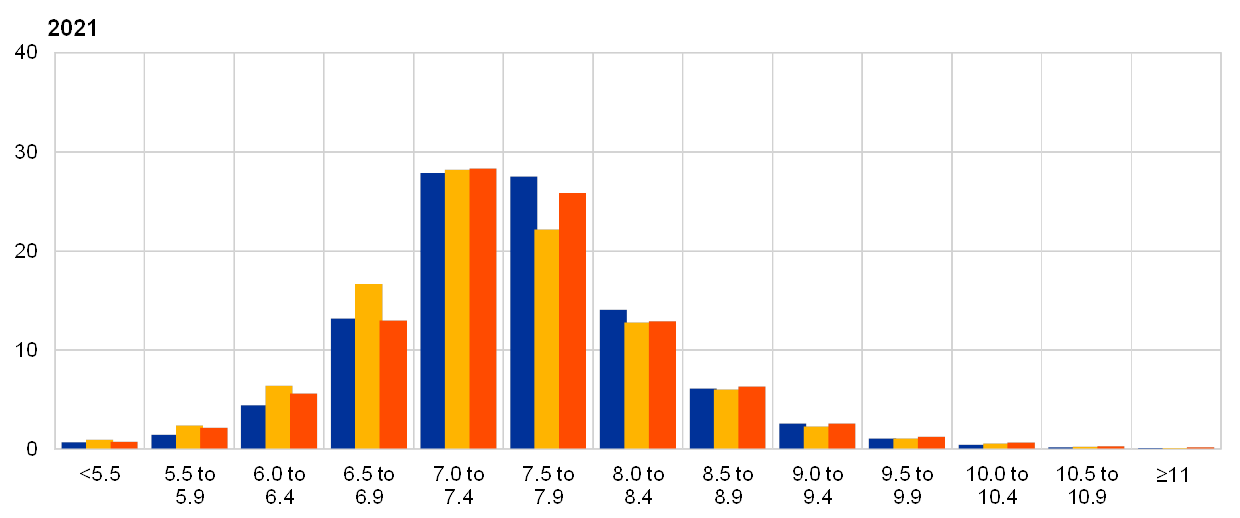
Notes: The SPF asks respondents to report their point forecasts and to separately assign probabilities to different ranges of outcomes. This chart shows the average probabilities they assigned to unemployment rate outcomes for 2019, 2020 and 2021.
Chart 11
Aggregate probability distribution for the unemployment rate in the longer term
(x-axis: unemployment rate expectations, percentages of the labour force; y-axis: probability, percentages)
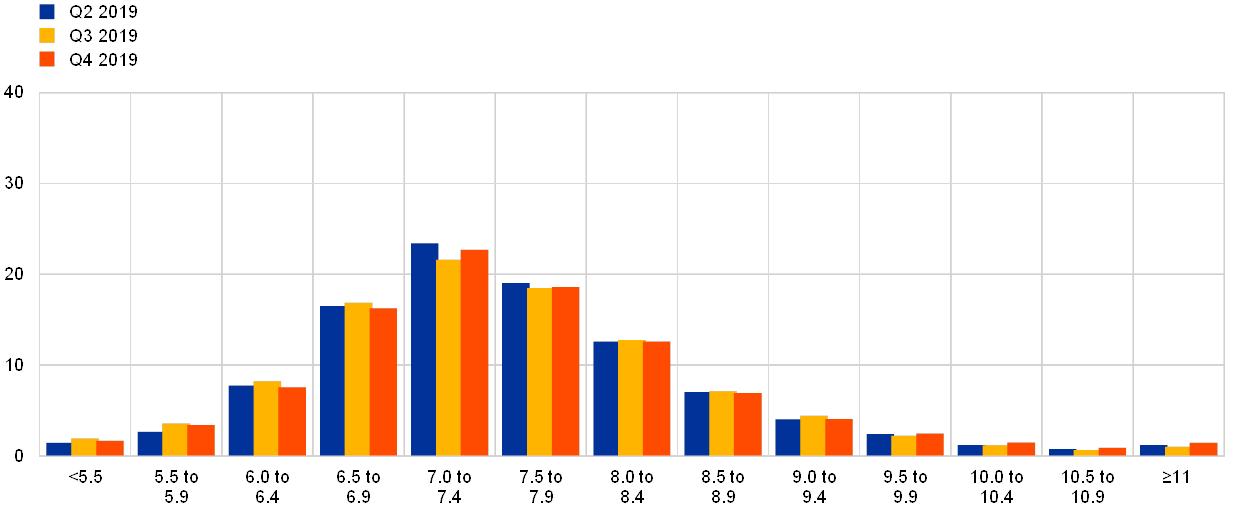
Notes: The SPF asks respondents to report their point forecasts and to separately assign probabilities to different ranges of outcomes. This chart shows the average probabilities they assigned to unemployment rate outcomes in the longer term.
5 Expectations for other variables
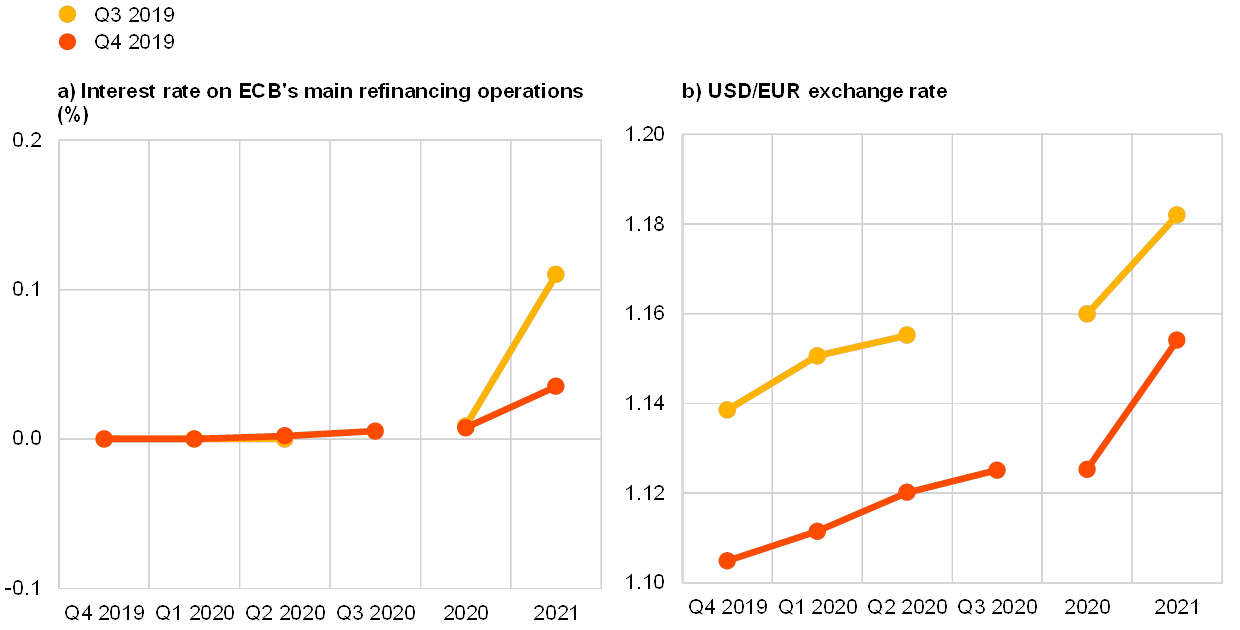
Respondents’ average expectations were for: USD oil prices to remain broadly unchanged until 2021; the euro to appreciate against the dollar until 2021; the ECB’s main refinancing rate to start lifting slightly off the zero lower bound in 2021; and wage growth to take a decreasing path in 2019 and stay on it over the entire forecast horizon.
The mean expectation for the rate on the ECB’s main refinancing operations was for it to remain around 0% in the near term and to increase marginally to 0.04% in 2021. This implies that the aggregate expectation for the near-term, quarterly profile remains unchanged, while the expected policy rate for 2021 is revised down slightly from the previous round (see panel (a) of Chart 12).
The average expected USD/EUR exchange rate decreased at all horizons by around 3%, but from this lower starting point the expected pace of appreciation has increased somewhat (see panel (b) in Chart 12).
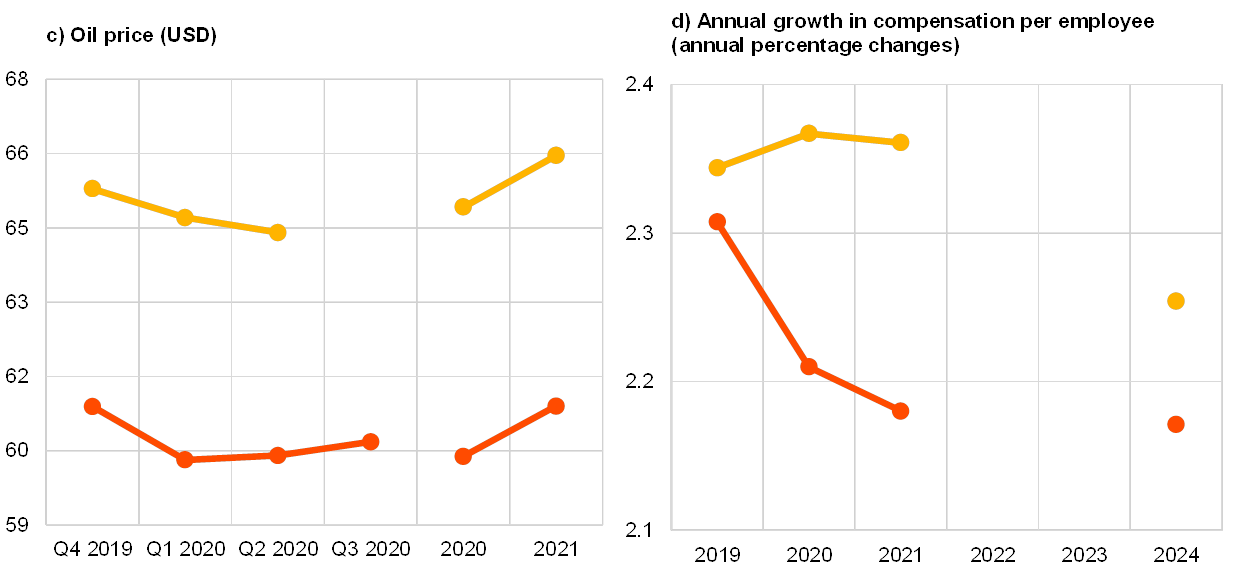
US dollar-denominated oil prices (per barrel) were expected to remain broadly stable at around USD 60 over the period 2020-21. This implies that forecasters now expect prices to be between 6.7% and 7.8% lower at all horizons than they had expected in the previous survey (see panel (c) of Chart 12). When combined with expectations of a slight weakening – around 3% – in the USD/EUR exchange rate, these results imply a profile for the oil price in euro that is around 4.5% lower than in the previous survey.
On average, expected annual growth in compensation per employee was 2.3% for 2019 and 2.2% for 2020, 2021 and 2024. This represents a downward revision at all horizons when compared with the previous survey and growth in compensation per employee is now expected to follow a very gradual downward sloping profile (see panel (d) of Chart 12).
Chart 12
Expectations for other variables
6 Annex (chart data)
Excel data for all charts can be downloaded here.
© European Central Bank, 2019
Postal address 60640 Frankfurt am Main, Germany
Telephone +49 69 1344 0
Website www.ecb.europa.eu
All rights reserved. Reproduction for educational and non-commercial purposes is permitted provided that the source is acknowledged.
For specific terminology please refer to the ECB glossary (available in English only).
PDF ISSN 2363-3670, QB-BR-19-004-EN-N
HTML ISSN 2363-3670, QB-BR-19-004-EN-Q
- The survey was conducted between 1 and 7 October 2019; 53 responses were received. Participants were provided with a common set of the latest available data for annual HICP inflation (September 2019 flash estimates: all items, 0.9%; excluding energy, food, alcohol and tobacco, 1.0%), annual GDP growth (Q2 2019, 1.2%) and the unemployment rate (August 2019, 7.4%).
-
25 October 2019