
Price and wage-setting in advanced Economies: takeaways from the ECB’s 2018 Sintra Forum
Price and wage-setting in advanced Economies: takeaways from the ECB’s 2018 Sintra Forum
Abstract
The origins and implications of the low inflation dynamics that characterised the post-crisis recoveries in many advanced economies were at the heart of the European Central Bank’s 2018 Forum on Central Banking, held in Sintra, Portugal. In this article, two of the organisers highlight some of the main points from the discussions, including why measured economic slack did not translate into more vivid price and wage growth, which role inflation expectations play in the conduct of monetary policy as well as where the challenges lie in reconciling changes in firms’ micro price-setting with aggregate inflation dynamics.
This year’s ECB Forum on Central Banking focused on the core issue for monetary policy of why inflation accelerated so moderately in the recoveries that followed the crises in advanced economies. Policymakers, academics and market economists debated price and wage-setting from both macroeconomic and microeconomic perspectives. In this article we summarise four of the main themes that were keenly debated in Sintra in June 2018: explanations as to why the Phillips curve has flattened and its implications; the sources and implications of low real wage growth; central bank communication with respect to inflation expectations; and key challenges in reconciling changes in micro price-setting behaviour with macroeconomic inflation developments. The full set of papers, discussions and speeches as well as video recordings of all sessions can be found on the Sintra Forum website.
1 Slack and the flat Phillips curve: international factors, regime switches, slow adjustment or mismeasurement?
The vanishing slope of the Phillips curve over the last few decades raises major questions about how the low-inflation phenomenon should be understood (see the previous discussion on this at the 2015 Sintra Forum; Constâncio et al. 2015). Put another way, the empirical relationship between economic slack and wage and price developments seems to have weakened considerably in many advanced economies. Participants put forward many arguments that could explain why the Phillips curve is flat.
In the opening paper, Jim Stock and Mark Watson (2018) argue that mismeasurement of inflation may be one culprit. Once price index components that do not react to the business cycle (or that are badly measured) as well as trends are taken out, the negative relationship between different measures of slack and the resulting indicator of “cyclically sensitive inflation” (CSI) in the United States remains stable and statistically significant over the last few decades. Chart 1 shows that the CSI indicator estimated by Stock and Watson for the euro area (black solid line) increased only very gradually in the last few years (see ECB 2014 for a similar methodology). This would suggest that the observed low inflation in the euro area is not a measurement artefact. In contrast to the US CSI, it is also quite close to the Harmonised Index of Consumer Prices (HICP) excluding energy and food (dashed blue line), a more standard measure of “core inflation” (which takes the most volatile components out of the index).
Chart 1
Different inflation measures for the euro area
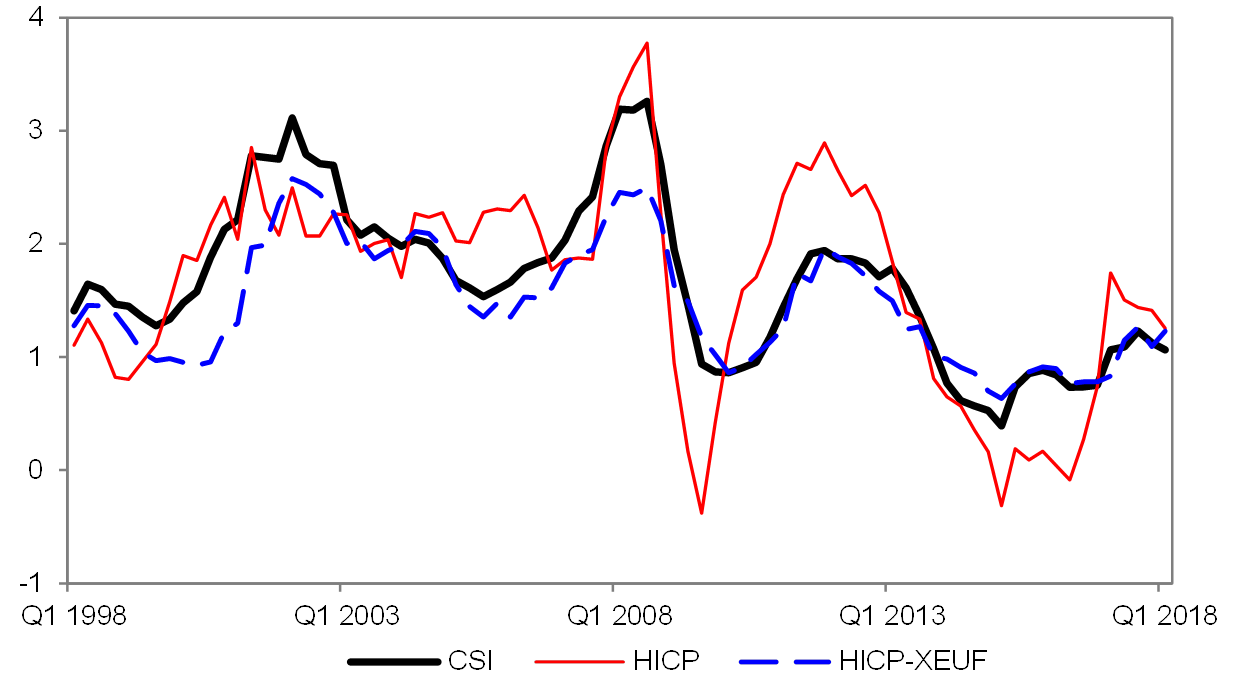
Source: Reproduced from Stock and Watson (2018), Chart 4.4.
Note: CSI is the cyclically adjusted inflation measure estimated by Stock and Watson (2018), HICP is the Harmonised Index of Consumer Prices and HICPexEUF is the HICP excluding energy and food.
Based on a different approach, namely estimating cyclical components and trends of US and euro area inflation together (rather than cleaning the data of the latter; see Hasenzagl et al. 2018), the discussant, Lucrezia Reichlin (2018), agrees with Stock and Watson that the Phillips curve can be re-established. But it tends to constitute a relatively small part of the inflation process as opposed to a dominating trend (plus cyclical effects of global commodity prices). Moreover, her trend-cycle approach shows greater upward pressure on inflation in both the United States and the euro area in recent years compared with the CSI. Another reason for the different results could be that the CSI is based on only a small number of sufficiently cyclical price index components, including a large weight on rents.
Jim Bullard (2018) also agrees that the Phillips curve has not disappeared. In fact, it is the “theoretical” relationship that is at work, as for example included in New Keynesian macroeconomic models. In his view, the slope of the curve can no longer be seen in the data, because central banks have become more active and more successful in fighting inflation deviations from their policy targets. In these New Keynesian models aggressive reactions of monetary policy to inflation deviations are optimal. Bullard shows that the more aggressive the central bank becomes, the more the Phillips curve coefficient converges to 0 in a curve estimated from model-simulated data. So, we may be experiencing a case of the Lucas critique or Goodhart’s law at work.
Kristin Forbes (2018b) argues that the difficulty in identifying the Phillips curve in the data can be explained by the fact that standard approaches for doing so neglect international factors. Using another type of trend-cycle model which is applied to 43 countries over the last 30 years, she not only confirms the importance of trends in inflation but also shows that including variables like the real exchange rate, the world output gap or commodity prices materially reduces errors in estimating inflation. Which of them are relevant, however, varies across countries and over time (hinting also at the possibility of regime changes; see below). These international factors may reduce the importance of domestic variables but not necessarily replace them. Taking Forbes’ regression in which all countries are pooled, Table 1 illustrates how the relative importance of domestic and international factors changed after the break-out of the financial crisis compared with the full-sample estimates. For example, the world output gap and non-oil commodities moved from insignificant to significant inflation factors.
Table 1
Estimation of time-varying domestic and international inflation determinants
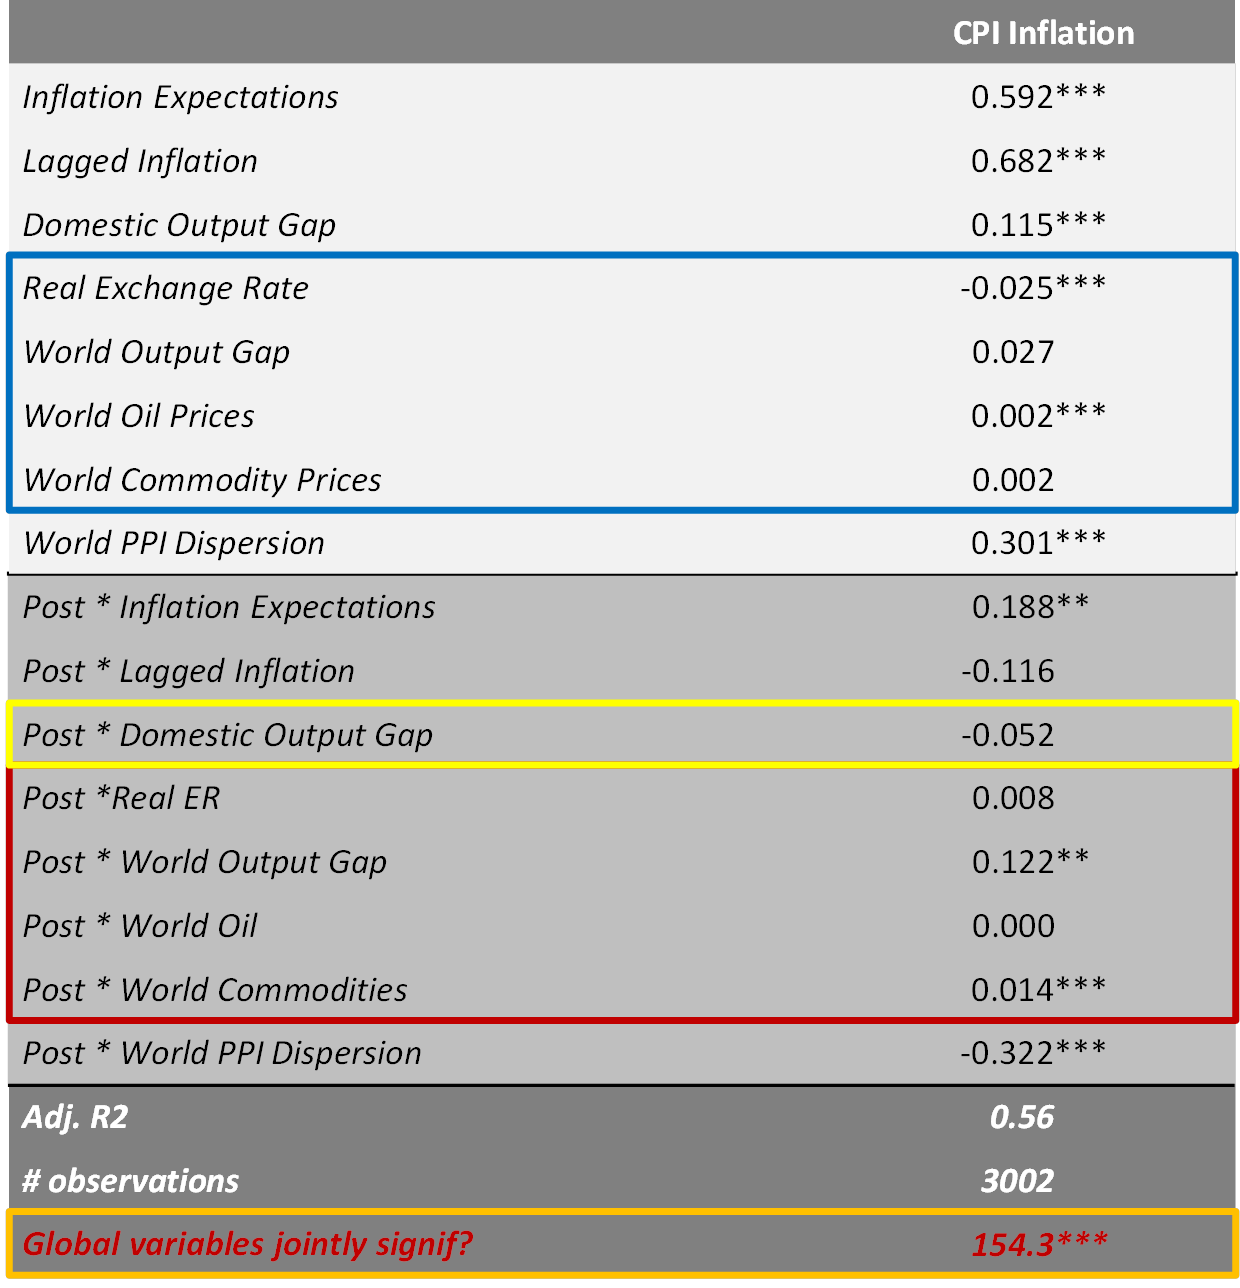
Source: Reproduced from Forbes (2018a), Table 1.
Notes: The table shows the parameter estimates of an enhanced Phillips curve regression for quarterly inflation (as measured by consumer price indexes – CPIs) for 43 countries between 1990 and 2017 according to equation (1) in Forbes (2018a). “ER” stands for exchange rate and “PPI” for producer price inflation. “Post” is a dummy variable equal to 1 for the years 2007 to 2017. The estimation uses random effects with robust standard errors clustered by country. ***, **, * indicate statistical significance at 1, 5 and 10 percent levels.
Several other Sintra speakers, such as Charles Wyplosz, Philip Lane, Philip Lowe, Aviv Nevo and Jim Stock, also supported the point about the importance of international factors. For example, Nevo and Wong (2018) mention that since firms’ pass-through from marginal costs to prices is smaller than 1 for most sectors, the more global and complex supply chains that emerged should further reduce the overall pass-through rate. Luigi Zingales linked international factors to Jim Stock’s contribution. The price index components that figure prominently in the CSI are housing, restaurant meals and entertainment, which are all very local. The prices of goods that are more closely subject to international competition do not receive much weight.
John Muellbauer, based on his joint work with Janine Aron (2018), pointed out that a stable empirical relationship between US unemployment and core inflation can also be found when a number of “non-standard” domestic factors are added to the explanatory variables for inflation. These include, inter alia, longer lags in the autocorrelation of inflation (along the lines of Sargan 1964, reflecting the fact that periods of low inflation are followed after some time by periods of higher inflation through some form of equilibrium adjustment mechanism). A particularly strong case of this may have happened after the crisis of 2008‑09, which affected major economies like a “heart attack”. Inflation would just take a very long time to recover after such a “stroke”. Philip Lane agreed that the euro area experienced such a large shock. It was therefore understandable that euro area inflation would take much more time to get to normal levels than for a regular business cycle. Philip Lowe pointed out that, based on its broad mandate, the Reserve Bank of Australia was able to be patient until inflation would ultimately come up. This meant that it did not risk side-effects on financial stability that a more forceful monetary expansion could cause. On the basis of the Swiss experience, Charles Wyplosz thought that low inflation did not always have to be a problem. Philip Lane, however, warned about yielding to the temptation of “nihilism”. In the case of the ECB, action was taken and it proved to be successful. Frank Smets and Michael Burda referred to previous literature that suggested non-linearities in and regime dependence of the Phillips curve. It could well be that at a more advanced stage of the cycle, the curve would steepen again.
In this context it may be interesting to note that in an online poll conducted among the Sintra participants, more than half of the voters felt that the Phillips curve was not “alive and well”. A third of Sintra participants agreed with the statement that it was well but non-linear and, hence, inflation reacts with a lag when slack is large. Only a minority thought that the Phillips curve is hidden by mis-measured inflation or slack.
Jay Powell wondered whether there were some lessons to be learnt from history. The last time that US unemployment had been as low as it is today was in the second half of the 1960s. During these five years, inflation increased from below 2% to around 5%. Powell concluded, however, that one cannot learn from this episode for today as much as one would have hoped for, because the US economy and central bank practices have changed in many ways over the past 50 years. For example, the natural rate of interest at the time was estimated around 5%, whereas today it is often estimated about 4 percentage points lower. An important factor in this reduction is that levels of education are significantly higher, making it less likely that people will become (and remain) unemployed. Moreover, after many years of low and stable inflation today’s inflation expectations are well anchored and central banks have a better appreciation of the importance of these expectations. So, the lack of useful historical precedent leaves us with some uncertainties regarding important questions faced today.
Perhaps we can draw a few conclusions from this debate. First, the simple traditional Phillips curve – where the output gap or other slack measures explain inflation in a linear way – is too primitive to work reliably in all circumstances. It needs to be enhanced by many more determinants of inflation, the possibility of regime changes and the correction of measurement biases in some variables. Second, the fact that the simple variant of it is flat does not mean that slack in goods or labour markets (or other domestic or international variables) are not acting as inflation determinants. Third, there were a variety of reasons – acting together or at different points in time – why inflation in the euro area recovered so slowly. It would be wrong to pinpoint one or two of these reasons. But in any case they are fading away now.
2 Low real wage growth, employment and inequality
Many observers seem to agree that one of the key explanatory variables for low inflation has until recently been wages, i.e. that the cost of labour grew at an unusually slow rate during the recovery. There are multiple possible explanations for this, the importance of which can also vary significantly across countries. Uta Schönberg reviewed the divergences of productivity, wage and (un)employment developments in nine advanced economies for the period 1995-2016, covering the main Anglo-Saxon, Nordic and euro area countries. This allowed her to then focus on how the uneven roles of trade unions in the wage-setting process of the two largest euro area countries – France and Germany – can explain their widely differing labour market outcomes (Kügler et al. 2018).
As can be seen from the left-hand panel of Chart 2, labour productivity grew at relatively similar rates in France and Germany (green and blue solid lines, respectively). But labour compensation started to diverge in the early 2000s, with French wages rising broadly in line with productivity and German wages stagnating until relatively recently (green and blue dashed lines). As Philippe Marcadent (2018) pointed out, wage decoupling from productivity over the last 20 years among a number of advanced economies has been particularly driven by large countries such as Germany, Japan and the United States. Shortly after the start of the wage divergence, Germany’s unemployment peaked at around 11% and an unprecedented period of employment creation started, lasting until the present day. In contrast, French unemployment stagnated at first but with the European crises moved up to around 10%, as shown in the right-hand panel of Chart 2. At the same time, however, wage inequality went in opposite directions in the two countries. Whereas in Germany the 10% lowest wage earners lost out over many years and the 10% highest earners increased their compensation relative to others, in France the 10% lowest somewhat gained in relative terms and the 10% highest lost out.
Chart 2
Labour productivity, wages and unemployment in France and Germany
Panel A: Productivity and compensation
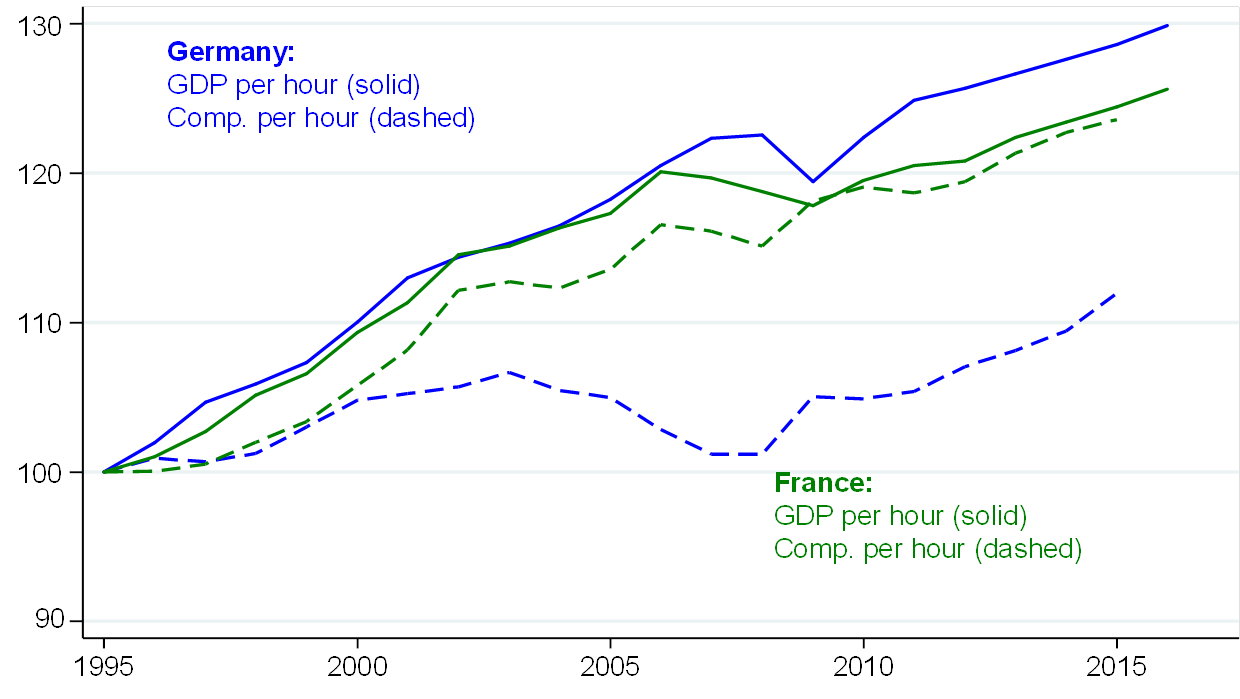
Source: Chart A from Kügler, Schönberg and Schreiner (2018) Panel A, Chart 2. Chart B derived from Kügler, Schönberg and Schreiner (2018) Chart 3.
Notes: Data for France are in green and for Germany in blue. Labour productivity is measured as GDP at fixed prices (using the GDP deflator) divided by total hours worked by all employees (solid lines in Panel A). Compensation (abbreviated as “Comp.”) per hour worked is defined as total labour costs (gross wages and salaries, plus employers’ social security contributions) divided by total hours worked by all employees (dashed lines in Panel A). Data in Panel A are normalised to 100 in 1995. Unemployment is defined as the share of unemployed people in the total labour force and measured in fractions (Panel B). The latest observation is for 2016 (GDP per hour 2015).
Panel B: Unemployment
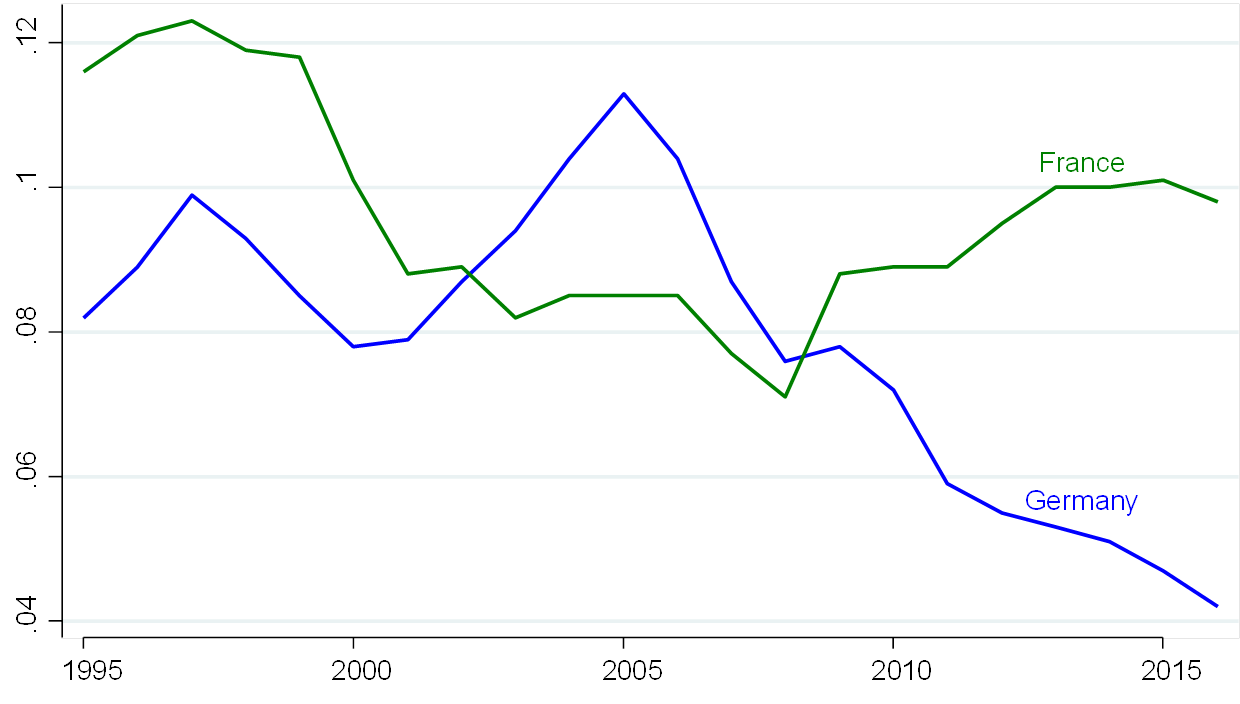
Schönberg argued that a major factor in these divergent developments was the decentralisation of the wage-setting process from the level of industry to the firm or even individual level that had started in Germany around the mid‑1990s. After the fall of the Iron Curtain, Germany was burdened with reunification (including uncompetitive firms in eastern Germany), and the outsourcing of production to central and eastern European countries became a credible threat. Given high union wages, German firms started to opt out of union agreements or increasingly used “opening clauses” (which allow individual firms to pay salaries below the agreements). De-unionisation has been a more general phenomenon in many, albeit not all, countries. Philippe Marcadent (2018) illustrated this with Chart 3, which shows the change in both union density (the share of workers with union membership – horizontal axis) and in collective bargaining cover (the share of wage agreements resulting from collective bargaining – vertical axis) for EU Member States since the turn of the millennium. German unions responded by making wage concessions in exchange for job security and job creation, basing wage demands more on inflation than on productivity developments. Updating Dustmann, Ludsteck and Schönberg (2009), Schönberg presented counterfactual simulations suggesting that, without de-unionisation, cumulative real wage growth in Germany between 1996 and 2012 would have been between 3 percentage points (for high wages) and 6 percentage points (for low wages) higher than was actually the case. While these only amount to small annual differences for each wage group, they could be multiplied if de-unionisation progressed further (as is the case for the countries in the lower left-hand part of Chart 3, for example). In Schönberg’s view, the decentralisation of wage-setting in Germany happened without intervention by the government.
Chart 3
De-unionisation in EU Member States

Source: Reproduced from Marcadent (2018), Chart 4.
Notes: Union density is the share of workers that are union members. Collective bargaining cover is the share of wage agreements that are the result of collective bargaining.
The same flexible adjustment would not be possible in the French system of industrial relations. There, the state extended union agreements to virtually all firms in a sector, downward deviations in wages at firm level were not possible and a relatively high, inflation-adjusted minimum wage existed. Moreover, whereas the German wage moderation proceeded in a relatively consensual way, industrial relations in France (and some other European countries) tend to be more confrontational. All these differences seem to explain quite well the stronger creation of jobs in Germany and the greater wage equality in France. More recently, however, wage growth has picked up again in Germany and a minimum wage was introduced. Together with the French labour market reforms under President Hollande and President Macron, this has led to the two countries becoming slightly more similar again.
The discussant, Michael Burda (2018), concluded that Schönberg and co-authors make a convincing case that nominal wage behaviour was crucial for the diverging employment and wage inequality developments in France and Germany. By decomposing the gradually declining labour share into three components – consumption wage, productivity and terms of trade – one can not only exclude differences in productivity as a primary force but also diverging trends in the terms of trade. But the wage “give-backs”, inequality and resulting successful internal devaluation in Germany cannot be understood without reference to the German labour market reforms of the early/mid‑2000s. While greater wage disparity started in the mid-to-late 1990s, when unions tried to help firms with concessions, the lowest real wages started only to diverge more from the median than the highest ones, and their growth effectively turned negative, with the implementation of the first Hartz reforms in 2003. Burda stresses that one key additional margin of flexibility was induced by the liberalisation of part-time work through Hartz I. Another resulted from the reduction in unemployment benefits (and in their duration) with Hartz IV (implemented in 2005), which significantly lowered the reservation wage above which people were willing to work. The sharply negative correlation between employment and wages from 2005 to 2010 confirms that the reforms led to increased labour supply (including notably because more women were joining the labour force) combined with flexible wages and better labour-market matching (enabled e.g. by the Hartz III reforms). Another source of limited upside wage pressure in Germany may have been a reduction in the non-accelerating inflation rate of unemployment (NAIRU) through some of the reforms. For example, Burda cited estimates that the Hartz III reforms – which in 2004 involved restructuring the Federal Labour Office and making regional employment agencies more efficient – may have knocked 1 to 2 percentage points off the German NAIRU.
Both Schönberg and Burda seemed to share the view that elements of the German approach to the labour market, such as the Hartz reforms, cannot simply be directly applied to other European countries that may have very different set-ups for their industrial relations.
Philippe Marcadent (2018) gave an overview of the “wage penalty” on temporary contracts. Despite legal requirements that pay for the same work has to be equal across employees, estimates suggest that – in practice – temporary workers in EU Member States tend to earn between 10% and 20% less than full-time workers (International Labour Organization 2016). Similar to part-time, on-call or multi-party employees, they are less unionised and generally have less bargaining power. Moreover, the penalty tends to be higher in the lower part of the wage distribution. So, increasing temporary work not only adds downward wage flexibility but may also contribute to wage inequality, as Burda observes for Germany after 2003.
Several people in the audience wondered about the generality of the trade-off between employment and wage equality visible in the Franco-German experience. Is inequality a necessary price to pay for bringing unemployment down or does low-wage employment tend to become a stepping stone for better jobs over time? Uta Schönberg thought that this was an important area where more research is needed. So far it can be observed that there are countries with low unemployment and low wage inequality, such as the Nordic countries. Moreover, after 2010 Germany experienced decreasing unemployment and decreasing wage inequality at the same time. In other words, the trade-off is not a necessity. But if there is high unemployment to start with, it is probably hard to bring it down without some rise in inequality. Luis de Guindos also emphasised the importance of the initial conditions for labour market reforms to be effective. In 2011 Spain had an unemployment rate of 25%. The government therefore enacted a reform in 2013 that included the decentralisation of wage bargaining. With such initial conditions the priority was to create jobs. Michael Burda held the view that the trade-off is not necessary, but some countries are better equipped than others to avoid it. For example, Nordic countries – such as Denmark or Sweden – do a better job of training low-skilled workers. Finally, both Michael Burda and Federico Fubini clarified that inequality issues in Germany were more pronounced in terms of wealth. Inequality of incomes overall was similar to the average of other advanced economies, because redistribution through Germany’s strong welfare system evens out part of the wage inequality.
Klaus Zimmermann (2018) went in a similar direction as Burda, stressing the importance of reforms with the German government’s involvement. Without long-term pressure for reform, the considerable level of flexibility internally could not have been achieved. Another example of this flexibility can be found in the “Kurzarbeit” scheme, which is covered under German labour and social law. In this scheme, the public unemployment insurance may subsidise the salaries of employees who work a reduced number of hours. This allows jobs to be shared and avoids the need for mass dismissals in situations such as in the Great Recession. Zimmermann expressed doubts that the call for unions in other countries to be more constructive would be heeded. In his view, a source of subdued wage growth that was not emphasised enough in the Forum discussions was migration. It was particularly important in a monetary union (and for monetary policy), because it helps smooth not only wage but also general macroeconomic adjustment in the case of asymmetric shocks. In addition, he stressed the issue of underutilised labour. As has been suggested in the work of Bell and Blanchflower (2018), many employed people have recently expressed a desire to work more and people who had previously felt that they should work less no longer want to do so as much. In such a context one may not be overly concerned with a coincidence of low unemployment and low wage growth.
Some further discussion also took place about the role of minimum wages. Klaus Zimmermann observed that they not only affect the lowest parts of the wage distribution but their changes can also have a level effect on the whole distribution. For example, the relatively new German minimum wage may become part of a long-term strategy to move wages up. So, central banks should include adjustments to minimum wages in their inflation assessments. Philippe Marcadent recalled the experience of the United Kingdom, where the minimum wage led to an increase in the lowest wages but to a reduction of the next higher wages above the minimum wage, presumably because employers oriented towards the minimum labour costs. Similarly, Erica Groshen was concerned that a very low minimum wage could become a monopsonistic tool for employers.
Philip Lane, Philip Lowe and Klaus Zimmermann stressed the risk of backward-looking inflation expectations in wage negotiations. Wages could not recover as they should in the post-crisis upturn, if social partners based their agreements on future inflation below central banks’ targets. Therefore, information campaigns are being undertaken in euro area countries and in Australia to explain the likely future paths of inflation. But Lowe reported that Australian employers are also reluctant to increase wages because of the fiercely competitive international environment in which their companies operate (e.g. vis-à-vis other Asian countries). Haruhiko Kuroda reported that the Japanese government had asked social partners to increase wages by 3% in this year’s “spring offensive”. With Japanese labour productivity at around 1%, he regarded this to be an appropriate number for achieving consistency with the Bank of Japan’s 2% inflation target.
In sum, the low wage growth of recent times in the euro area and other advanced economies can be explained by a variety of factors.
3 Inflation expectations, central bank communication and monetary policy
Inflation expectations are not only important for the social partners’ wage negotiations – they are also a key variable for the conduct of monetary policy. Central banks place great importance on the anchoring of inflation expectations, i.e. the fact that they are credible and that expectations do not deviate much from their inflation objective. Yuriy Gorodnichenko notes, however, that central banks tend to focus entirely on the expectations of professional forecasters and of market participants (as embodied in asset prices; Coibion et al. 2018b). Traditionally, they pay little or no attention to the inflation expectations of households or non-financial corporations (NFCs). In fact, measures of these – where collected – tend to show large deviations from the inflation objectives pursued by central banks. Most of the time, the difference from the objective is much larger than the case for inflation expectations by professionals. Over the last one to two decades, differences between the two involving 2 or more percentage points were quite common in the US and the euro area, for example (see Chart 1 in Coibion et al. 2018b).
Where do these discrepancies come from? Research suggests that households’ inflation expectations are particularly influenced by salient prices of frequently purchased, homogeneous goods (such as groceries or gasoline), creating a “veil of inattention” with respect to aggregate inflation and monetary policy announcements. For example, Michael Weber presented some new analysis suggesting that the high inflation expectations are driven by the members of households who do the main grocery shopping (D’Acunto et al. 2018). In emerging market economies or developing countries with histories of high inflation, however, agents’ attention to it is much closer.
Notwithstanding the need to improve the measurement of inflation expectations of households and, particularly, of NFCs, Gorodnichenko and co-authors suggest that influencing these expectations more actively has considerable potential for becoming a new “policy tool” for central banks. Convincing households and NFCs to revise their inflation expectations would change real interest rates, potentially by a large amount relative to other policy instruments, and thereby affect consumption and investment. It would also affect firm pricing and actual inflation. The potential for breaking through the “veil of inattention” is based on research that suggests that households and NFCs adjust their beliefs to incoming information and update their consumption and investment accordingly. For example, Coibion et al. (2018a) find that US consumers who are informed of past inflation rates, the Federal Reserve System’s inflation target or the inflation forecast of the Federal Reserve System’s Federal Open Market Committee (treatment group) revise their inflation expectations towards those levels, but that the consumers who have not been given this additional information (control group) do not (see Table 2). To be successful in this, however, central bankers would need to use simple messages that are regularly repeated and directly targeted at the relevant firm or population subgroups (as is possible in social media or with advertising techniques).
Table 2
Estimation of the scope for influencing household inflation expectations
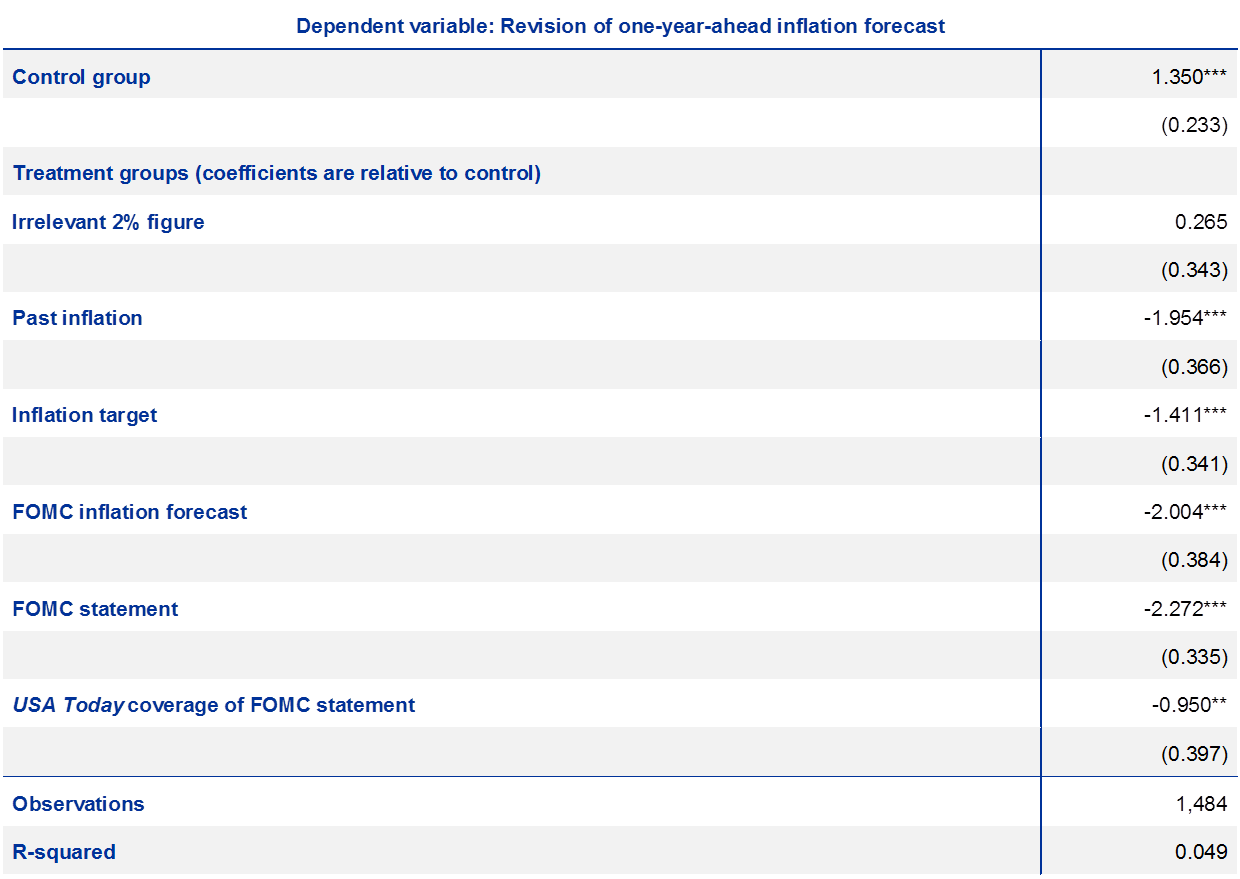
Source: Reproduced from Coibion, Gorodnichenko, Kumar and Pedemonte (2018b), Table 4.
Notes: The table reports estimated effects of providing information (indicated in the left column) to households participating in the Nielsen Homescan panel for the United States. For treatment “Irrelevant 2% figure”, households are informed that the population in the United States grew 2% over the last three years. The dependent variable is equal to (post-treatment one-year-ahead inflation expectations) minus (pre-treatment one-year-ahead inflation expectations). Pre-treatment expectations are computed as the implied mean of expected inflation distribution over the next year. Post-treatment expectations are elicited as point forecasts. Treatment effects tend to be negative, because households typically hold too high inflation expectations (before receiving additional information). Robust standard errors are reported in parentheses. ***, **, * indicate statistical significance at 1, 5 and 10 percent levels.
Today, however, we are not yet ready to apply this new communication approach, according to Gorodnichenko, particularly since more research is needed on how inflation expectations translate into NFC and household actions and because surveys about NFCs’ inflation expectations are unavailable or not of the desired quality. Charles Wyplosz felt that it would be real progress if central banks were to focus their communication more on the “people in the street” and less on financial market experts. If they do not believe the inflation numbers, then they have to be convinced that the figures are honest.
The idea of targeted influencing of households and NFCs via social media was met with scepticism by a number of central bankers. For example, Otmar Issing feared that using tools similar to those used by populist politicians could endanger the credibility of central banks, particularly if attempts were made to influence the expectations of specific groups further away from stated inflation objectives. Mario Draghi agreed and added that inflation expectations should not be getting close to replacing actual inflation as the objective of central banks. There was also some disquiet that delivering different inflationary sentiments to different stakeholders might undermine central bank transparency. Benoît Cœuré and Erica Groshen agreed that households’ and NFCs’ inattention to inflation and monetary policy is rather likely to be a sign of success of central banks in advanced economies keeping inflation low and stable. Jim Bullard considered that “communicating to the masses” would be an uphill battle. While the ongoing broadening of central banks’ outreach to more groups in society was useful, it is not a realistic substitute for talking to professionals and financial markets. Market-based expectations provide a great signal of what monetary policymakers do, taking into account all relevant data and reacting fast. In a similar vein, Philip Lane and Stefan Gerlach argued that much of the monetary transmission mechanism works through the financial system. So, in order to influence financial intermediaries’ funding and general financial conditions in the economy (e.g. through long-term bond yields), explaining developments to the market is very important. In another online poll about what central banks should do to better align firm and household inflation expectations with their objective, 43% of voting Sintra participants agreed with pursuing three directions at the same time, namely:
- generally improving financial literacy and awareness of monetary policy;
- shifting the emphasis from financial markets to NFCs and households; and
- targeting specific groups, including via social media.
However, when looking at each individual direction, the first received the most support (28%).
The discussant, Ricardo Reis (2018), observed that the focus on experimental event studies by Gorodnichenko et al.’s survey could miss some longer-term effects of central bank communication. He took the so-called Volker disinflation as one example. The bell-shaped distribution of consumer inflation expectations in the United States in Q1 1979 had a relatively high mean. The distribution then moved slowly over time to a bi-modal pattern before settling in Q4 1982 again to a bell-shaped form with a lower mean (Mankiw et al. 2004). A better approach for capturing these slow-moving expectation effects would be to include monetary policy communication events in vector-autoregression models.
Reis (2018) also discusses three channels through which monetary policy communication may influence inflation expectations:
- revelation of future monetary policy;
- revelation of fundamental information about the economy; and
- moving expectations independently, i.e. influencing “animal spirits”.
Central banks would seem to have a duty to regularly engage in 2. (e.g. by publishing forecasts or commenting on data releases) and to some extent in 1. (e.g. when forward guidance is necessary). 3. seems to be more problematic though. For example, the evidence from hyperinflations suggests that announcements are only successful when they are followed up by solid policy action. In other words, trying to stimulate “animal spirits” via some form of “propaganda” would be a dangerous interpretation of the Coibion et al. paper.
Reis and Reichlin agreed that it was also important to distinguish between permanent and transitory components in inflation expectations. The strong influence of gasoline prices on household expectations, for example, could suggest that their misalignment with central banks’ inflation objectives has significant transitory components. But misalignments of the permanent component or trends would be more worrying. Lastly, Ricardo Reis considered that the role of monetary policy to ensure a stable unit of account (“anchoring” of inflation expectations) tends to be generally regarded as a success. But using it as a countercyclical stabilisation policy is harder. Households’ and firms’ inattention, as reported by Gorodnichenko and co-authors, makes “anchoring” easier. One example of it was the relative stability of expectations during the Great Recession. But it also makes fine-tuning of stabilisation policy even more challenging.
4 Do we understand the microeconomic factors influencing inflation well enough?
Against the background of important structural changes in advanced economies, including globalisation, industry concentration, the growth of e-commerce, the emergence of a “sharing economy” and the availability of “big data”, Aviv Nevo (Nevo and Wong 2018) discusses micro aspects of consumer behaviour and firm price-setting that could have a bearing for general inflation developments and measurement. He first asks how substitution biases in price measurement have evolved, adopting the perspective of individual shoppers. With grocery data, scanned by these shoppers, he shows that during the Great Recession US households were using sales, coupons and generic products more actively. In the subsequent recovery this behaviour was reversed, partly, fully or even more, depending on the shopping indicator considered. It might be tempting to infer from this that some part of the “missing disinflation” during the Great Recession was a statistical artefact from standard price indexes not capturing the changed shopping behaviours. Similarly, part of the “missing inflation” in the recovery could be the consequence of the reversals of those behaviours. But such stark conclusions do not necessarily follow from these facts for a variety of reasons. For example, we do not know whether the shopping behaviour for the many other product categories that are not covered is similar or different. Moreover, it is very hard to establish whether consumers derive the same level of utility when they substitute products or outlets to pay a lower price. Finally, it is not clear whether the substitution cycle fluctuates around a neutral, positive or negative level.
Some of these comparability problems are the reason why statistical offices usually base their standard price indexes on a product perspective. The prices of the same goods are tracked in shops over time. This approach, however, could still be vulnerable to an “upper level” substitution bias if households’ consumption baskets change relative to the ones assumed in the indexes. To check for this bias, the US Bureau of Labor Statistics publishes not only the regular consumer price index (CPI) but also the so-called Chained Consumer Price Index (C‑CPI). Whereas the CPI expenditure basket is only adjusted every two years, the C‑CPI benefits from baskets that are adjusted monthly. So, the difference between the CPI and C‑CPI represents a measure of the over-estimation of prices through this type of bias. Erica Groshen showed this measure in her panel intervention for the period 2000‑17. She reckoned that the average aggregate bias tended to be moderate, varying between +80 and ‑10 basis points. If anything, its average of 22 basis points after the crisis was slightly lower than before. All this does not support the hypothesis that the “missing disinflation” during the Great Recession or the “missing inflation” in the subsequent recovery were statistical artefacts from substitution biases.
The next issue Nevo addresses is whether some micro price developments can be more clearly identified as long-term trends. The first is the growth in online shopping which, according to the US Census Bureau, went from less than 1% of total retail sales in 2000 to almost 10% in 2017. Although not a comparable indicator, the share of euro area citizens ordering goods or services online ranged between about 20% and 70% in 2014, depending on the country considered (ECB 2015). Arguably, online shopping is likely to progress further going forward. Although perhaps different from everybody’s casual shopping impressions, the conventional wisdom from a small but rising literature so far seems to be that online prices are not markedly different from regular shop prices (Cavallo 2017 or Gorodnichenko et al. 2017). However, one recent paper – using a broad range of product categories – suggests that online inflation could have been 1 percentage point lower than regular CPI inflation in the United States between 2014 and 2017 (Goolsbee and Klenow 2018). In line with the conventional wisdom, Mario Draghi mentioned internal analytical work by ECB staff that found very little evidence that e-commerce would permanently lower aggregate euro area inflation (ECB 2015). Moreover, Erica Groshen pointed out that the statistical offices calculating price indexes tend to catch up by including an appropriate share of online prices in their sampling. For example, in 2016 more than 8% of prices collected by the US Bureau of Labor Statistics were online prices. So, any measurement bias related to the negligence of e-commerce should be limited.
The second structural change mentioned by Nevo concerned increased industry concentration and market power of firms (see e.g. De Loecker and Eeckhout 2017 and 2018). As also pointed out by Tommaso Valletti (2018), this could further reduce the pass-through from marginal costs to prices. In such a context, wage increases would have a more limited effect on inflation (potentially making an indirect contribution to low inflation). But marginal cost reductions, say through digitisation, would also not be passed on in full, implying in principle the opposite effect. In contrast to the US, Valletti (2018) did not find particular changes to industry concentration in the five largest EU Member States (EU5) between 2010 and 2015. Moreover, increases in mark-ups seem to be more muted in the EU5. Firms’ profits as a share of GDP in the EU5 are on a similar upward trend as in the United States, but the figures are weaker when excluding the United Kingdom. Generally, caveats about data quality and country heterogeneity have to be kept in mind for Europe. One question that seems to remain unanswered is which of two trends – increasing market power and mark-ups, implying upward pressure on prices, versus technical change expanding low marginal cost industries, implying downward pressure on prices – would dominate in terms of price levels and potential inflation effects. (The growth of global supply chains, the third structural change, and pass-through has already been mentioned in Section 1 above.)
Lastly, Nevo observed that the new availability to firms of “big data” about their clients and greater computing power puts them in a better position for active price discrimination, where prices are set according to individual consumers’ willingness to pay rather than as an add-on to marginal costs. It is hard to say whether such “first degree” or “perfect” price discrimination will result in general price increases or not. Even worse though is working out how inflation can be properly measured and interpreted in a world where prices become largely individualised, Nevo asks.
The discussant, Michael Weber (2018), recalled that ageing societies might also have a role in the low inflation observed in advanced economies. An argument put forward in the past is that a growing cohort of elderly or retired people relative to young and middle-aged people would consume less and therefore create less demand. Moreover, older workers typically receive smaller salary increases than do younger workers. Therefore, Weber reported new research on the (cross-sectional) relationship between the age composition and producer price inflation (PPI) of different US industries (Schoefer et al. 2018). He showed that, from an economic and statistical point of view, PPI is significantly lower in industries with higher “senior-to-all ratios” (defined as the share of total hours worked by employees aged between 55 and 64 years in the total hours worked by all employees) than in other industries. Chart 4 visualises the relationship for the three most recent time periods covered. Moreover, this effect is larger in relatively labour-intensive industries. Finally, wage growth is also lower in industries with an older labour-force composition, in line with older workers having less bargaining power in wage negotiations than younger and more recently educated workers (see Section 2 above for a more general discussion of sources for low real wage growth).
Chart 4
Workforce age structure and producer price inflation in the United States
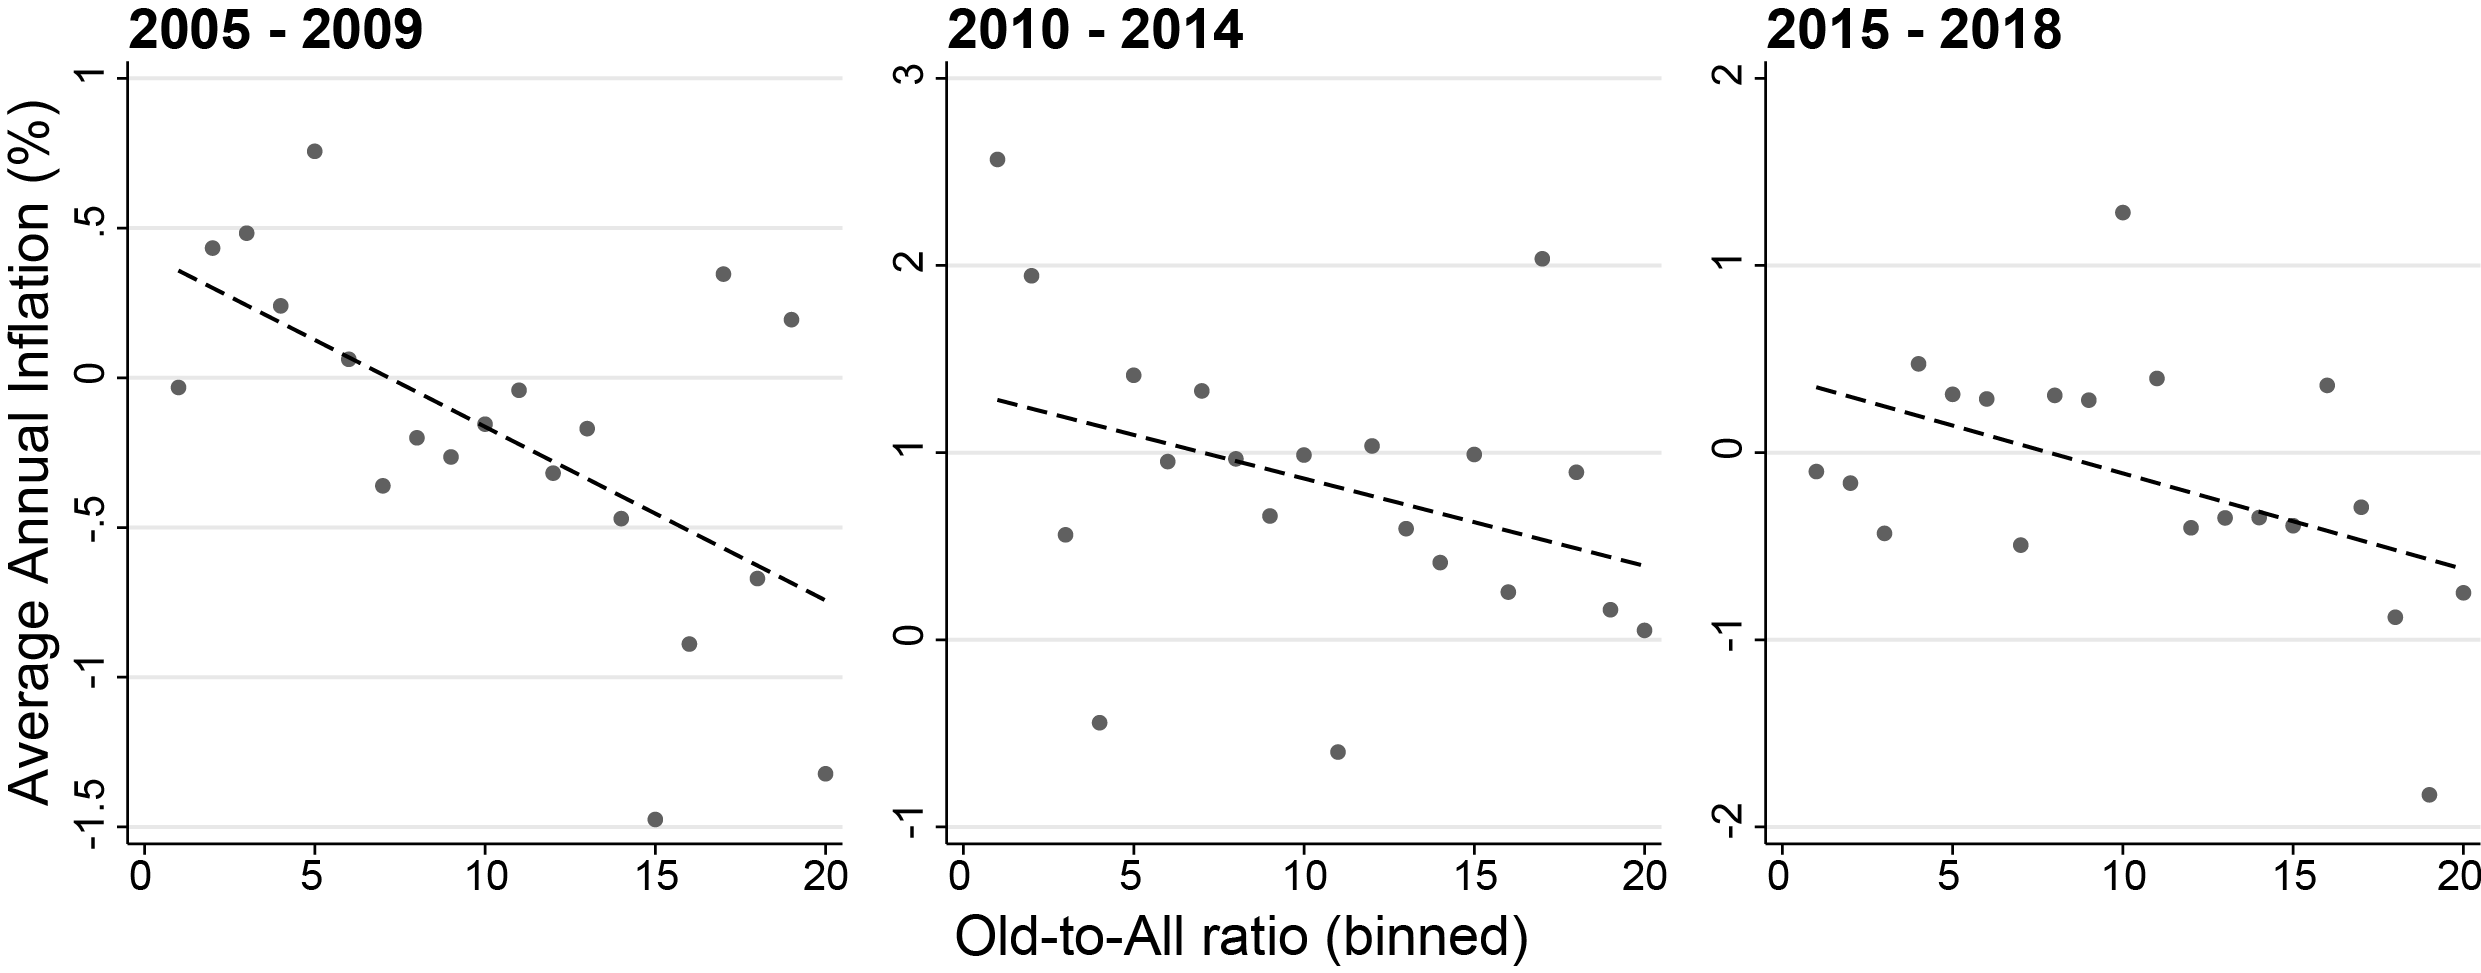
Source: Reproduced from Weber (2018), Chart 8.
Notes: The charts show the relationship between the share of total hours worked by senior employees (aged between 55 and 64 years) in the total hours worked by all employees (“Old-to-All ratio”) and producer price inflation for average US industry data over the time periods indicated above the three panels, as estimated by Schoefer et al. (2018). The total number of points is much lower than the total number of industries covered in the underlying estimations, because a “binning” technique is used for ensuring clarity of exposition. The plots are conditional, i.e. effects of other variables included in the underlying regression are taken out (see column 6 of Table 1 in Weber 2018).
Some macroeconomists wondered about the relevance of the discussed competition and micro price developments for central banks and monetary policy. For example, Charles Wyplosz pointed out that mark-up changes have natural limits upwards or downwards and their effects may only be temporary. Jan Eeckhout responded that the phenomenon of increasing mark-ups has been observed for about the last 40 years, with an average annual growth rate of about 1% and the pick-up being steepest in the last 6 to 7 years. John Muellbauer added that his recent research suggests that industry concentration is one of the “non-standard” variables that help improve the modelling and forecasting of US inflation (Aron and Muellbauer 2018). He thinks that the relative adjustment between input and output prices as well as of different output prices across industries with changing concentrations likely plays a role in the equilibrium adjustment mechanism for inflation. In response to a question by Ricardo Reis and Benoît Cœuré, Aviv Nevo speculated that greater price discrimination could make consumers’ extraction of the general inflation component in price changes more difficult thereby enhancing nominal rigidities in macroeconomic adjustment. Finally, Tommaso Valletti (2018) argued that lower cost pass-through should reduce the transmission of central bank interest rate policy via NFCs, particularly the more they pursue first degree price discrimination. Benoît Cœuré commented that other monetary policy transmission channels would still remain active.
All in all, the Sintra discussion on this theme, particularly including the call by Aviv Nevo, seems strongly to suggest that research into micro price developments and macro inflation developments needs to be much more integrated. The question whether the changes in firms’ individual price-setting behaviour make a net contribution to the low-inflation phenomenon or go somewhat in the opposite direction can only be answered if scholars from fields such as industrial organisation, marketing and macroeconomics work much closer together than has been the case so far. Finally, there remain great challenges with measurement biases and data availability for this theme and for understanding price and wage-setting in advanced economies more generally.
References
Aron, J. and Muellbauer, J. (2018), The reincarnation of the Phillips curve, with new forecasting evidence for US core inflation, in progress, Oxford University.
Bell, D. and Blanchflower, D. (2018), Underemployment in the US and Europe, mimeo, Dartmouth College.
Bullard, J. (2018), “The case of the disappearing Phillips curve”, forthcoming in ECB, Price and wage-setting in advanced economies, Frankfurt am Main.
Burda, M. (2018), Comment on “Productivity growth, wage growth and unions” by Kügler, A., Schönberg, U. and Schreiner, R., forthcoming in ECB, Price and wage-setting in advanced economies, Frankfurt am Main.
Cavallo, A. (2017), “Are online and offline prices similar? Evidence from large multi-channel retailers”, American Economic Review, 107(1), pp. 283-303.
Coibion, O., Gorodnichenko, Y. and Weber, M. (2018a), Monetary policy communications and their effects on household inflation expectations, mimeo, University of California at Berkeley.
Coibion, O., Gorodnichenko, Y., Kumar, S. and Pedemonte, M. (2018b), “Inflation expectations – a policy tool?”, in ECB, Price and wage-setting in advanced economies, Frankfurt am Main.
Constâncio, V., Hartmann, P. and Tristani, O. (2015), Selected takeaways from the ECB’s Sintra Forum on “Inflation and Unemployment in Europe”, VoxEU, 28 October.
D’Acunto, F., Malmendier, U.,Ospina, J. and Weber, M. (2018), “Salient price changes, inflation expectations and household behaviour”, paper presented at the Federal Reserve Bank of Cleveland conference on “Inflation: Drivers and Dynamics”, 17 May.
De Loecker, J. and Eeckhout, J. (2017), “The risk of market power and the macroeconomic implications”, NBER Working Paper 23687, August.
De Loecker, J. and Eeckhout, J. (2018), “Global market power”, NBER Working Paper 24768, June.
Dustmann, C., Ludsteck, J. and Schönberg, U. (2009), “Revisiting the German wage structure”, Quarterly Journal of Economics 124(2), pp. 843–881.
European Central Bank (2014), “The responsiveness of HICP items to changes in economic slack”, Monthly Bulletin, September, pp. 65-67.
European Central Bank (2015), “Effects of e-commerce on inflation”, Economic Bulletin, Issue 2, pp. 51-54.
Forbes, K. (2018a), Has globalization changed the inflation process?, Paper prepared for 17th BIS Annual Research Conference, draft 10 June.
Forbes, K. (2018b), “Time for a new astrolabe?”, forthcoming in ECB, Price and wage-setting in advanced economies, Frankfurt am Main.
Goolsbee, A. and Klenow, P. (2018), “Internet rising, prices falling: measuring inflation in a world of e-commerce”, NBER Working Paper 24649, May.
Gorodnichenko, Y., Sheremirov, S. and Talavera, O. (2017), “Price setting in online markets: does IT click?”, forthcoming in Journal of the European Economic Association.
Groshen, E. (2018), “Views on advanced economy price- and wage-setting from a reformed central bank researcher and national statistician”, forthcoming in ECB, Price and wage-setting in advanced economies, Frankfurt am Main.
Hasenzagl, T., Pellegrino, F., Reichlin, L. and Ricco, G. (2018), “A model on the Fed’s view on inflation”, CEPR Discussion Paper 12564, January.
International Labour Organization (2016), Non-standard employment around the world: understanding challenges, shaping prospects, Geneva, November.
Kügler, A., Schönberg, U., and Schreiner, R. (2018), “Productivity growth, wage growth and unions”, forthcoming in ECB, Price and wage-setting in advanced economies, Frankfurt am Main.
Lane, P. (2018), “The macroeconomics of price and wage-setting”, forthcoming in ECB, Price and wage-setting in advanced economies, Frankfurt am Main.
Mankiw, G., Reis, R. and Wolfers, J. (2004), “Disagreement about inflation expectations”, in Gertler, M. and Rogoff, K. (eds.), NBER Macroeconomics Annual, MIT Press, pp. 209-248.
Marcadent, P. (2018), “Wage dynamics and labour market institutions”, forthcoming in ECB, Price and wage-setting in advanced economies, Frankfurt am Main.
Nevo, A. and Wong, A. (2018), “Measuring inflation in the modern economy – a micro price-setting view”, presentation at the ECB Forum on Central Banking on “Price and wage-setting in advanced economies”, Sintra, 20 June.
Reichlin, L. (2018), Comment on “Slack and cyclically sensitive inflation” by Stock, J. and Watson, M., forthcoming in ECB, Price and wage-setting in advanced economies, Frankfurt am Main.
Reis, R. (2018), Comment on “Inflation expectations – a policy tool?” by Coibion, O., Gorodnichenko, Y., Kumar, S. and Pedemonte, M., forthcoming in ECB, Price and wage-setting in advanced economies, Frankfurt am Main.
Sargan, J. (1964), “Wages and prices in the United Kingdom: a study of econometric methodology”, in Hart, P. et al. (eds.), Econometric Analysis for National Economic Planning, Butterworth Co., London, pp. 25-63.
Schoefer, B., Weber, M. and Yin, X. (2018), Changes in the age composition of workers and industry inflation, mimeo, University of Chicago.
Stock, J. and Watson, M. (2018), “Slack and cyclically sensitive inflation”, forthcoming in ECB, Price and wage-setting in advanced economies, Frankfurt am Main.
Valletti, T. (2018), “Concentration in markets: trends and implications for price-setting”, forthcoming in ECB, Price and wage-setting in advanced economies, Frankfurt am Main.
Weber, M. (2018), Comment on “Measuring inflation in the modern economy – a micro price-setting view, forthcoming in ECB, Price and wage-setting in advanced economies, Frankfurt am Main.
Wyplosz, C. (2018), “Learning from stubborn inflation”, forthcoming in ECB, Price and wage-setting in advanced economies, Frankfurt am Main.
Zimmermann, K. (2018), “Reflections on wage-setting”, forthcoming in ECB, Price and wage-setting in advanced economies, Frankfurt am Main.
- Both European Central Bank. We are grateful to Benoît Cœuré, Luca Dedola, Martin Eiglsperger and Peter Praet for comments and discussions. All views expressed are summarised to the best of the authors’ understanding from the various Sintra participants’ Forum contributions and should not be interpreted as the views of the ECB or the Eurosystem. Any errors are our own.