


Does the disclosure of stress test results affect market behaviour?
Does the disclosure of stress test results affect market behaviour?
Published as part of the Macroprudential Bulletin 17, June 2022.
This article studies the impact of stress tests on bank stock prices. The results suggest that the publication of stress tests provides new information to markets. Banks performing poorly in stress tests experience, on average, a reduction in returns and an increase in volatility. The market response to the disclosure of the European stress test results was larger in periods of greater uncertainty. Furthermore, the publication of the stress test results of more vulnerable banks led to more sizeable market responses given that it generated more valuable information. These results support the hypothesis that stress tests and their publication improve market discipline.
1 Introduction
After the global financial crisis, stress tests became an important assessment tool to ensure that the European banking system is robust and resilient to adverse macro-financial shocks. The main objective of stress tests is to identify tail risks in banks’ balance sheets, build confidence in the banking system and enhance transparency among market participants. Due to the opaque nature of banks, informational asymmetry may undermine the ability of market participants to take informed decisions, i.e. distinguish between “good” and “bad” banks. Disclosing stress test results therefore improves market discipline by providing new information to market participants.
The combination of regulatory requirements and market discipline increases transparency. The disclosure of stress test results expands the information available to investors, thus improving the ability of markets to discriminate between banks.
This article provides new evidence on the information and certification role of stress tests. It looks at the impact of the publication of the EU-wide stress tests on stock market behaviour. The effect of the disclosure of stress test results on bank equity returns is assessed by relating stress test performance with the mean and volatility dynamics of bank stock returns. Furthermore, changes over time in the stock market response to the disclosure of banks’ stress test results and the relationship between the markets’ responses and banks’ specific risk factors are examined.
The empirical literature on the informational content of stress test publications is relatively limited, in particular for the European context. So far, only a few empirical studies have estimated the short-term effects of stress testing exercises. The consensus, however, is that the disclosure of stress test results generally reveals new information to markets.[1] While studies have brought considerable light to the relationship between stress test publication and stock price returns, little attention has been devoted to higher-return moments. This article aims to bridge this gap by not only exploring the dynamics in mean returns, but also including the volatility aspect in the analysis.
The results of this article show that banks that do badly in stress tests face a reduction in returns and an increase in volatility on the disclosure of stress test results, while the reverse holds true for banks performing well. Moreover, the market response to the disclosure of European stress test results decreased between 2014 and 2018, then increased again in 2020 and remained broadly stable in 2021 during the coronavirus pandemic. Furthermore, the publication of the stress test results of more vulnerable banks leads to more sizeable market responses given that it generates more valuable information. These findings provide support for the hypothesis that stress tests play a useful role in improving market discipline, restoring confidence in the banking system and thereby promoting financial stability, especially in times of greater uncertainty.
The remainder of this article is structured as follows. Section 2 describes the methodological approach used for the analysis. Section 3 presents the empirical findings for the impact of the stress tests on bank stock prices. Section 4 concludes the analysis.
2 Methodological approach
Two methods are applied to measure whether publication of stress test results is priced in stock markets. The first analysis looks at the behaviour of cumulative abnormal returns, described as the difference between the actual ex-post return of a security and its expected return (MacKinlay, 1997).[2] The second analysis studies the mean and volatility of bank stock returns.
The first method examines the link between cumulative abnormal returns and the projected end-Common Equity Tier 1 (CET1) ratio under the adverse scenario.[3] The expected returns over the relevant window around the event date are computed to derive (cumulative) excess/abnormal returns. In line with other event study papers, a two-day event window is considered, with an estimation window of 250 days. Cross-sectional insights are inferred through a linear panel regression by examining the link between the cumulative abnormal returns and the projected end-CET1 ratio under the adverse scenario, while controlling for bank level characteristics.[4]
The second method infers whether both returns and volatility of bank equity prices are affected by the disclosure of stress tests. A structural generalised autoregressive conditional heteroskedasticity (GARCH) model developed by Engle and Siriwardane (2018) is used.[5] Additionally, as a robustness check, realised variance is computed as a measure of stock market volatility. It is calculated by summing squared five-minute intraday returns retrieved from Refinitiv within each day after following data cleaning steps, as prescribed in Andersen et al. (2003).
The empirical strategy relies on daily and five-minute intraday frequencies of equity prices for banks that participated in the EU-wide stress tests of 2014, 2016, 2018 and 2021. The data were retrieved from Bloomberg and Refinitiv. The average sample in the analysis consists of 37 banks[6] and is constrained by the fact that stock prices are not available for all banks participating in the stress tests.
3 Results
This section presents the main results of the effect of the publication of the stress tests on both equity returns and volatility.
3.1 Effect of the publication of the stress tests on equity returns
Banks that perform better during stress tests tend to report higher excess returns than banks that perform worse (i.e. banks with larger capital gaps in the stress tests experienced higher negative abnormal returns). Chart 1 depicts the scatter plots with the relation between abnormal returns and projected end-CET1 ratio on the day before and day after the stress test publication. Ordinary least squares (OLS)-fitted trend lines and correlation coefficients indicate that on the day before stress test publication events, the relationship is relatively weak and statistically insignificant. Conversely, the correlation coefficient on the day after the publication reveals a much stronger relationship and is statistically significant across all stress test events. This already suggests that stress tests may provide new information to markets.
Chart 1
Relationship between abnormal returns and stress test performance (in terms of end-CET1 ratio)
(x-axis: projected end-CET1 ratios; y-axis: abnormal returns expressed as percentages)

Sources: Bloomberg and authors’ calculations.
Notes: This chart plots the relationship between abnormal returns and projected end-CET1 ratios (from the stress tests) on the day before (left) and after (right) the publication of the 2014, 2016, 2018 and 2021 stress test results. The OLS-fitted trend line (red) has been added for reference.
The end-horizon stress test CET1 ratio is used as new information by the markets as a measure of bank resilience to an adverse shock. The effect of the stress test CET1 ratio on cumulative abnormal returns is further inspected by the panel regression in Table 1. A 1 percentage point increase in the projected end-CET1 ratio generates, on average, higher cumulative abnormal returns of 0.34 percentage points. In sum, these findings show that the disclosure of stress test results helps in improving pricing.
Table 1
Effect of stress test performance (in terms of end-CET1 ratio) on cumulative abnormal returns
(percentage point changes)
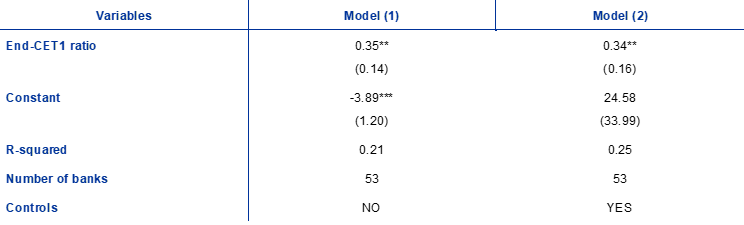
Notes: This table presents the estimates for the average effect of the bank projected end-CET1 ratio of the stress tests on cumulative abnormal returns, through a panel regression with bank and time fixed-effects. The dependent variable is the bank projected end-CET1 capital ratio under the adverse scenario in a stress test. Model 1 reports the results without controlling for covariates. Model 2 presents the results conditional on the logarithm of total assets and on the leverage ratio to control for bank heterogeneity. The leverage ratio is defined as the bank Tier 1 capital (numerator) divided by its total exposure (denominator). Standard errors in parentheses are clustered by bank. ***, ** and * denote significance at the 1, 5 and 10 percent level respectively.
Box 1
The stock market response to the disclosure of the European stress test results – change over time and its relationship with bank-specific risk factors
The response of stock markets to the disclosure of banks’ results in European stress tests changes with the macro-financial context. The event analysis[7] in this box looks at the behaviour of absolute cumulative abnormal returns[8] after the publication of the results for a sample of 43 euro area banks across the last five European stress tests, i.e. the exercises carried out in 2014, 2016, 2018, 2020[9] and 2021. The market response to the disclosure of the European stress test results was high in 2014, lower for 2016 and 2018, then increased again in 2020 in 2021, during the COVID-19 crisis (Chart A). The publication of the results in 2014 was associated with a larger market response then in later years given that this exercise was seen by investors as a key step towards certifying the soundness of the European banking sector after the end of the sovereign debt crisis and ensuring the successful establishment of the Single Supervisory Mechanism (SSM).[10] The stock market response increased again in 2020 and 2021 given that the disclosure of the stress test results contributed to enhancing transparency of the resilience of the banking sector during the COVID-19 crisis.
Chart A
Change in the absolute cumulative abnormal returns for the tested banks across European stress tests
(X-axis: years of the stress tests, Y-axis: percentages)

Source: ECB calculations.
Notes: Cumulative abnormal returns are computed both using the one-factor capital asset pricing model (CAPM) (blue solid line) and the Fama and French three-factor model (FF) (yellow solid line). The event analysis considers the European stress tests carried out in 2014, 2016, 2018, 2020 and 2021.
The information released by the tested banks is particularly relevant for markets in periods of marked uncertainty as in 2014, and later during the COVID-19 crisis. In these periods, the disclosure of stress test results allows investors to better assess the resilience of the banking system at a time when there is greater opaqueness about the soundness of the sector; it increases transparency, promotes market discipline, helps to support market confidence and facilitates realistic risk pricing.[11] The decline in the market response to the disclosure of the stress test results between 2014 and 2018 is consistent with a gradual decrease in the “novelty aspect” of their publication . The response of markets declined over these “normal” times given that stress test outcomes had become more predictable and, therefore, less informative.
Table A
Absolute cumulative abnormal returns, solvency, profitability and asset quality

Source: ECB calculations.
Notes: The sample is the event study sample with one observation per bank-event date (as available). The events are the five stress-test disclosures considered between 2014 and 2021. The dependent variable is the absolute cumulative abnormal returns computed using the Fama and French three-factor model. Metrics for solvency, profitability and asset quality are from BankFocus. Regressions include fixed effects for each year. Standard errors are clustered at bank level. ***, ** and * represent statistically significance levels of 1, 5 and 10 percent, respectively.
The market response to the disclosure of stress test results depends on bank characteristics (Table A). A panel analysis examines whether banks’ absolute cumulative abnormal returns are associated with various metrics of banks’ solvency (CET1 ratio, Tier1 ratio and the capital adequacy ratio), profitability (return on assets, return on equity and net interest margin) and asset quality (the ratio of loan loss reserves over customer loans, the ratio of impaired loans over customer loans and the non-performing loan ratio) for the year before the stress test. Each panel regression uses absolute cumulative abnormal returns as dependent variable and includes time-fixed effects.
The disclosure of the stress test results of more vulnerable banks is associated with more marked market responses given that it generates more valuable information for investors.[12] The estimated coefficients of the CET1 ratio and the Tier1 ratio are negative and significant, indicating that the results of banks with a lower solvency ratio are associated with a greater market response. The estimated coefficients of the ratio of loan loss reserves over customer loans and the ratio of impaired loans over customer loans are positive and significant, indicating that the disclosure of the stress test results of banks with weaker asset quality are associated with a stronger market reaction.
3.2 Effect of the publication of stress tests on the mean and volatility of equity returns
When controlling for the dynamics in the market index, the median bank experiences a moderate reduction in mean returns and volatility following the publication of the stress tests. Table 2 shows the results based on a structural GARCH model to investigate whether the disclosure of stress tests had a significant effect on the first (λ) and second moment (δ) of equity returns. The results show that, when controlling for the dynamics in the market index, the median bank experiences, on average, a change of -0.25 percentage points in returns during the event window. Regarding the second moment of returns, the results show that the median bank experiences, on average, a 6% reduction in the variance process of its equity return series. However, as suggested by the interquartile range of both variables, there is a high degree of heterogeneity in the estimated values of and among banks.
Table 2
Effect of stress test performance (in terms of end-CET1 ratio) on cumulative abnormal returns
( denotes percentage point changes in the first moment, denotes percentage changes in the second moment)

Notes: This table contains point estimates from the structural GARCH model, where denotes the change in the first moment of equity returns and denotes the change in the second moment of equity returns during the event window computed through daily return data. Estimation results are presented for the 25th, 50th and 75th percentiles in the sample to reflect the heterogeneity across the banks in our sample. The t-stats included in this table are robust and computed as described in Bollerslev-Wooldridge (1992).
Banks that perform poorly in stress test exercises experience, on average, a reduction in returns and an increase in volatility, while the reverse holds true for banks that perform well. The average estimated change in the first (returns) and second (volatility) moments is calculated for banks that are categorised in three groups, in terms of projected end-CET1 ratio. The sample of banks for each stress test is divided into: banks with a projected end-CET1 ratio above the 67th percentile of the distribution of banks as good performers; banks with a projected end-CET1 ratio below the 33rd percentile as bad performers; and banks with a projected end-CET1 ratio between the 33th and 67th percentiles as moderate performers. Concerning banks that perform moderately in stress tests, Chart 2 indicates that the disclosure of stress test results has a relatively small effect on both the mean and the variance process (blue and yellow bars respectively). By aggregating the estimates across the four stress test exercises, results show that banks that perform well during stress test exercises experience, on average, an increase in equity returns of 0.18 percentage points and a reduction in the variance process of 28%. While banks that perform poorly experience, on average, a decrease in equity returns of 0.80 percentage points and an increase in the variance process of 19%. This is comparable with the results of Table 1, while also bringing volatility into the picture.[13]
Chart 2
Average change in the first (blue, returns) and second (yellow, volatility) moments and in realised variance (red)
(x-axis: stress test performance per bank category (in terms of projected end-CET1 ratios), y-axis left-hand scale: average values for estimated coefficients (blue) and (yellow) in percentage point changes; right-hand scale: average percentage changes in realised variance (red dot))

Sources: Bloomberg, Refinitiv and authors’ calculations.
Note: This chart presents the average change in the first (blue, returns) and second (yellow, volatility) moment as estimated by the structural GARCH model for each category of banks (good, moderate, bad) after the 2014, 2016, 2018 and 2021 stress test publication. The red dot represents the average change in realised variance computed through five-minute intraday quoted data for each category of banks (good, moderate, bad) after the 2014, 2016, 2018 and 2021 stress test publications. Banks are categorised as good if they complete the stress tests with a projected end-CET1 ratio above the 67th percentile of the distribution of banks, and as bad if banks complete the stress tests with a projected end-CET1 ratio below the 33rd percentile of the distribution.
A possible explanation for our results may lie in the fact that stress test results are of special interest to shareholders. Bad (good) performance during the stress test exercises may increase (decrease) the probability of mandatory equity issuance, which sets shareholders at a disadvantage if stock dilution takes place (Georgescu et al., 2017). Another related explanation may be that the fundamentals of bad (good) performing banks were better (worse) than anticipated by shareholders, which was therefore priced in by markets during the days after the disclosure of the stress test results (Ellahie, 2012). Therefore, even if the bank risk profile is already reflected in the behaviour of stock markets, these results suggest that the new information provided by the publication of the stress test exercises have changed the informational environment in a tangible way such that both the returns and volatility of bank equity return series were impacted.
Realised variance after the publication of stress test results increases for banks that performed badly during stress tests but decreases for banks that performed well. To ensure that the findings from the GARCH specification are robust, consideration is also given to whether realised volatility is significantly higher or lower during the event window. The results depicted in Chart 2 (red dot) show that the realised variance increases (decreases) for bad (good) performing banks after publication of the stress tests.
4 Conclusions
A banking union was created in the euro area in 2014 to restore confidence in the banking system in the aftermath of the global financial and sovereign crises. Banking union, which has two pillars (the SSM and the Single Resolution Mechanism), was set up to ensure the soundness of the banking sector and a consistent supervision framework to address possible cross-country spillovers of financial stress. In this context, centralised stress tests have become an important tool for identifying potential vulnerabilities in the banking system, thereby informing supervisory evaluations and contributing to macroprudential policy discussions.
Overall, this analysis finds evidence that the disclosure of the EU-wide stress test results plays an important role in improving market discipline and thus restoring confidence in the banking system. The results show that stock markets react to the information disclosed following stress test exercises. Banks that perform among the best (worst) under the adverse scenario of a stress test experience, on average, a positive (negative) effect on their average equity return series, while the volatility of returns decreases (increases). The disclosure of stress test results has a larger impact in periods of greater uncertainty. Furthermore, the publication of the stress test results of more vulnerable banks leads to more sizeable market responses given that it generates more valuable information for investors.
The results of the analysis confirm the information and certification role of stress tests, enabling investors to assess more effectively the resilience of the banking sector, especially when there is greater opaqueness about its soundness. Stress tests play an important role in improving financial stability and restoring confidence in the banking system by enhancing market discipline and transparency and thus facilitating realistic risk pricing. The combination of both regulatory requirements and market discipline increases transparency and promotes financial stability.
References
Alves, C., Victor, M. and Silva, P. (2015), “Do stress tests matter? A study on the impact of the disclosure of stress test results on European financial stocks and CDS markets”, Applied Economics, Vol. 47, Issue 12, pp. 1213-1229.
Andersen, T.G., Bollerslev, T., Diebold, F.X., and Labys, P. (2003), “Modeling and forecasting realized volatility”. Econometrica, Vol., 71, Issue 2, pp. 579-625.
Bernanke, B. (2013), “Stress testing banks: what have we learned?”, speech at the “Maintaining financial stability: holding a tiger by the tail” financial markets conference sponsored by the Federal Reserve B, Speech 624, Board of Governors of the Federal Reserve System, 8 April.
Bollerslev, T. and Wooldridge, J. M. (1992), “Quasi-maximum likelihood estimation and inference in dynamic models with time-varying covariances”, Econometric Reviews, Vol. 11, pp. 143-172.
Candelon, B. and Sy, A. N. R. (2015), “How did markets react to stress tests?”, IMF Working Papers, WP/15/75, International Monetary Fund, Washington.
Durrani, A., Marques, P. A. and Ongena, S. (2022), “The certification role of the EU-wide stress testing exercises in the stock market: What can we learn from the stress tests (2014-2021)?”, Working Paper Series, Forthcoming, ECB, Frankfurt am Main, May.
Ellahie, A. (2012), “Capital market consequences of EU Bank Stress Tests”, Conference Discussion Paper, New York Federal Reserve Bank.
Engle, R.F. and Siriwardane, E. (2018), “Structural GARCH: the volatility-leverage connection”, The Review of Financial Studies, Vol. 31, Issue 2, pp. 449-492.
Flannery, M., Hirtle, B. and Kovner, A. (2017), “Evaluating the information in the federal reserve stress tests”, Journal of Financial Intermediation, Vol. 29, January, pp. 1-18.
Georgescu, O. M., Gross, M., Kapp, D. and Kok, C. (2017), “Do stress tests matter? Evidence from the 2014 and 2016 stress tests”, Working Paper Series, No 2054, ECB, Frankfurt am Main, May.
Glasserman, P. and Tangirala, G. (2015), “Are the federal reserve’s stress test results predictable?”, Office of Financial Research, Working Paper, No 15-02.
Goldstein, I. and Sapra, H. (2014), “Should banks' stress test results be disclosed? An analysis of the costs and benefits”, Foundations and Trends in Finance, Vol. 8(1), pp. 1-54.
Hirtle, B., Kovner, A., Vickery, J. I. and Bhanot, M. (2011), “Assessing financial stability: the capital and loss assessment under stress scenarios (CLASS) Model”, Journal of Banking and Finance, Vol. 69(1), pp. 535-555.
Kok, C., Müller, C., Ongena, S. and Pancaro, C. (2021), “The disciplining effect of supervisory scrutiny in the EU-wide stress test”, Working Paper Series, No 2551, ECB, Frankfurt am Main, May.
Peristian, S., Donald, P. and Savino, V. (2010), “The information value of the stress test and bank opacity”, Staff Report, New York Federal Reserve Bank, No 460.
Petrella, G. and Resti, A. (2013), “Supervisors as information producers: Do stress tests reduce bank opaqueness?”, Journal of Banking and Finance, Vol. 37, Issue 12, pp. 5406-5420.
Sahin, C., de Haan, J. and Neretina, E. (2020), “Banking stress test effects on returns and risks”, Journal of Banking and Finance, Vol. 117, August.
Smith, R.M. (2016), “L’exception française: why French banks dominate US repo trading”, Risk.net.
Tarullo, D.K. (2010), “Lessons from the crisis stress tests”, Remarks made to the International Research Forum on Monetary Policy, Federal Reserve Board, Washington D.C.
Tarullo, D. K. (2016), “Next steps in the evolution of stress testing”, Remarks at the Yale University School of Management Leaders Forum, Board of Governors of the Federal Reserve System, Washington, 26 September.
See, for example Sahin et al. (2020), Flannery et al. (2017), Georgescu et al. (2017), Petrella and Resti (2013), Alves et al. (2015), Kok et al. (2021), Bernanke (2013), Goldstein and Sapra (2014), Hirtle et al. (2011), Tarullo (2010, 2016), Peristian et al. (2010), Goldstein and Sapra (2014) and Sahin et al. (2020).
More formally, this can be expressed as follows: (1), where , and are abnormal, actual and estimated normal returns, respectively, for time step .
Stock market returns are modelled through a one-factor market model: (2), where , denote stock returns for bank and the market portfolio , respectively, and the parameters of the market model and the zero mean disturbance term. To proxy the market portfolio, Petrella and Resti (2013) is followed by using national stock market indices to ensure that residuals only include idiosyncratic effects. Coefficients a and b are estimated via an iteratively re-weighted least squares method to reduce the effect of extreme data points.
The panel regression model can be described as: (3), where denotes the projected end-capital ratio under the adverse scenario after a stress test, and a vector of control variables containing the logarithm of banks’ total assets and the leverage ratio.
For the mean specification, our study expands the specification used in (1) by introducing a dummy variable to control for abnormal stock return behaviour during the event window: . For the volatility process it is assumed that bank stock prices can be modelled as the product between (latent) asset volatility and a leverage multiplier. To directly measure the effect of stress test announcements on stock price volatility, an extended version of the structural GARCH model is applied, through an interaction variable . The final equation used can be described as follows: where , the demeaned return process and the information set at .
The sample of banks used in each stress test varies since the list of participating banks is slightly different in each exercise. As an example, banks from the United Kingdom were part of the 2014, 2016 and 2018 stress tests, but did not participate in the 2021 exercise owing to Brexit. In total, 53 banks are analysed, as detailed in Durrani et al. (2022). As showed in the paper, the sample of banks included in this study is representative of the entire set of tested institutions in each stress test, where the kernel distribution of the projected end-CET1 ratio under the adverse scenario is similar between this sub-sample and the full set of tested banks.
The event analysis in this box closely follows the approach proposed by Flannery and Kovner (2017).
Absolute cumulative abnormal returns are derived as the absolute value of cumulative abnormal returns. This yardstick is especially suitable for this exercise, as it makes it possible to avoid losing information due to positive and negative information effects cancelling each other. Indeed, this measure is large if investors react to the announcement, regardless of the distribution of positive and negative effects. The cumulative abnormal returns are computed exploiting a comprehensive set of data: (i) bank-level stock market prices and quotations of the main stock market indexes in euro area countries sourced from Bloomberg, (ii) the German 10-year government bond yield sourced from SDW, (iii) the iTraxx Europe Senior Financials 5-year Generic Index sourced from SDW, and (iii) the three Fama-French factors for European countries sourced from Kenneth French’s website. Cumulative abnormal returns are obtained using both a one-factor Capital Asset Pricing Model (CAPM) and a Fama-French three-factor model (FF), which are estimated using data for a 120 day pre-announcement period [t-130,t-10] and then exploited to calculate the expected returns for a 5-day interval around the announcement day [t-2,t+2].
As the EBA 2020 stress test exercise was cancelled as a result of the pandemic, the ECB conducted a centralised COVID-19 vulnerability analysis. The results of the exercise were published at aggregate level and later used for SREP purposes.
The 2014 Comprehensive Assessment conducted by the ECB was an exercise of unprecedented scope and depth. This stress test was a pass-and-fail exercise with a minimum capital threshold for the adverse scenario equal to a CET1 ratio of 5.5%.
Even when the results are weak, the disclosure of stress test results can have a positive impact if it is accompanied by credible contingency plans for financial institutions that are found to be weaker.
These findings are consistent with the results of Flannery and Kovner (2017) for the US stress tests.
As a crude computation, from Table 1 and for an end-CET1 ratio of 6.5 percent (as an average of bad performers banks) we have: (-3.89 + (0.35) x 6.5)/2 = 0.81 (for daily).