
Euro area and national quarterly financial accounts – 2019 quality report
Executive summary
This annual report provides a quality review of the quarterly euro area and national financial accounts.[1] The report fulfils the formal requirement for the Executive Board of the European Central Bank (ECB) to inform its Governing Council of the quality of these statistics, as set out in Article 7(2) of Guideline ECB/2013/24[2] (hereinafter the “ECB Guideline”). Furthermore, the report provides information supporting the Macroeconomic Imbalance Procedure (MIP) data quality assurance process as laid down in the “Memorandum of Understanding between Eurostat and the European Central Bank/Directorate General Statistics on the quality assurance of statistics underlying the Macroeconomic Imbalance Procedure” (“the MoU”).
The main principles and elements guiding the production of ECB statistics are set out in the ECB Statistics Quality Framework (SQF)[3] and quality assurance procedures, which are published on the ECB’s website. This report provides an analysis of the statistical output, covering the elements of: (i) methodological soundness; (ii) timeliness; (iii) reliability and stability; (iv) internal consistency (completeness and validation of accounting restrictions); and (v) external consistency with four other comparable statistical domains – quarterly non-financial sector accounts, balance of payments (b.o.p.) and international investment position (i.i.p.), monetary financial institutions (MFI) balance sheet items, and securities issues statistics.
The descriptive and quantitative indicators used throughout this report are based on quarterly data that are available in line with the European System of Accounts (ESA 2010). Data and revisions published up to 29 October 2019 are included. Supporting information tables and details of how the indicators are computed can be found in Annex 1 and Annex 2, respectively.
Given the specific MIP requirements, and the responsibilities entrusted to the ECB in the context of the MoU, the box at the end of the report presents some indicators relating to the fitness for purpose of the data for all EU countries. The box draws on data up to end-2018, as transmitted in October 2019, and focuses on data availability, revisions, and the sources and methods relevant for the financial accounts data underlying MIP indicators.
Statistical developments between 2018 and 2019
All euro area countries transmitted the mandatory data to the ECB and the data were generally timely and consistent. Countries provided quarterly supplementary data at t+85 and full national financial accounts data and metadata at t+97, as required by the ECB Guideline. The provision of the mandatory metadata by all countries, in all full national transmissions, is an improvement compared with results in 2018. Voluntary transmission of metadata by countries that do not usually exceed the thresholds set by the ECB Guideline is encouraged; this also applies to the supplementary transmission.
In terms of methodological soundness, the national financial accounts are generally consistent with the requirements and conceptual framework of the ESA 2010. However, the financial accounts statistics are derived statistics that rely on a wide range of data sources that are not necessarily complete or fully sufficient in terms of conceptual requirements. In such cases source data are supplemented with estimations or residual calculations, in order to ensure that the accounts are complete. Financial accounts data are, therefore, not necessarily the same as other datasets, and differences must be monitored and explained to users. The ECB encourages financial accounts colleagues to interact with their counterparts to reduce structural discrepancies and/or to reconcile differences between the datasets.
The methodological differences between the financial accounts and the b.o.p./i.i.p. statistics were removed with the introduction of ESA 2010 and the sixth edition of the International Monetary Fund’s Balance of Payments and International Investment Position Manual (BPM6). It is critical that all countries follow the agreed steps to ensure full consistency with b.o.p./i.i.p statistics.
Within the European System of Central Banks (ESCB) the Working Group on Financial Accounts (WG FA) and the Working Group on External Statistics (WG ES), along with other sub-structures of the Statistics Committee (STC), e.g. the Working Group on Monetary and Financial Statistics (WG MFS), are working closely together on the following common issues:
- securities held with non-resident custodians that are not covered by national securities holdings statistics;
- coverage of the other financial institutions (OFI) sector and, in particular, the timely coverage of special-purpose entities (SPEs), given the lack of primary statistics;
- coverage of financial derivatives for all sectors, owing to missing data sources and/or counterpart sector details.
In addition to the collaborative work listed above, the WG ES and WG FA established a joint group on the valuation of unlisted shares and other equity in January 2020.In the third quarter of 2019 13 euro area countries implemented benchmark revisions in financial accounts data, to enhance a common European revision policy in accordance with the recommendations of the 2017 final reports of the Directors of Macroeconomic Statistics (DMES) Task Force on Benchmark Revision Policy[4], and the Task Force of the Committee on Monetary, Financial and Balance of Payments Statistics (CMFB) on Harmonised Revision Policy[5]. Three euro area countries already implemented benchmark revisions in 2017 or 2018, and another will do so in 2020. These revisions mainly sought to:
- introduce new data sources;
- improve existing data sources and estimation methods;
- better align with b.o.p./i.i.p. and government sector data;
- incorporate improvements resulting from the GNI statistical verification process.
A new breakdown of the MFI sector data into the categories “central bank subsector” and “other MFIs” was published for the euro area and euro area countries in 2019. The preparation of these data also led to some improvements in MFI sector data, e.g. improvements in the valuation of other equity.
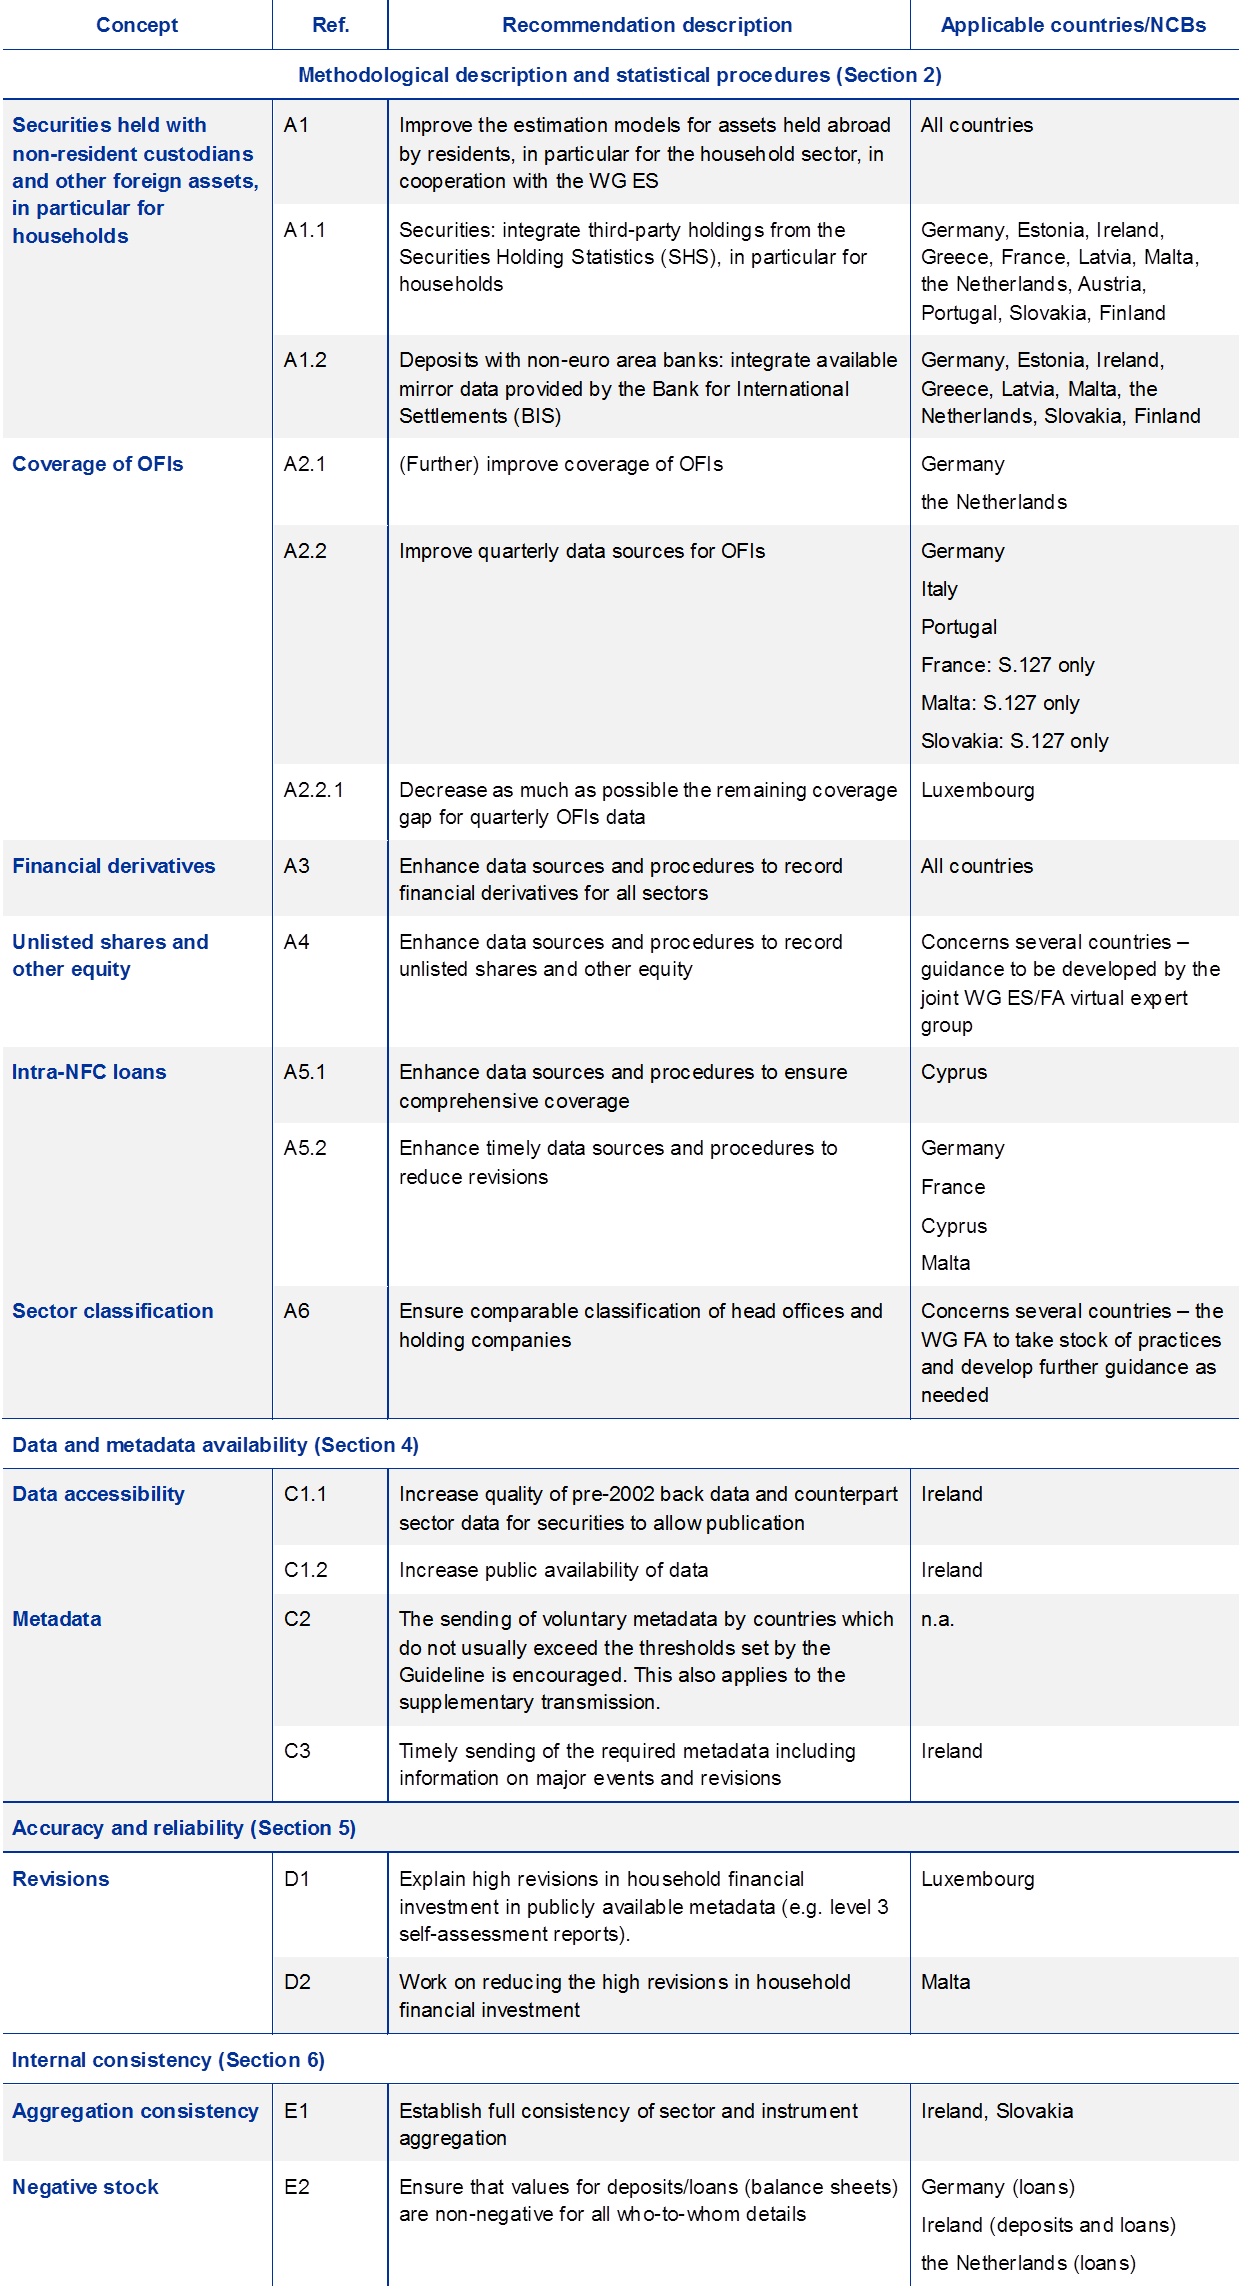
Known methodological issues and coverage gaps are shown in Table 1. The information is based on the regular data validation in the quarterly production rounds, discussions in the WG FA and the WG ES, and the CMFB “level 3” quality reports that provide a self-assessment of national sources and methods.
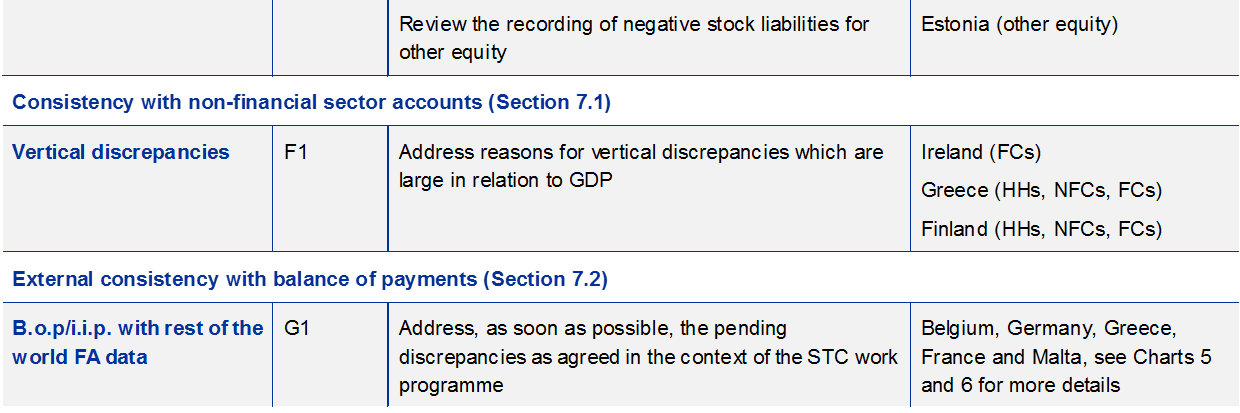
Vertical consistency – i.e. consistency with non-financial sector accounts – is a further issue with scope for improvement, requiring cooperation between financial accounts compilers and non-financial accounts compilers. Vertical discrepancies are particularly large in relation to GDP in Ireland, Greece and Finland.
On the basis of this report, a list of notable issues affecting euro area countries, as well as the scope for improvement, is provided in Table 1 below.
Notable issues and scope for improvement (for euro area countries)
Statistical issues affecting MIP indicators
The ECB, in collaboration with Eurostat, has continued to monitor specific quality aspects of the statistical outputs, as required under the MoU. Given that the financial accounts are an integrated statistical accounting framework, most of the issues mentioned in the report are also relevant for assessing the quality of the data for MIP purposes. Furthermore, there are certain issues which affect the MIP data directly. In particular, items A5, A6, D1 and D2 are important for private sector debt and credit flows, while items A2, A3, A4, A6 and G1 are important for financial sector liabilities.
One area where the compilation of the financial accounts data underlying the MIP indicators is particularly affected by limited data sources is the coverage of financial sector liabilities, in particular for SPEs and, more generally, OFIs, for which there are usually no timely and comprehensive source statistics available. Assessing and, where necessary, improving the quality of data for OFIs is a priority in the work on financial accounts. There are issues in many EU countries, pertaining to the coverage and quality of the statistics for OFIs, despite recent improvements as part of the benchmark revisions made in 2019 (and in the years before in some countries where these entities are particularly significant).
Cross-checking with business registers, or the use of other methods to ensure full coverage, should be improved in Germany, the Netherlands and Poland. In Croatia and Sweden, it is difficult to determine the coverage for particular OFI sub-sectors, groups of entities or instruments from the existing data sources, which indicates that the source data require specific improvements.
In most countries, quarterly and annual financial accounts are fully consistent (see Annex 1, Table 1.2.2). Vintage differences may occur, as not all countries update their annual data on a quarterly basis. Countries are encouraged to ensure that quarterly and annual data are consistent, in particular for data vintages used for MIP purposes in October of each year. Differences are relatively large in Ireland, Slovakia, the Czech Republic, Denmark and the United Kingdom. In countries where the national central bank (NCB) is responsible for the quarterly financial accounts and the national statistical institute (NSI) is responsible for the annual frequency, close cooperation between the two institutions usually means that differences can be minimised.
For MIP purposes the focus is on data for the last ten complete years. This data range is available for all EU countries except Denmark and Croatia – these two countries are encouraged to increase the length of the relevant time series.
Last but not least, the analysis shows that discrepancies between b.o.p./i.i.p. statistics and financial sectoral accounts persist for several countries. This negatively affects the analytical combination of the two datasets and signals a lack of reliability or adequacy of the methodology of at least one of the two statistics. Despite this, the situation has improved compared to the previous quality report, in part due to the benchmark revisions.
For more information on assessing data quality for MIP purposes, please see the MIP box at the end of the main body of this report.
1 Introduction
This annual report provides a quality review of the quarterly euro area national financial accounts.[6] It fulfils the formal requirement obliging the ECB Executive Board to inform the Governing Council of the quality of these statistics, as set out in Article 7(2) of the ECB Guideline.[7] Furthermore, the report is intended to provide information supporting the MIP data quality assurance as laid down in the MoU. The report follows the recommendations adopted by the CMFB with regard to the harmonisation of the “level 2” quality report for b.o.p./i.i.p. statistics.[8]
The focus of the report is on national data for 19 euro area countries and euro area aggregates. The data for all EU Member States (EU28) are commented on in the MIP box at the end of the report and are also available in the annexed tables.
1.1 Scope of data coverage and structure of the report
This report analyses a number of aspects by which data quality can be measured. These include: (i) a review of methodological issues where national compilers diverge from statistical standards or need to enhance statistical procedures; (ii) an assessment of compliance by NCBs with their obligations to transmit data to the ECB, in terms of timeliness and coverage; (iii) the reliability of the statistical data; (iv) the internal consistency of the statistics; and (v) external consistency with other statistical domains/datasets (i.e. with non-financial sector accounts and b.o.p.) and comparisons with related financial statistics (i.e. MFI balance sheet statistics and securities issues statistics).
The analysis focuses on the quarterly financial accounts data transmitted and published in 2019. The dataset available as of 29 October 2019 was used throughout the report and, the main body of the report only addresses the quality of data for the 19 countries of the euro area.
Given the specificities of the MIP process, some indicators on the fitness for purpose of the data are presented in a box at the end of the report for all European Union Member States. The box draws on data up to end-2018 as transmitted in October 2019 and revisions up to end-2017 and focuses on (i) data availability, (ii) revisions, (iii) consistency with non‑financial sector accounts and sources and methods relevant for the financial accounts data underlying the MIP indicators, i.e. MIP-relevant quality dimensions. All indicators presented in the MIP box relate to the national GDP or outstanding amounts and are intended to facilitate the analysis relating to the actual MIP scoreboard indicators.
2 Methodological soundness and statistical procedures
The national financial accounts are generally consistent with the requirements and conceptual framework of ESA 2010. However, the financial account statistics are derived statistics that rely on a wide range of data sources, which are not necessarily complete or sufficient in terms of conceptual requirements. In such cases source data are supplemented with estimations or residual calculations in order to ensure the accounts are complete. An overview of the known methodological issues and coverage gaps is provided in Table 1 in the Executive summary. The information is based on the regular data validation in the quarterly production rounds, discussions in the Working Group on financial accounts (WG FA) and the CMFB “level 3” quality reports that provide a self-assessment of the national sources and methods.
Issues that concern many or, in some cases, all countries are described below. The WG FA has agreed on a work plan to share best practices and develop guidance for these issues by 2019/2020.
2.1 Assets held abroad
The WG FA, in cooperation with the WG ES, continued the work on estimating the value of households’ assets held abroad, and broadly agreed on recommendation regarding the further development and use of data sources. Deposits with non-resident banks and securities held with non-resident custodians, as well as real estate owned in other countries were identified as the main issues.
For a complete coverage of deposits held by households with non-resident banks, balance sheet statistics from other euro area countries and the BIS Locational Banking Statistics are valuable sources. Therefore, NCBs are encouraged (i) to report the breakdown vis-à-vis households by counterpart country to the BIS, and (ii) to integrate available mirror data (reported by other NCBs) provided for their country and incorporate this information in their national data when appropriate. This has not yet been implemented in Germany, Estonia, Ireland, Greece, Latvia, Malta, the Netherlands, Slovakia and Finland.
For securities held with non-resident custodians, the national Securities Holding Statistics (SHS) should be complemented with data on residents’ securities holdings with custodians in other euro area countries and custodians outside the euro area. Holdings with custodians in other euro area countries are obtained from the third-party holdings of the euro area SHS and are increasingly integrated into the national data of the euro area countries. Germany, Estonia, Ireland, Greece, France, Latvia, Malta, the Netherlands, Austria, Portugal, Slovakia and Finland have not yet integrated the third-party holdings from SHS in data for the households sector.
2.2 Coverage of other financial institutions
Owing to the heterogeneity of OFIs, substantial parts of the OFI sector are not covered by euro area-wide statistical reporting requirements under ECB regulations. The WG FA has continued to share information on ways of ensuring the comprehensive and timely coverage of OFIs. While most countries have developed national surveys and other data sources, albeit to varying degrees, it remains a challenge to ensure that the data for the OFI sector has full coverage and is of high quality. A special questionnaire was administered by the WG FA in 2018 to gather information on the quality of the financial accounts for OFIs, and NCBs have provided updates on the sources and methods used in the 2019 CMFB “level 3” quality reports. A joint survey to explore data sources for the largest subsector – captive financial institutions and money lenders (S.127) – was launched in November 2019 by the STC working groups WG MFS, WG FA and WG ES (results are expected for 2020 H1).
It is important to identify the complete population of existing entities in a country to report comprehensive data for OFIs. This may be done via the information in business registers, which means these need to be complete and accessible by statistical compilers, and other comprehensive databases (e.g. balance sheet databases). Cross-checking with business registers or the use of other methods to ensure full coverage should be improved in Germany. The Netherlands has already a high coverage and work is ongoing to complete coverage.
Another common issue is the availability of timely quarterly data sources for OFIs that are suitable for compiling the financial accounts. Direct data sources are needed for instruments not covered by counterpart sector information (e.g. unlisted shares and loans). Germany, Italy and Portugal are encouraged to improve their quarterly direct data sources; in France, Malta and Slovakia this recommendation is only relevant for the captive financial institutions subsector (S.127).
When quarterly data coverage is not complete for certain OFI sub-sectors, groups of entities or instruments, full coverage may be achieved by estimating or grossing-up the missing data using information obtained from existing annual data sources. Luxembourg is encouraged to improve its coverage and grossing-up method.
2.3 Financial derivatives
It is particularly difficult to achieve coverage of financial derivatives for sectors not covered by direct statistical reporting requirements, i.e. the private sectors and large parts of the OFI sector, as these are generally not covered by custodian statistics. Financial accountants therefore generally rely on counterpart sector information, which may not provide sufficient information. In October 2018, a joint WG FA-WG ES Task Force on Financial Derivatives was formed with a mandate to issue recommendations on data sources and data collection and compilation methods. The Task Force is scheduled to provide its guidance in 2020.
2.4 Unlisted shares and other equity
Data sources for unlisted shares and other equity are incomplete in many countries, as corporate balance sheet databases may not fully cover privately-held corporations or quasi-corporations. Even when corporate balance sheet data are available, it is difficult to value unlisted shares and other equity in the absence of comparable corporations issuing listed shares. In 2019 the WG FA undertook a stocktaking exercise and prioritised work streams on data sources, market value estimation, derivation of transactions and other changes, as well as on the distinction between unlisted shares and other equity. This work is to be continued by a joint WG FA and WG ES virtual group in 2020-21.
2.5 Intra-non-financial corporation loans
Most countries lack a comprehensive and timely quarterly data source for loans between resident non-financial corporations (NFCs). Countries typically combine annual information from corporate balance sheet databases and business registers with more timely survey data and quarterly estimates, and the WG FA developed guidance for the comprehensive coverage of intra-NFC loans in 2011-12. Several countries do not have a fully comprehensive direct data source or access to business registers facilitating the grossing-up procedures needed to achieve full coverage of intra-NFC loans. Cross-checking with business registers or the use of other methods to ensure full coverage should be improved in Cyprus. Another common issue is the availability of timely quarterly data – Germany, France, Cyprus, and Malta are encouraged to improve their timely direct data sources in order to reduce the revisions needed when comprehensive data become available.
2.6 Sector classification of head offices, holding companies purpose entities
ESA 2010 introduced a change to the sector classification of head offices, holding companies and SPEs, which also affects the sector- delineation of the financial and non-financial corporation sector. The WG FA agreed that in the context of the breakdown of OFIs by ESA sector, proposed as part of the medium-term strategy for financial accounts, further guidance is needed to ensure the harmonised recording of the head offices, holding companies and SPEs. A joint note for captive financial institutions and money lenders (S.127) and SPEs was launched in November 2019 by the STC working groups WG MFS, WG FA and WG ES; this work will continue in cooperation with the OECD and the IMF During the benchmark revision in 2019, Spain implemented improvements in the classification of the SPEs issuing securities, and of holding companies.
3 Timeliness and punctuality
The ECB Guideline[9] requires two transmissions: (i) the transmission of a sub-set of supplementary financial accounts data at t+85 to enable compilation of an integrated set of quarterly euro area financial and non-financial accounts, and (ii) the transmission of the full set of national financial accounts data at t+97.
All euro area countries transmitted the supplementary data and the full set of national data by the respective deadlines.
Table 2 shows the dates of the financial accounts transmissions and data releases. National data are released by the ECB at t+108. NCBs follow their own release policies.
Transmission and release dates in 2018 and 2019 for euro area aggregates and country data
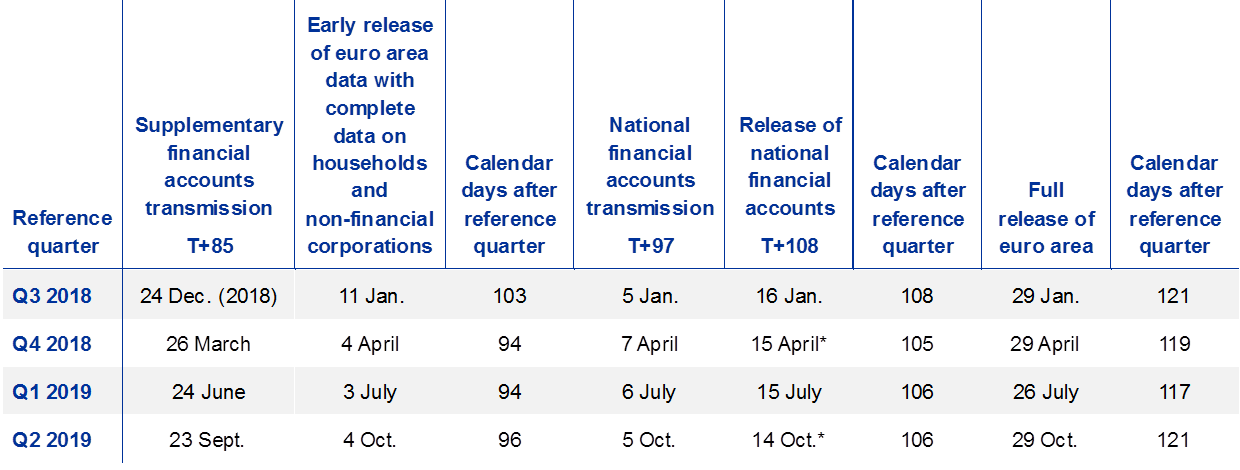
* Excluding the general government sector.
4 Data and metadata availability
4.1 Completeness
The data transmissions were complete, except for one minor issue which did not affect the compilation of either the euro area accounts or the MIP indicators. In the full national accounts data transmission for Q4 2018 (t+97), Ireland did not transmit the data by the deadline due to technical issues.
The provision of metadata covering revisions and major events governed by the Guideline was good and improved further in 2019 in comparison with 2018. All countries regularly delivered metadata on revisions and major events, although Ireland was late transmitting the metadata for Q4 2018. Ireland started to provide the metadata related to revisions with the Q2 2019 data transmission. The voluntary transmission of metadata by countries which do not usually exceed the thresholds set by the Guideline is encouraged. This also applies to supplementary transmission.
4.2 Accessibility
Accessibility refers to the conditions by which users can obtain, use and interpret data. This ultimately reflects how straightforward it is to access the data and the extent to which confidentiality constraints do not allow certain data to be shared.
The ECB publishes euro area aggregates for transactions, outstanding amounts and revaluations for all euro area aggregates. With regard to counterpart sector details, information is published on transactions and outstanding amounts for deposits, loans, debt securities, listed shares and investment fund shares. Revaluations are published for the holdings of listed shares and debt securities of the main resident sectors.
The ECB also publishes the national data made available by the NCBs. These include all transactions and outstanding amounts, revaluations for listed shares and debt securities, as well as domestic counterpart sector details.
The publication of national data by the ECB is stipulated in Article 3(2) of the ECB Guideline, which requires the publication of all quarterly national financial accounts data except for the counterpart sectors “resident in other euro area countries” and “outside the euro area”.[10]
In line with this legal framework, all data must be sent to the ECB and their confidentiality level must be flagged. Table 3 summarises the share of the time series marked as “free for publication” as the proportion of the time series stipulated by the ECB Guideline to be published. Two datasets are distinguished. The transmission of the first, “core” dataset has been mandatory since October 2014 and comprises assets and liabilities by institutional sector (Guideline Annex Tables 1 and 2) as well as the who-to-whom (or “counterpart sector”) tables for deposits and short-term and long-term loans (Guideline Annex Tables 3 to 5). A minimum range of back data, starting from reference quarter Q4 2012, has been mandatory since October 2014. Additional back data (Q1 1999-Q3 2012) became mandatory with the October 2017 transmission. The second dataset comprises the counterpart sector details for securities (Guideline Annex Tables 6 to 9), starting from the first reference quarter Q4 2013; its transmission became mandatory in September 2016.
Share of observations marked as “free for publication” per dataset for euro area countries, in percentages
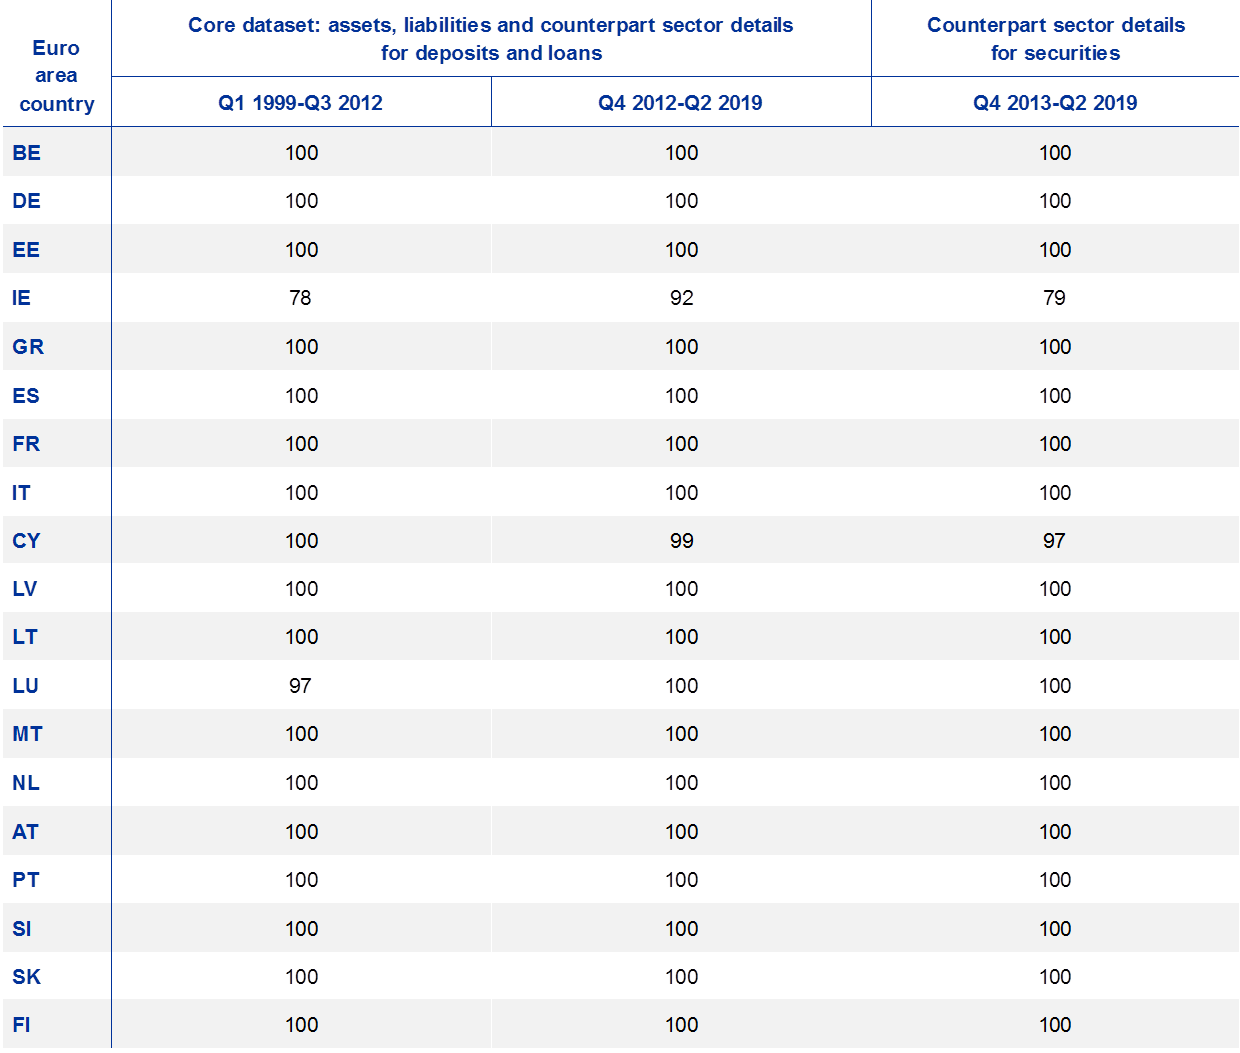
Most euro area countries make the entire datasets publicly available by transmitting and publishing them to the ECB’s Statistical Data Warehouse. Ireland releases only 79% the required counterpart sector details for securities – this is a deterioration compared with last year’s report. Furthermore, only 78% of the observations relating to the additional back data for the core dataset are fully available because parts of the data prior to Q1 2002 – and the separate household and non-profit institutions serving households (NPISH) sub-sectors from Q4 2012 – are flagged as “not for publication”. In addition, the accessibility of the core data set has decreased to 92% compared with the last year’s report (from 98%). In the case of Cyprus, the partial unavailability of more recent data and counterpart sector details is due to primary and secondary confidentiality constraints in the b.o.p. and i.i.p. source data. The slight reduction in the publication of back data for the core dataset for Luxembourg (for insurance corporations and pension funds sub-sectors and counterpart sectors) remains present in 2019, owing to confidentiality constraints.
A new breakdown of the MFI sector into the central bank subsector and other MFIs was published for the euro area and the countries in 2019, improving the accessibility of additional financial accounts data to the users.
In the framework of the G20 Data Gaps Initiative, in particular following up on the work of the Task Force on International Data Cooperation, the ECB facilitates the sharing of quarterly financial accounts data of the EU countries with other international organisations, such as the OECD, IMF and World Bank.
4.3 Clarity
Clarity refers to the “information environment” of the data, i.e. whether the data are accompanied by relevant and pertinent metadata, illustrations (such as charts), information on their quality and potential usage limitations, and background information (such as sources and methods).
The availability of background information on sources and methods considerably enhances the usability and clarity of the data.
The ECB publishes two press releases per quarter, outlining the latest data and relevant economic developments, on the ECB’s website. The dissemination dates for all press releases are announced at the beginning of each calendar year in the ECB’s statistical calendars.
The concepts and definitions used in the quarterly financial accounts are in line with international statistical standards and, in particular, ESA 2010. Background information explaining the link between the financial accounts and the non-financial accounts, and providing further methodological information, is available via the sector accounts section of the ECB website.
The euro area aggregates and the national data can be accessed via the ECB’s Statistical Data Warehouse or in the section in the Statistics Bulletin on sector accounts. Furthermore, the ECB publishes a large set of euro area and country charts for the household sector in its quarterly Household Sector Report.
The ECB has a Statistical Information Request facility for external statistics users which helps them access and analyse the data.
A sub-set of the statistics produced under the ECB Guideline[11] can also be accessed via the euro area statistics website. This website aims to facilitate the understanding, use and comparison of euro area and national statistics by presenting the statistics in a user-friendly manner. The website also allows who-to-whom data to be easily viewed in interactive graphics which can be downloaded to other websites, in emails or on social media.
This quality report on financial accounts is published every year starting from 2018. Quality reports on euro area data were previously published on a two-yearly basis.
Table 1.1.1 in Annex 1 presents a summary of the national practices regarding data and metadata accessibility. All euro area countries allow users to download data in different formats. Belgium, Germany, Estonia, Ireland, Spain, France, Cyprus, Lithuania, the Netherlands, Portugal and Finland have a quarterly press release. Most euro area countries (except Greece and Luxembourg) have Statistical and/or Economic Bulletins that provide a visual representation of the data in the form of charts, graphs and tables. Countries should strive to provide a single point of contact for queries from data users – this feature is not yet available in Slovakia.
The CMFB “level 3” quality, or “self-assessment”, reports that provide metadata on national financial accounts (including descriptions of compilation practices, sources and methods) are published on the national websites and/or the CMFB’s website. The CMFB website's section on quality assurance of statistics underlying the MIP Scoreboard provides links to the reports from all EU countries. The reports were updated by all countries, except Ireland, during 2019.
5 Accuracy and reliability
This section reviews the stability of the data in terms of revisions to the initially compiled data (“first assessment” or “first vintage”). In general, revisions are needed to improve the accuracy of the data, as an initial assessment may be based on incomplete, late or erroneous responses from reporting agents. However, large recurrent revisions may indicate that the data collection and/or compilation process is of comparatively low quality – a situation which needs to be addressed. On the other hand, if there are minimal or no revisions this does not necessarily mean that the first assessment was of high quality – it may simply indicate a national preference for not revising the data.
In this report, revisions for all euro area countries and for the euro area as a whole are assessed using indicators based on a comparison between the initial and the final assessment. Two basic types of indicators are used (more detailed information on revision indicators is available in Annex 1).
- Relative size indicators measure the absolute differences between the first and the most recent data vintages. The absolute differences may be quantified relative to the underlying series when strictly positive or, otherwise, to a reference series such as GDP or underlying outstanding amounts. These indicators are the symmetric mean absolute percentage error (SMAPE) and mean absolute revisions shown as a percentage of GDP. In the case of transactions, revisions cannot be properly related to the series value itself because the observations may have different signs or the value of the series may often be close to zero. Therefore, absolute revisions in transactions are related to the underlying outstanding amounts or to an individual country’s GDP.
- Directional stability and reliability indicators measure how frequently initial assessments are revised in the same direction and whether the direction of change indicated by the initial assessment has correctly predicted the direction of change in the most recent data vintage.
All revision indicators are calculated using quarterly data for reporting periods from Q2 2017 to Q1 2019 for national and euro area aggregates, as shown in the charts throughout this section. The analysis focuses on the main financial accounts indicators, as commented on in the ECB’s euro area accounts press releases in relation to household financial investment, as well as household and non-financial corporation financing. Financial sector liabilities are also presented, as they are the basis for the third MIP headline indicator. The revision indicators are shown for euro area aggregates and country data. The median values for the countries are presented to facilitate a comparison across countries. Detailed tables containing SMAPE, upward revisions and directional reliability indicators for the euro area aggregates and all EU countries are available, for information purposes, in Annex 1. When comparing revisions of country data and euro area aggregates, due consideration should be given to the fact that offsetting revisions in country data may imply lower revisions at euro area level.
5.1 Household financial investment and loan financing
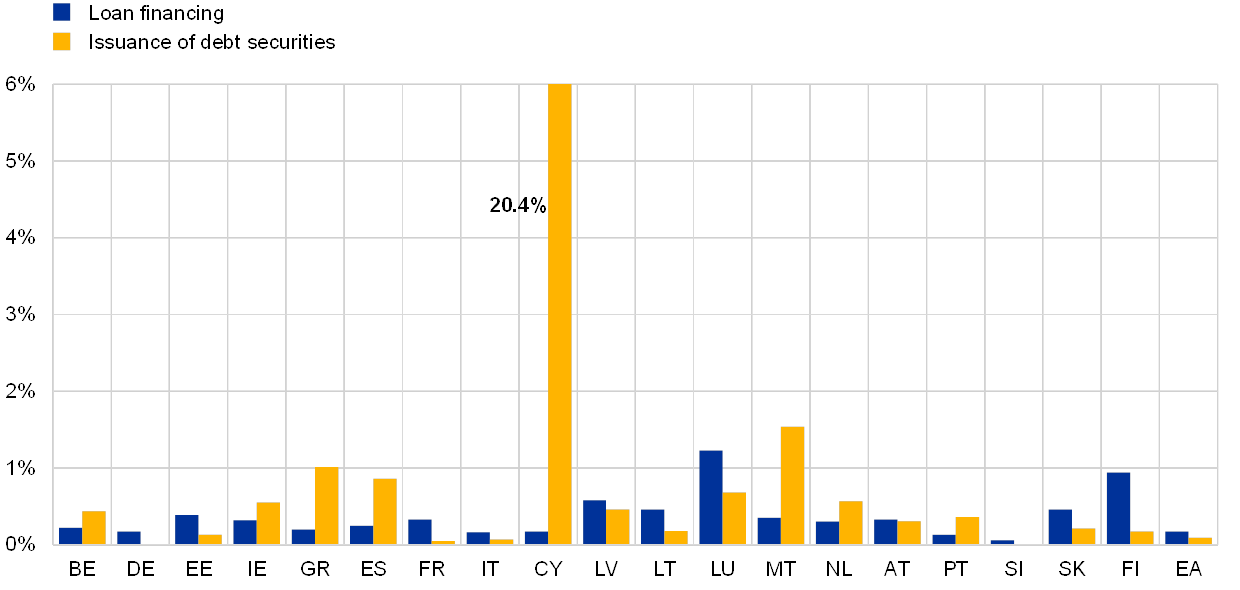
Revisions to household financial investment were more pronounced than revisions to households loan financing in all euro area countries, except in Belgium, Ireland, Greece, the Netherlands, Austria and Finland, as can be seen in Chart 1.
Euro area household financial investment (transactions) recorded revisions that are lower than the median for revisions of euro area countries. Directional reliability (Annex 1, Table 1.3.4) was 88%. Cyprus, Latvia, Luxembourg, Malta and Slovenia revised household financial investment data more extensively than other countries, mainly in order to include additional or improved data sources and estimations, to reduce vertical discrepancies, or to ensure consistency between rest of the world (RoW), and b.o.p./i.i.p. In Luxembourg this was mainly the result of a one-off large revision in the equity liabilities of NFCs. The median for all euro area countries for the reference period was 0.1%. Furthermore, Cyprus, Luxembourg, Malta and Slovenia showed levels of directional reliability of below 70%, and Luxembourg data were revised mostly upwards (75% upward revision ratio).
Euro area household loan financing (transactions) recorded a lower level of revisions compared with the euro area countries’ median and directional reliability of 100%.
Malta and Luxembourg recorded a higher level of revisions of households loan financing compared with other euro area countries mainly due to revisions in data sources – the median of all euro area countries for the reference period was 0.02%. Directional reliability was below 70% for both countries, with a balanced distribution of upward and downward revisions.
Revision to household financial investment and loan financing (transactions)
(symmetric mean absolute percentage error (SMAPE), Q2 2017-Q1 2019)

Note: EA = euro area.
5.2 NFC financing
Of the components of NFC financing, the net issuance of debt securities was revised more than loan financing in eight euro area countries, as can be seen in Chart 2.
For both loans and debt securities the euro area as a whole exhibited a slightly lower level of revisions than the median for euro area countries. Directional reliability was 100% for debt securities and 88% for loan financing. For the net issuance of debt securities, revisions were particularly high for Cyprus, with values of below 70% for directional reliability. For Cyprus, the large amount of revisions in percentage terms was due to very low absolute values of securities issuances, so the directional reliability indicator is less informative.
Luxembourg and Finland recorded higher revisions to NFC loan financing than the other euro area countries, while the directional reliability indicator was below 70% in Finland.
Revisions to NFC financing (transactions)
(symmetric mean absolute percentage error (SMAPE), Q2 2017-Q1 2018)
Note: EA = euro area.
5.3 Financial corporation liabilities
With regard to revisions to financial corporation (FC) liabilities (stocks), the euro area as a whole recorded revisions of 0.8% of the underlying stocks during the period observed, which is higher than the 0.4% median for the euro area countries, as a large number of countries recorded lower than average revisions (see Chart 3). Revisions for all FC sub-sectors were relatively low, with the highest revisions in the OFI sector, for which the aggregated euro area revisions were 2.8% (while the euro area median was 1.6%). Directional reliability for euro area FC liabilities stood at 100%.
Revisions for FC liabilities were exceptionally high for Cyprus, due to the significant increase in the SPE coverage following the improvements implemented in the benchmark revision in September 2019, and above 1% in Estonia, Greece, Luxembourg, Malta and the Netherlands. Revisions were higher overall for total FC liabilities and OFI liabilities than the data reported for most countries in the previous Quality Report in June 2019. Directional reliability was only below 70% in the case of Cyprus and Luxembourg. Luxembourg consistently revised all first releases upwards, which was explained by ongoing improvements in the coverage of SPEs, while the Netherlands consistently revised all first releases downwards, which was explained by the reclassifications of a large number of OFI entities to the NFC sector in the benchmark revision in 2018. Revisions to OFI liabilities were high in about half of the euro countries (see Chart 3) and were therefore a main driver of revisions to overall FC liabilities. They were especially high in Finland, due to revisions to the b.o.p. data.
Revisions to financial corporation liabilities (stocks)
(symmetric mean absolute percentage error (SMAPE), Q2 2017-Q1 2019)

Note: EA = euro area.
Detailed tables containing SMAPE, upward revisions, directional reliability indicators and mean absolute revisions as a percentage of GDP for all EU countries are available in Annex 1.
6 Internal consistency
Internal consistency refers to accounting identities and to hierarchical relationships between aggregates and components.[12] This includes horizontal consistency, which is defined as equality between the sum of (transactions in) financial assets and the sum of (transactions in) liabilities for each financial instrument (i.e. the sum of listed shares issued by the resident sectors and the RoW equals the sum of listed shares purchased by the resident sectors and the RoW).
The euro area accounts are not a simple aggregation of the national data, as they need to be combined with other euro area statistics (in particular euro area b.o.p., i.i.p. and MFI balance sheet statistics) to obtain genuine euro area accounts. Horizontal consistency is not generally maintained when all these components are put together, owing to discrepancies across data sources. The resulting imbalances between assets and liabilities for each transaction are then resolved by leaving data from the most reliable sources unchanged and amending data from less reliable sources, as appropriate.
The apparent horizontal imbalances (before data sources are reconciled) in the euro area financial accounts continued to be significant. The two underlying causes of this are b.o.p./i.i.p. asymmetries[13] as well as differences between national financial accounts data and euro area building blocks. The latter occur mostly because national financial accounts compilers may adjust the statistics underlying the euro area building blocks or may use different data sources. For example, loans granted by MFIs to general government, as recorded in the financial accounts, may differ from the data in MFI balance sheet statistics because financial accounts compilers use government finance statistics. These are assumed to provide higher-quality identification of the borrowing entities classified in the government sector (while reporting MFIs may sometimes misclassify entities such as local utility service providers as part of government).
Table 4 shows the euro area horizontal imbalances resulting from the combination of the various data sources, i.e. before the balancing process in the 29 October 2019 release.
Internal consistency of input data for the euro area accounts by financial instrument
Horizontal imbalances
(root mean squared error (RMSE); EUR billions)
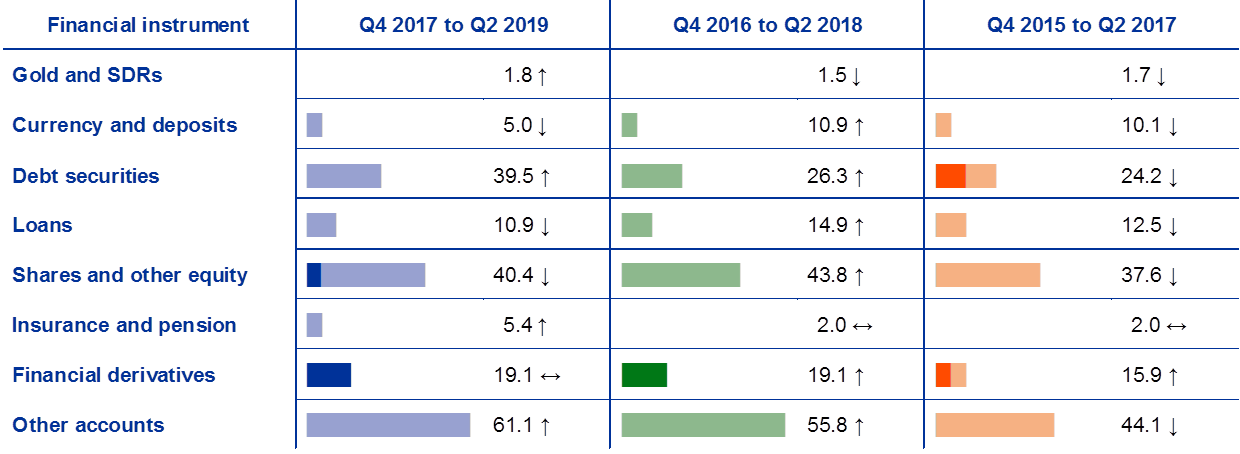
Note: RMSE is broken down into bias component █ and variance component █, Increase (↑), no change (↔) and decrease (↓) in the indicator compared with its value one year ago.
The inconsistency of euro area aggregates before balancing increased for half of the instruments (four increased, one remained unchanged and three decreased) compared with the transmissions in the same quarters one year previously (second column). The inconsistencies averaged out over time for all instruments except financial derivatives, and to a smaller extend shares and other equity. The inconsistency of financial derivatives is biased owing to an excess of liabilities over time, which stems from the larger net liabilities vis-à-vis the rest of world recorded in the national financial accounts compared with the euro area balance of payments (see also Section 7.2).
The national financial account datasets as transmitted to the ECB (i.e. the country datasets after balancing by national compilers) are internally consistent, except for minor issues that do not affect the main indicators.[14] Some internal inconsistencies remain related to aggregation checks for Ireland, mostly for other changes in volume and Slovakia for loans and equity transactions[15] (see Annex 1 Table 1.2.1).
Ireland reported a number of who-to-whom series with negative stock (balance sheet) data for deposits (two) and loans (five). Germany and the Netherlands reported negative stock data for who-to-whom time series for loans (two each).
Estonia reported one other equity series with negative values in line with the data recorded in external statistics (i.i.p.). The recording is consistent with the b.o.p./i.i.p. statistics as the data are affected by recording of negative equity related to foreign branches of domestic companies. This issue may be tackled by the joint WG FA and WG ES virtual group on unlisted shares and other equity.
7 External consistency/coherence
7.1 Coherence with non-financial sector accounts: verbal consistency
The ECB, in cooperation with Eurostat, produces integrated financial and non-financial accounts which are published as the quarterly euro area accounts. Full coverage of instruments facilitates the compilation of the balancing items net lending/net borrowing (from the non-financial accounts) and net financial transactions (net acquisition of financial assets minus the net incurrence of liabilities, or net lending/net borrowing as derived from the financial accounts). It also enhances “vertical reconciliation” (equal balances for financial and non-financial accounts), both within euro area institutional sectors and with regard to the RoW. Currently, the euro area accounts comprise fully vertically integrated data for the FC and general government sectors while, for the NFC and household sectors and the RoW, there are vertical discrepancies between the financial and the non-financial accounts.
Vertical imbalances arise because different data sources are used for the compilation of the financial and the non-financial accounts. The discrepancy for the RoW is closely related to the “net errors and omissions” stemming from the b.o.p. For the euro area accounts, the vertical discrepancies resulting from the national data and euro area building blocks are reduced (and are completely eliminated in the case of FCs and government) by the effect of source selection criteria (which is sensitive to consistency considerations) and data adjustments made on the basis of expert judgement and mathematical methods.
At country level, the practices for vertical reconciliation vary. Some countries have established similar policies to eliminate the discrepancies, e.g. by adjusting financial and/or non-financial items for which the data sources are considered to be incomplete or of poor quality, while others do not make such full “reconciliation” adjustments to preserve the information from the respective data sources. All countries, however, are seeking to reduce the sources for discrepancies, by improving source data and balancing processes. Furthermore, joint discussions by non-financial and financial account compilers at national and European level (WG FA and the Expert Group on Sector Accounts) address the topic, with the objective of developing, by end-2020, first recommendations for vertical reconciliation practices.
The charts below present the vertical discrepancies for the resident private sectors. For countries with a GDP of below 1% of the EU total, the transmission of quarterly non-financial sector accounts is not mandatory for resident sectors other than government. The vertical consistency of quarterly data cannot, therefore, be assessed for Estonia, Cyprus, Latvia, Lithuania, Luxembourg, Malta and Slovakia, while Slovenia provides quarterly data on a voluntary basis. As regards Ireland, the comparison refers to the quarterly financial accounts compiled by the NCBs, while noting that the annual financial accounts compiled by the NSIs may yield different results for vertical consistency than the ones shown below.
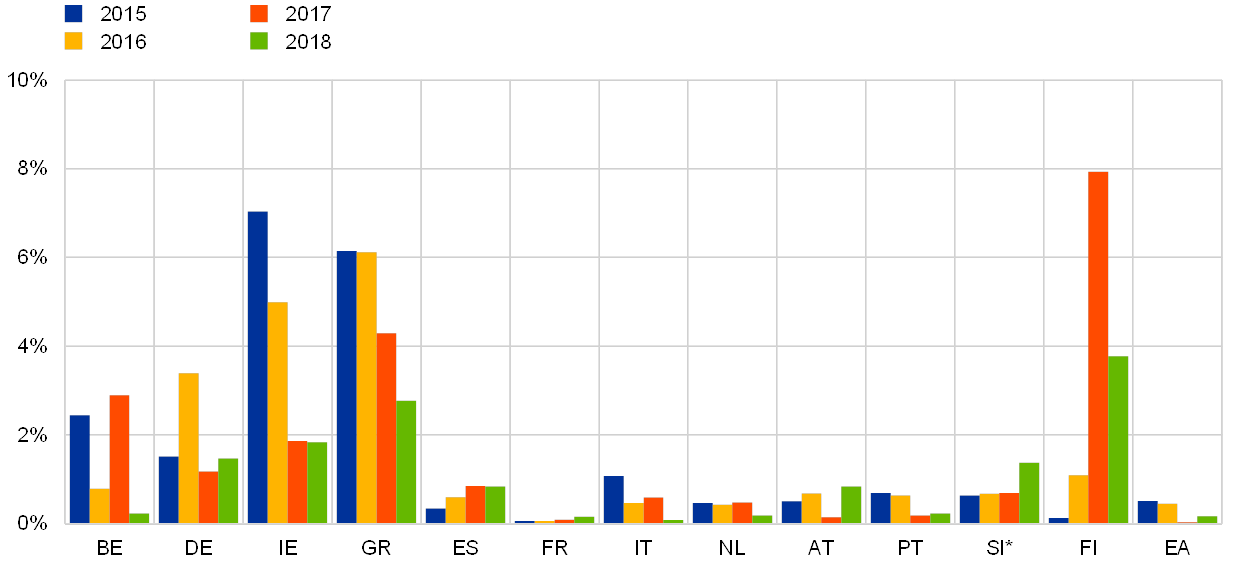
Charts 4.1.a, 4.2.a and 4.3.a present the absolute vertical discrepancies as of October of the following year; this focuses on development over time (i.e. the vertical discrepancy for 2018 shows the data as available in October 2019, which is broadly comparable with the vertical discrepancy for 2015, as available in October 2016). As these charts show the snapshot of data transmitted about 6 months after the year’s Q4 data have become available for the first time, the further revisions for the data of previous years are not shown, while several countries have undertaken initiatives to also reduce the vertical discrepancies for the previous time periods.
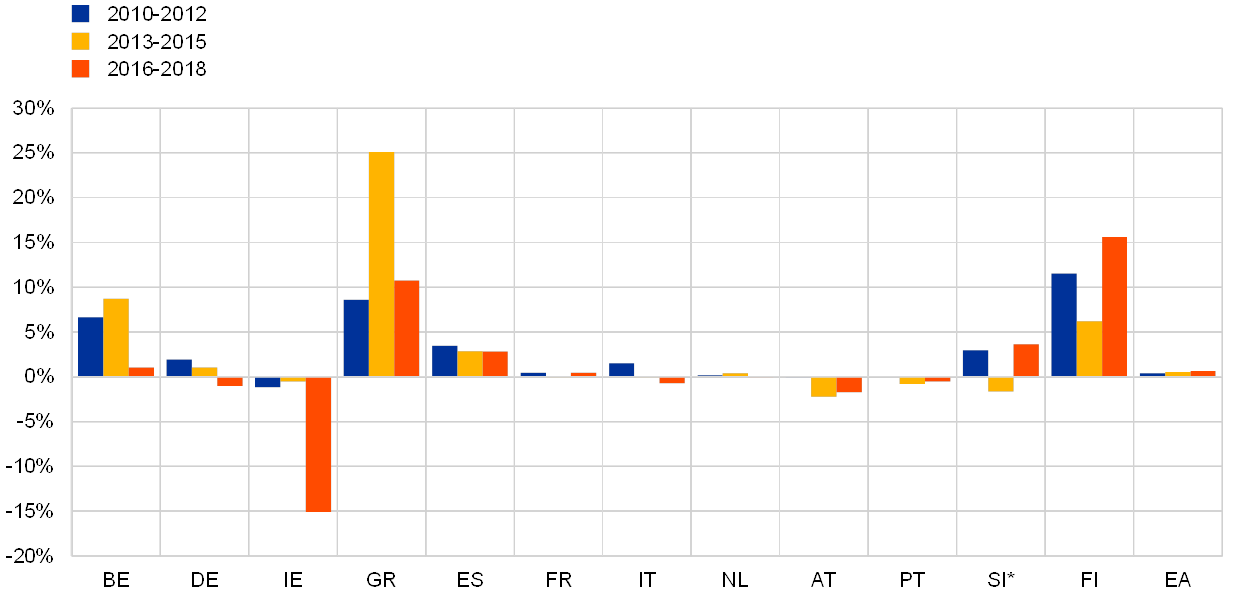
Charts 4.1.b, 4.2.b and 4.3.b show the cumulative vertical discrepancies as available in October 2019, in order to show whether vertical discrepancies balance out or accumulate over time. Accumulating vertical discrepancies indicate a persistent bias in the accounts.
For households the differences between the financial and the non-financial accounts for the euro area were small in all four years (see Chart 4.1.a). Some countries (Germany and Portugal) reconcile the household sector, e.g. by adjusting financial and/or non-financial items for which the data sources are considered incomplete or of relatively low quality; other countries do not make such reconciliation adjustments. In France the reconciliation exercise is conducted once a year, as balance sheet data are revised on an annual basis. In many countries vertical discrepancies tend to largely offset each other over time and, as a result, the four-quarter averages are low in most countries. Discrepancies relative to country GDP for 2018 were particularly high for Greece and Finland.
Vertical discrepancies, households
(absolute vertical discrepancies relative to GDP, percentages)
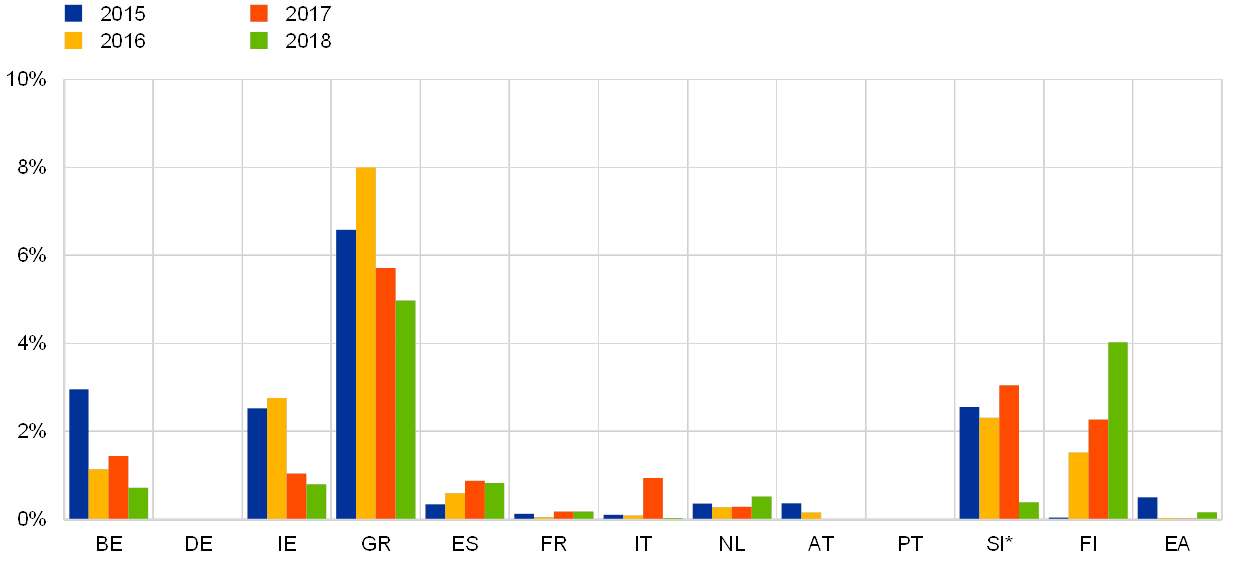
* Slovenia provides data on a voluntary basis.
The sign persistency of the vertical discrepancies is also a relevant quality measure, as it helps to identify biases in the accounts (neglecting short-term volatility and recording issues between consecutive quarters). Chart 4.1.b displays the cumulative vertical discrepancies for household sectors in relation to GDP. The euro area households sector displays a very small negative bias. Countries with high absolute discrepancies also exhibit persistent biases in the accounts: a negative bias is shown for Greece and Finland. A positive bias indicates the continued excess of net lending, as derived from the non-financial accounts (and vice versa for a negative bias).
Bias in vertical discrepancies, households
(cumulated vertical discrepancies relative to GDP, percentages)
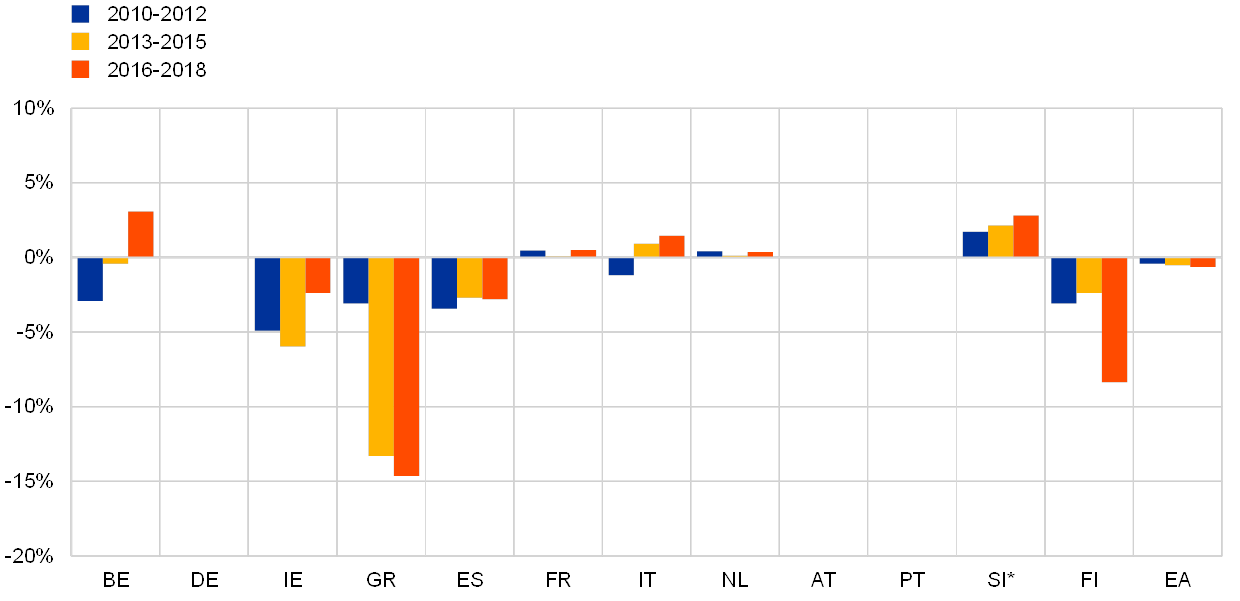
* Slovenia provides non-financial sector accounts for this sector on a voluntary basis.
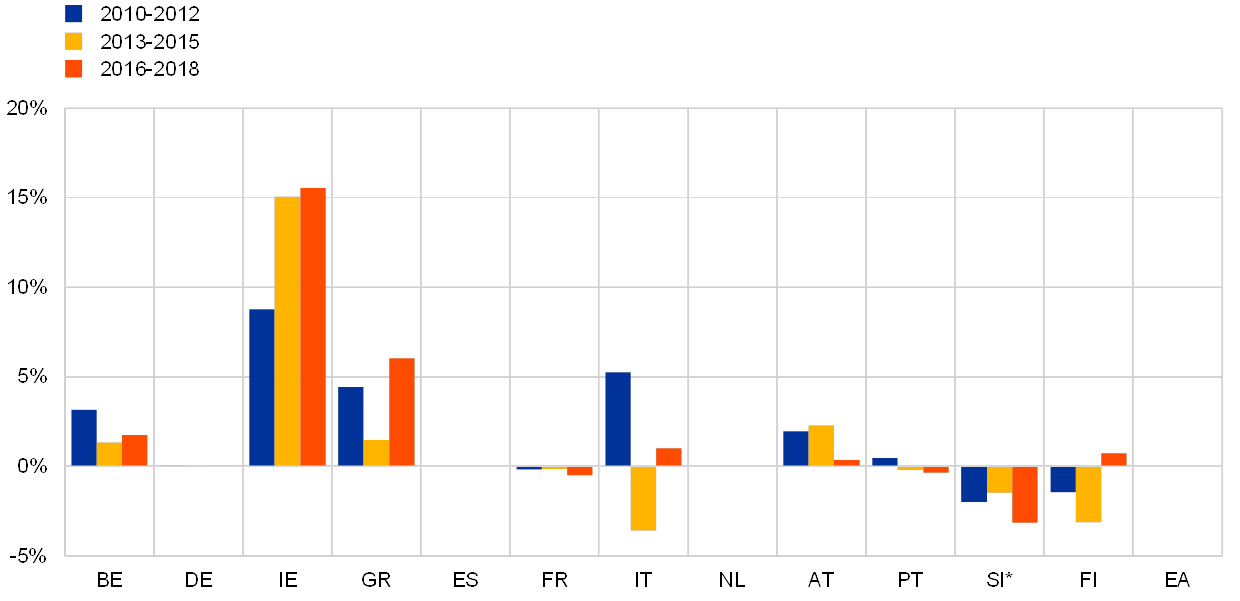
For NFCs the differences between the financial and the non-financial accounts for the euro area remain low in 2018 (0.2% of GDP) (see Chart 4.2.a). For some countries, the discrepancies were significantly greater, partly because the NFC sector is generally not reconciled (see Chart 4.2.a). In some countries (e.g. Germany), this sector has been chosen to offset the “net errors and omissions” stemming from the b.o.p. There have been significant continuous improvements in previous years in Ireland – which has a large NFC sector relative to GDP, owing to the presence of large multinational corporations – and Greece. In Ireland this mirrors a similar improvement in the household sector. Discrepancies relative to country GDP for 2018 were particularly high for Greece and Finland.
Vertical discrepancies, non-financial corporations
(absolute vertical discrepancies relative to GDP, percentages)
* Slovenia provides non-financial sector accounts for this sector on a voluntary basis.
The euro area NFC sector displays a small positive bias (see Chart 4.2.b). Ireland displays a negative bias in the most recent period, while Greece and Finland show a positive bias for all periods.
Bias in vertical discrepancies, non-financial corporations
(cumulated vertical discrepancies relative to GDP, percentages)
*Slovenia provides non-financial sector accounts for this sector on a voluntary basis.
The euro area FC sector is fully reconciled (see Chart 4.3.a). For this sector, data availability is typically better than it is for the non-financial sectors, and many countries usually achieve consistency. Discrepancies relative to country GDP for 2018 were relatively high for Ireland, Greece and Finland. In the case of Ireland the discrepancies are on decreasing trend in the last years, and are relatively small compared with the size of the financial sector. However, they are higher than in the previous year’s report.
Vertical discrepancies, financial corporations
(absolute vertical discrepancies relative to GDP, percentages)

* Slovenia provides non-financial sector accounts for this sector on a voluntary basis.
Ireland, Greece and Finland exhibit a positive bias in the most recent period (see Chart 4.3.b).
Bias in vertical discrepancies, financial corporations
(cumulated vertical discrepancies relative to GDP, percentages)
* Slovenia provides non-financial sector accounts for this sector on a voluntary basis.
7.2 Consistency with balance of payments and international investment position statistics
Euro area b.o.p. and i.i.p. data constitute one of the building blocks for euro area financial accounts (EAA) and are widely used at national level for the compilation of the rest of the world (RoW) financial and non-financial accounts as part of the system of national accounts.
The methodological differences between the b.o.p./i.i.p. and the RoW account (national accounts) were removed with the introduction of ESA 2010 and the BPM6, albeit some challenges still remain when it comes to interpretation.[16] Analysis showed that inconsistencies between the two statistical domains persisted in many countries, negatively affecting the combined use of the two datasets and their reliability. Acknowledging this, the ESCB worked to precisely identify the differences and to develop national medium-term work plans to be generally observed by September 2019[17]. In this context, while the removal of inconsistencies between the two statistical domains has progressed and most countries already compile the two sets of statistics in a consistent manner, a few countries still observe large discrepancies with a substantial impact on euro area and/EU aggregates. Such issues are tackled in the context of the MIP quality assurance framework.
7.2.1 Financial transactions
Chart 5 shows the differences between b.o.p. and the RoW account for financial transactions. In this case discrepancies may be accounted for by time of recording differences, as well as by the reconciliation of the national sectoral accounts. Both the “vertical” reconciliation (a correction for errors and omissions) and “horizontal” reconciliation (asset/liability equality across sectors) may entail larger adjustments to the financial transactions of the RoW account. Nonetheless, as an indicative benchmark, the relative differences should ideally not exceed 0.3% of the average value of the underlying positions.
For the euro area as a whole the differences were not significant (a bit higher than last year for assets and broadly unchanged for liabilities) and showed a relatively high level of consistency between the two datasets. At country level differences of above 0.3% were recorded for several countries (Belgium, Greece, France (only for liabilities) and Malta (only for liabilities). Greece recorded the highest relative discrepancies while the largest absolute differences were observed in Germany (only for liabilities) and France. In addition, a difference above threshold was also observed for Slovakia, but it did not affect the consistency of the two datasets.
Financial account transaction discrepancies between the b.o.p and RoW account
(average absolute and relative difference (as a percentage of respective b.o.p. and RoW stocks of financial assets/liabilities) for the period Q3 2016 to Q2 2019 (b.o.p. vs EAA))
Source: ECB.
7.2.2 Financial positions
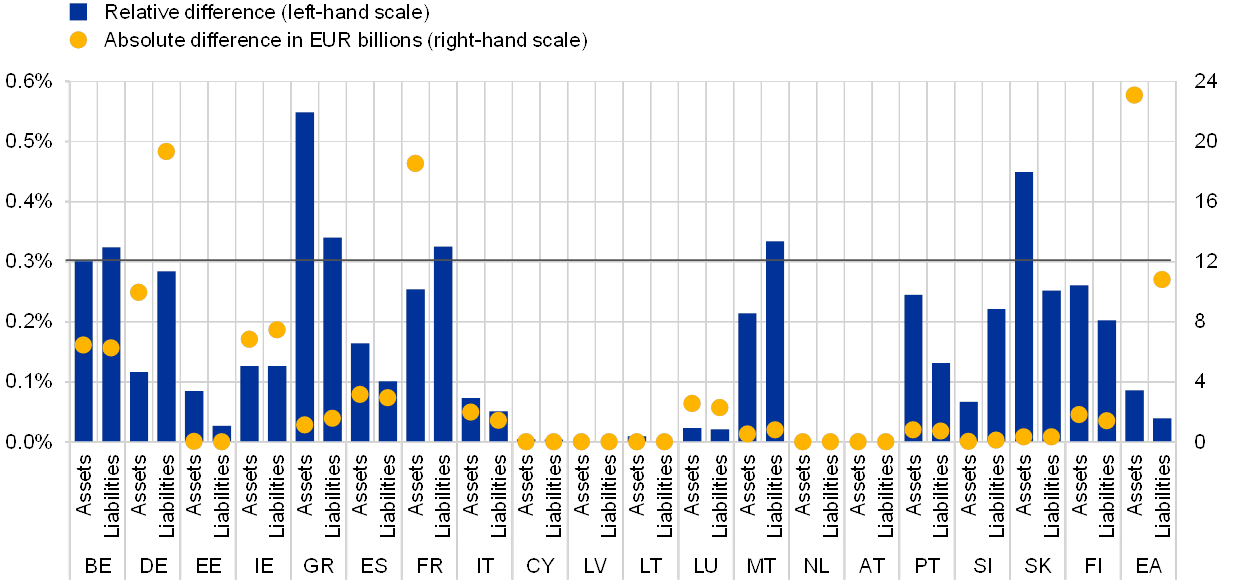
Chart 6 below presents the differences between the i.i.p. and the RoW account for financial assets and liabilities (balance sheets/positions). As expected, the differences between the two datasets are larger for positions than for transactions. Relative differences should, as an indicative benchmark, be below 0.5% of the total of the average financial assets/liabilities in the i.i.p. and the sectoral accounts.
The euro area recorded discrepancies of 4% for both assets and liabilities, similar to last year. These discrepancies arose mostly from differences between the compilation and reconciliation processes for the euro area i.i.p. and the RoW. At country level, differences of above 0.5% were recorded by Germany (only for liabilities), Greece, France and Malta. The highest discrepancies were recorded for France (assets) and Malta, with values exceeding 3%. In addition, differences above threshold were observed for some countries – Italy, Portugal, Slovenia (only for liabilities), Slovakia (only for assets) and Finland) – though it did not affect the consistency between the two datasets.
A detailed analysis at instrument level reveals sizeable differences for equity instruments that are mostly triggered, by different valuation practices (e.g. in the case of France regarding unlisted equity instruments).[18] Other reasons behind the differences also affecting the remaining instrument types include discrepancies in vintages, data sources, estimation methods.
Financial account position discrepancies between the i.i.p. and RoW account
(average absolute and relative difference as a percentage of respective i.i.p. and RoW stocks of financial assets/liabilities for the period Q3 2016-to Q2 2019 – i.i.p. vs EAA)
Source: ECB.
7.3 Comparison with other financial statistics
Deviations from other financial statistics may well be justified, as financial accountants may choose to amend the primary data sources in order to align with ESA concepts, or to enrich the data with alternative or supplementary data sources. However, identifying, comparing and explaining differences may be the starting point for a more thorough analysis and. Furthermore, explaining major differences between the national data and other related statistics provides valuable information for the users of euro area accounts and MIP data.
7.3.1 Comparison of MFI loans by counterpart sector with MFI balance sheet statistics
Conceptual differences arise for MFI loans because MFI balance sheet items (BSI) statistics do not record the accrued interest with the loan. While unilateral write-downs may be recognised in MFI balance sheet statistics, loans are recorded at nominal value in the financial accounts until they have been completely written off.
Loans granted by MFIs to general government, as recorded in the financial accounts, may differ from the data in MFI balance sheet statistics because financial accounts compilers use government finance statistics, which are assumed to provide higher-quality identification of the borrowing entities that are classified in the government sector (while reporting MFIs may sometimes misclassify entities such as local utilities). This is also the main reason why the loans granted by MFIs to NFCs as recorded in the financial accounts may also differ from BSI in a number of countries (see Annex 1, Table 1.5.1). Another reason could be the recording of accrued interest, for which the preferred recording in the financial accounts is with the respective instrument, whereas in BSI it is recorded under remaining assets/liabilities). Moreover, the “rerouting” of loans applied in the financial accounts can lead to differences between BSI and financial accounts statistics, in cases when MFIs grant loans , to the private sector “on behalf” of government
The differences are below 2% of stocks in most countries, although in Germany and Austria the financial accounts data differ by more than 2% due to the different sector allocation of MFI loans. In Cyprus the differences between transactions are above 3%.
7.3.2 Comparison of securities issuance and ECB securities issues statistics
Conceptual differences between securities issuance in the financial accounts and the securities issues statistics (SEC) relate to different valuation methods (nominal in SEC, market valuation in the financial accounts) and the recording of transactions received against payments other than cash. The latter can have a significant impact, particularly in the case of share swaps related to mergers and acquisitions. While share swaps are generally recorded in financial accounts as transactions, SEC do not record such transactions.
In some EU Member States, securities issued without an International Securities Identification Number (ISIN), which is not generally captured in SEC, are non-negligible. Financial accounts compilers thus supplement the SEC for non-ISIN securities with additional information.
These methodological differences and the supplementation of securities issuance data with additional information may explain why the financial accounts values for stocks are mostly higher than the SEC values (see Annex 1, Table 1.5.1). Small negative relative differences were observed in the Netherlands, while the large positive relative differences seen for Cyprus were because the amounts for stocks were very close to zero.
Box 1 Quality indicators for financial accounts statistics underlying the MIP
The MIP scoreboard for the Alert Mechanism Report (AMR) consists of 14 headline indicators with thresholds (complemented by auxiliary indicators with no thresholds). The composition of the MIP indicators is subject to review and evolves over time in order to reflect the latest developments or increased data needs. Most of these indicators are composite, i.e. they make use of at least two data sources.
Financial accounts are the main input for the following three headline indicators:
- private sector debt[19], consolidated[20] as a percentage of GDP;
- private sector credit flow[21], consolidated as a percentage of GDP;
- financial sector liabilities[22], non-consolidated[23], one-year percentage change (11 years of data necessary).
- Additionally, financial accounts are used for one auxiliary indicator:
- household debt (including NPISH) [24], consolidated as a percentage of GDP.
Together, these indicators provide analytical evidence of possible vulnerabilities and risks that would require further investigation at country level.
The following sections assess the fitness for purpose of financial accounts data used for the MIP analysing the data vintage used in the 2019 Alert Mechanism Report.Institutional setup
Quarterly financial accounts are transmitted to the ECB on the basis of Guideline ECB/2013/24[25], with non-euro area EU Member States providing the data on a voluntary basis. Annual financial accounts are sent to Eurostat on the basis of ESA 2010 transmission programme (Regulation (EU) No 549/2013[26]).The indicators used for the MIP are provided by Eurostat on the basis of the annual financial accounts compiled in the Member States by NCBs or, in some cases, by NSIs. In most cases the annual and quarterly financial accounts are derived from a single compilation system. The MoU was therefore signed in November 2016. In the MoU (and in the related letters that were exchanged), the European Commission and the ECB mutually recognise the quality assurance frameworks in place in the European Statistical System (ESS) and the ESCB, and establish practical working arrangements for cooperation with regard to the quality assurance of statistics underlying the MIP.
The MoU specifies that Eurostat and the ECB’s Directorate General Statistics (DG-S) should regularly conduct assessments of the quality of national datasets. In particular, the ECB/DG-S should run its quality procedures for the datasets reported by NCBs and provide Eurostat with quality-assured datasets and/or information on the quality of the data after the regular data transmission in September/October each year.[27] The MoU also envisages visits by the ECB/DG-S and Eurostat to NCBs and/or NSIs to help assess the output quality of MIP-related data. In 2019 country visits to Germany, Malta and Ireland took place, and as a result of those visits, recommendations for improving data quality were included in the relevant sections of this report.
To ensure full transparency with regard to the quality of MIP-related statistics, a three-level quality reporting system has been set up over the last few years with the support of the CMFB. That system consists of national self-assessment reports (Level 3) which, in turn, feed into the domain-specific quality reports (Level 2) – including this report – which are coordinated between the ECB and Eurostat. Finally, a joint Eurostat/ECB summary report assessing the quality of all statistics underpinning the MIP (Level 1) is published each year on the CMFB's website.
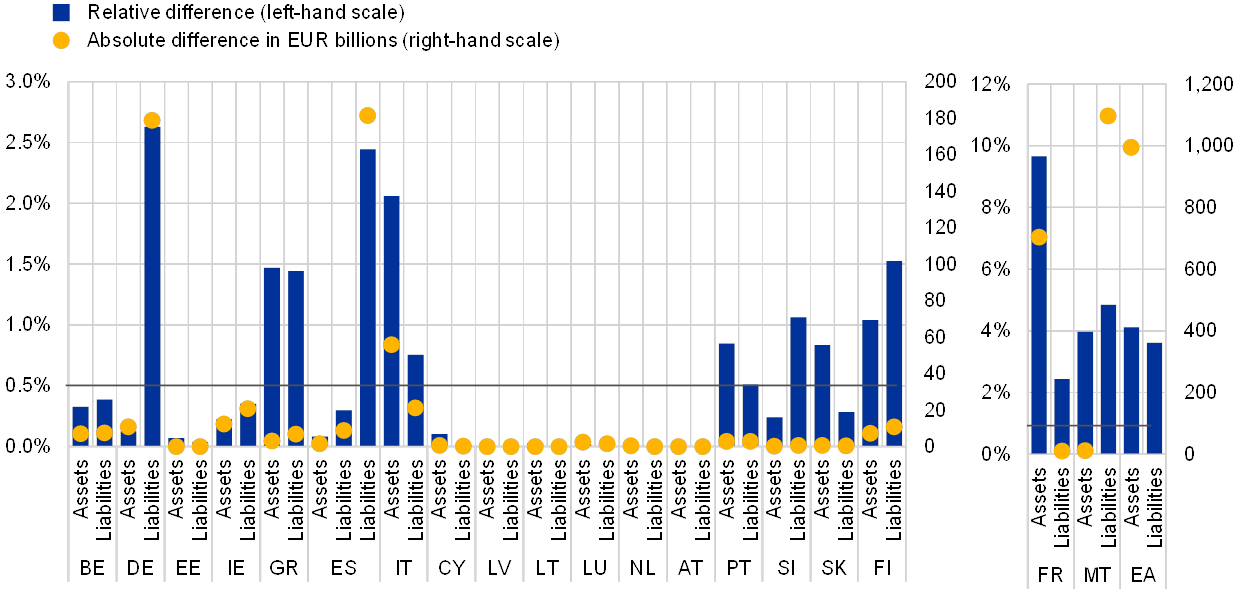
Data availability and confidentiality
All EU Member States provide quarterly financial accounts data which can be used to compile the MIP indicators on a non-consolidated basis (as these do not require who-to-whom data). The United Kingdom has not provided separate data for the insurance corporation (IC) and pension fund (PF) financial sub-sectors, although it does provide the data for the total FCs sector. As of October 2019 all euro area countries provide back data dating from Q1 1999 (or the first quarter of the year in which the respective country acceded to the European Union). Most non-euro area EU countries have also provided additional back data. For MIP purposes the focus is on data for the last ten complete years (2009-18). 11 years are required (2008-18) for the calculation of the financial sector liabilities (as a one-year percentage change). This data range was available for all EU countries except Denmark and Croatia. For Croatia, quarterly financial accounts are not required for the years before it joined the European Union (before 2013).[28] Longer time series (15 years) are preferable, and – of the countries that joined the EU in 2004 or later – only Hungary provides quarterly back data prior to 2004.
All EU Member States make the dataset as specified in the ECB Guideline available to the general public, except for some minor exceptions which do not affect the compilation of the MIP indicator on a quarterly basis. Ireland releases only 79% the required counterpart sector details for securities, and only 78% of the observations relating to the additional back data for the core dataset are fully available; parts of the data prior to Q1 2002 (and the separate household and NPISH sub-sectors from Q4 2012) are flagged as “not for publication”. In addition, the accessibility of the core data set has decreased to 92% compared to the last year’s report (from 98%). In the case of Cyprus, the partial unavailability of more recent data and counterpart sector details is due to confidentiality constraints in the b.o.p./i.i.p. source data.
Sources and methods
The national financial accounts are generally consistent with the requirements and conceptual framework of ESA 2010. However, the financial account statistics are derived statistics that rely on a wide range of data sources which are not necessarily complete or fully sufficient in terms of conceptual requirements.
One area where the compilation of the financial accounts data underlying the MIP indicators is affected by limited data sources is the full coverage of financial sector liabilities, in particular SPEs and, more generally, OFIs, for which there are generally no source statistics in place that are both comprehensive and timely. Cross-checking with business registers or the use of other methods to ensure full coverage of OFIs should be improved in Germany, the Netherlands and Poland. In Croatia and Sweden it is difficult to determine the coverage for particular OFI sub-sectors, groups of entities or instruments from the existing data sources. This may mean that these data are not fully covered – it is also not possible to estimate the missing data.
Several countries do not have a fully comprehensive direct data source for NFCs, or access to business registers facilitating the grossing-up procedures needed to achieve full coverage of intra-NFC loans and other transactions/positions not covered by counterpart sector information. Cross-checking with business registers or the use of other methods ensuring full coverage should be improved in Cyprus and Poland. Furthermore, Belgium, Bulgaria, the Czech Republic, Denmark, Germany, France, Croatia, Cyprus, Malta and Romania are encouraged to improve their timely direct data sources – this will reduce revisions when comprehensive data become available.
Accuracy and reliability
Since the last review period, 19 countries have implemented major national accounts and b.o.p./i.i.p. benchmark revisions, which have supported the alignment of national accounts (ESA 2010 data) with b.o.p./i.i.p. statistics. These revisions and other regular revisions have not significantly altered the analytical interpretation of the indicators.
Revisions to the data underlying the MIP headline indicators are relatively low for most of the countries, as can be seen in the MIP Annex Table A.
For consolidated private sector debt and credit flow, revisions are mostly due to revisions to NFC loan financing, whereas revisions to household loan financing and the issuance of NFC debt securities are generally lower.
For consolidated private sector debt, revisions are relatively high in Ireland, France, Cyprus, Latvia, Luxembourg, Malta, the Netherlands, Denmark and Sweden, while the remaining countries have revisions that are lower than 2% of national GDP. The exceptionally high revisions for Ireland are due to difficulty in capturing the financing activity of very large multinational enterprises due to the highly globalised nature of the Irish economy. For Malta they are a result of new enhanced data sources, mainly b.o.p./i.i.p. statistics and administrative data sources.
For consolidated private sector credit flow, revisions are relatively high in Belgium, Estonia, Ireland, Cyprus, Latvia, Luxembourg, Malta, Bulgaria and Denmark, while the remaining countries have revisions that are lower than 1% of national GDP. These revisions are mainly due to new and updated data sources, including the efforts to align with the b.o.p./i.i.p. data and to achieve consistency between the annual and quarterly financial accounts.
For total financial sector liabilities revisions are lower than 2% in most cases, measured as a one-year percentage change. The higher revisions observed for Estonia, Ireland, Cyprus, Luxembourg, Malta, the Netherlands and Denmark, are mainly due to updated and improved data sources and methods, also in relation to the implemented benchmark revisions. Moreover, financial sector liabilities continue to be revised upwards owing to improvement data sources to increase coverage of OFIs in several countries. The size of these revisions differs between countries, partly reflecting the different economic realities and, in particular, the restructuring of multinationals.
Revisions for the auxiliary indicator on household debt are generally lower than they are for the headline indicators, mirroring the reliable main statistical source (loans by MFIs). The largest revisions (above 1% of GDP) are recorded for the Netherlands, Finland and the United Kingdom.
Internal consistency
Most countries fulfil all validation (accounting) rules, with the minor exceptions of the Czech Republic, Denmark, Ireland, Croatia, Hungary, Romania, Slovakia, Sweden and the United Kingdom (see Annex 1 Table 1.2.1). In the case of the United Kingdom observed inconsistencies are related to incomplete transmissions.
Consistency of quarterly and annual financial accounts
In most countries quarterly and annual financial accounts are fully consistent (see Annex 1, Table 1.2.2). Vintage differences may occur as not all countries update their annual data on a quarterly basis. Countries are encouraged to ensure that quarterly and annual data are consistent, in particular for data vintages used for MIP purposes in October each year. Structural differences may signal quality issues in quarterly and/or annual accounts. Differences are relatively large in Ireland, Slovakia, the Czech Republic, Denmark and the United Kingdom. In all these countries, except the United Kingdom, different institutions are responsible for the compilation of annual and quarterly financial accounts (the NCB is responsible for the quarterly financial accounts and the NSI is responsible for the annual frequency). However, in other countries where two institutions are responsible for the compilation of financial accounts, the annual/quarterly data differences are very limited.
The different classification of certain financial institutions in quarterly and annual financial accounts explains some minor differences in financial sector liabilities in several countries. In Hungary the difference for financial sector liabilities (0.9%) is due to the different classification of the Hungarian Export-Import Bank (Eximbank) in quarterly and annual financial accounts, as transmitted by Hungary to the European institutions (the source for quarterly data is the NCB data sent to the ECB while the source for annual data is the NCB data transmitted via Eurostat). Whereas the bank is included in the financial sector in the quarterly financial accounts and other financial statistics, it is classified in the general government sector in the annual financial accounts and other statistics transmitted to Eurostat. In its opinion of 17 July 2017 the CMFB advised that Eximbank should be classified in the general government sector.[29] [30]
Consistency with non-financial sector accounts
An important quality aspect for users of financial accounts is consistency with the non-financial accounts across institutional sectors. Conceptually, the net lending/net borrowing derived from the financial and the non-financial accounts should be identical for all sectors, although in practice this is often not the case. High and persistent differences signal quality issues in the financial and/or the non‑financial accounts.
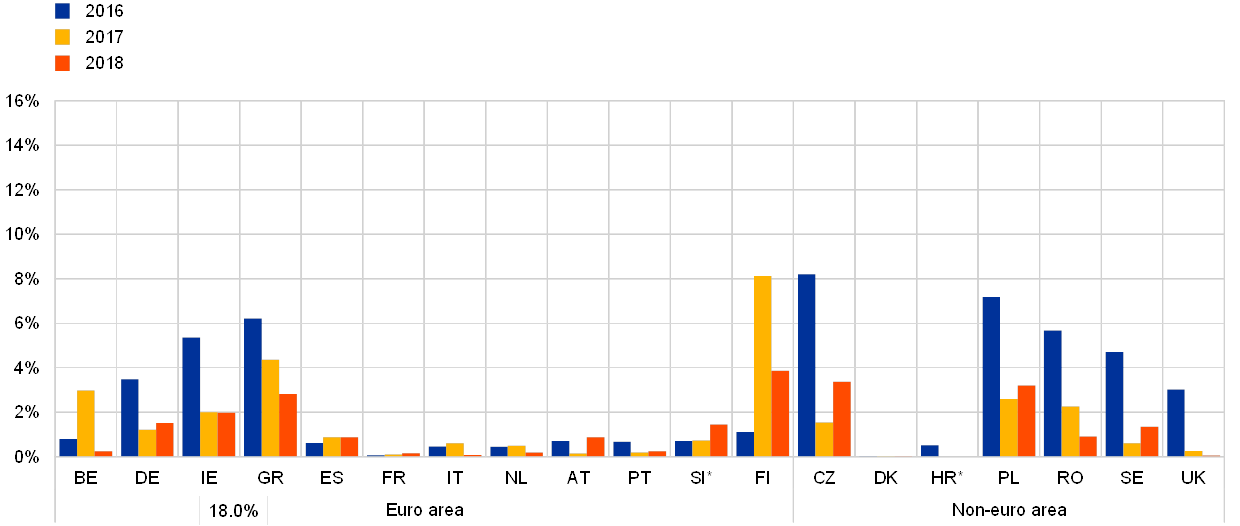
For the households sector vertical discrepancies for 2018 were above 2% of GDP in the Greece, Poland, and Finland (see MIP Chart A).
MIP Chart A
Vertical discrepancies, households
(absolute vertical discrepancies relative to GDP, percentages)

Note: * Quarterly non-financial sector accounts for this sector are provided by Slovenia and Croatia (up to and including data for 2016) on a voluntary basis.
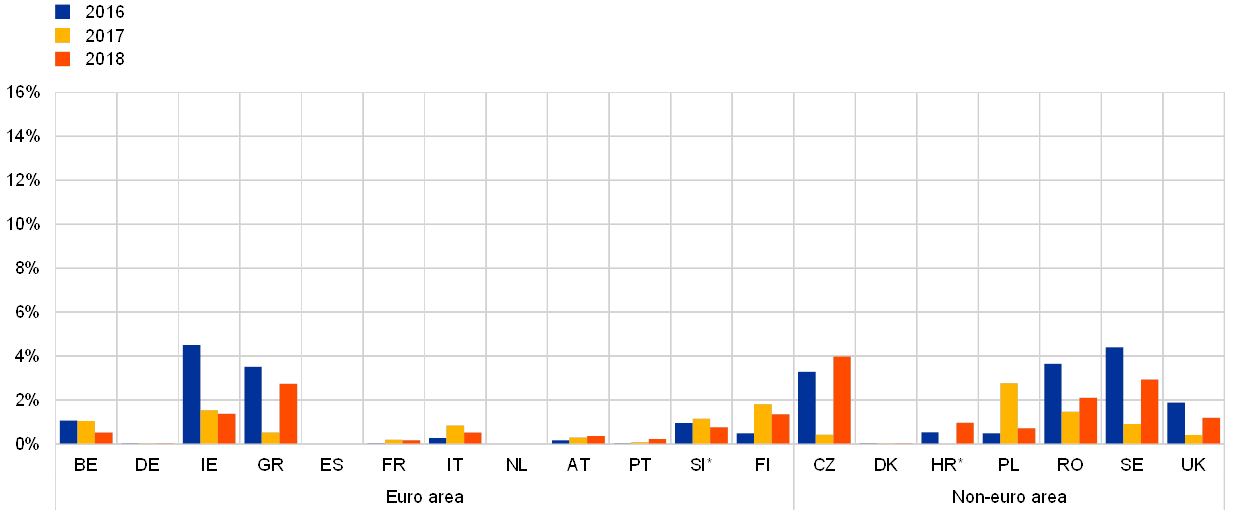
MIP Chart B
Vertical discrepancies, non-financial corporations
(absolute vertical discrepancies relative to GDP, percentages)
Note: * Quarterly non-financial sector accounts for this sector are provided by Slovenia and Croatia (up to 2016) on a voluntary basis.
For the NFC sector, vertical discrepancies for 2018 were above 2% of GDP in Czech Republic, Greece, Poland and Finland (see MIP Chart B).
MIP Chart C
Vertical discrepancies, financial corporations
(absolute vertical discrepancies relative to GDP, percentages)
Note: * Quarterly non-financial sector accounts for this sector are provided by Slovenia and Croatia (up to and including data for 2016) on a voluntary basis.
For the FC sector, vertical discrepancies for 2018 were above 2% of GDP in Greece, the Czech Republic, Romania and Sweden (see MIP Chart C).
In several EU countries work to ensure good alignment between financial and non-financial accounts is being carried out, and regular meetings are being held between the compilers. At European level, the issue is addressed in the relevant working fora (WG FA, Expert Group on Sector Accounts), with the objective of developing first common recommendations by end-2020.
External consistency
The methodological differences between the b.o.p./i.i.p. and RoW account (national accounts) were removed with the introduction of ESA 2010 and BPM6. However, the analysis shows that inconsistencies between the two statistical domains persist in several EU Member States, negatively affecting the combined use of these two datasets as well as their reliability. The CMFB has endorsed a medium-term work plan designed to eliminate most discrepancies by September 2019. The remaining discrepancies will be analysed in depth by ECB and Eurostat, and the most relevant outstanding differences will be addressed. For financial account positions, the discrepancies between the i.i.p. and RoW account total more than 10% of GDP in cases of France (assets only), Malta and Croatia (assets only).
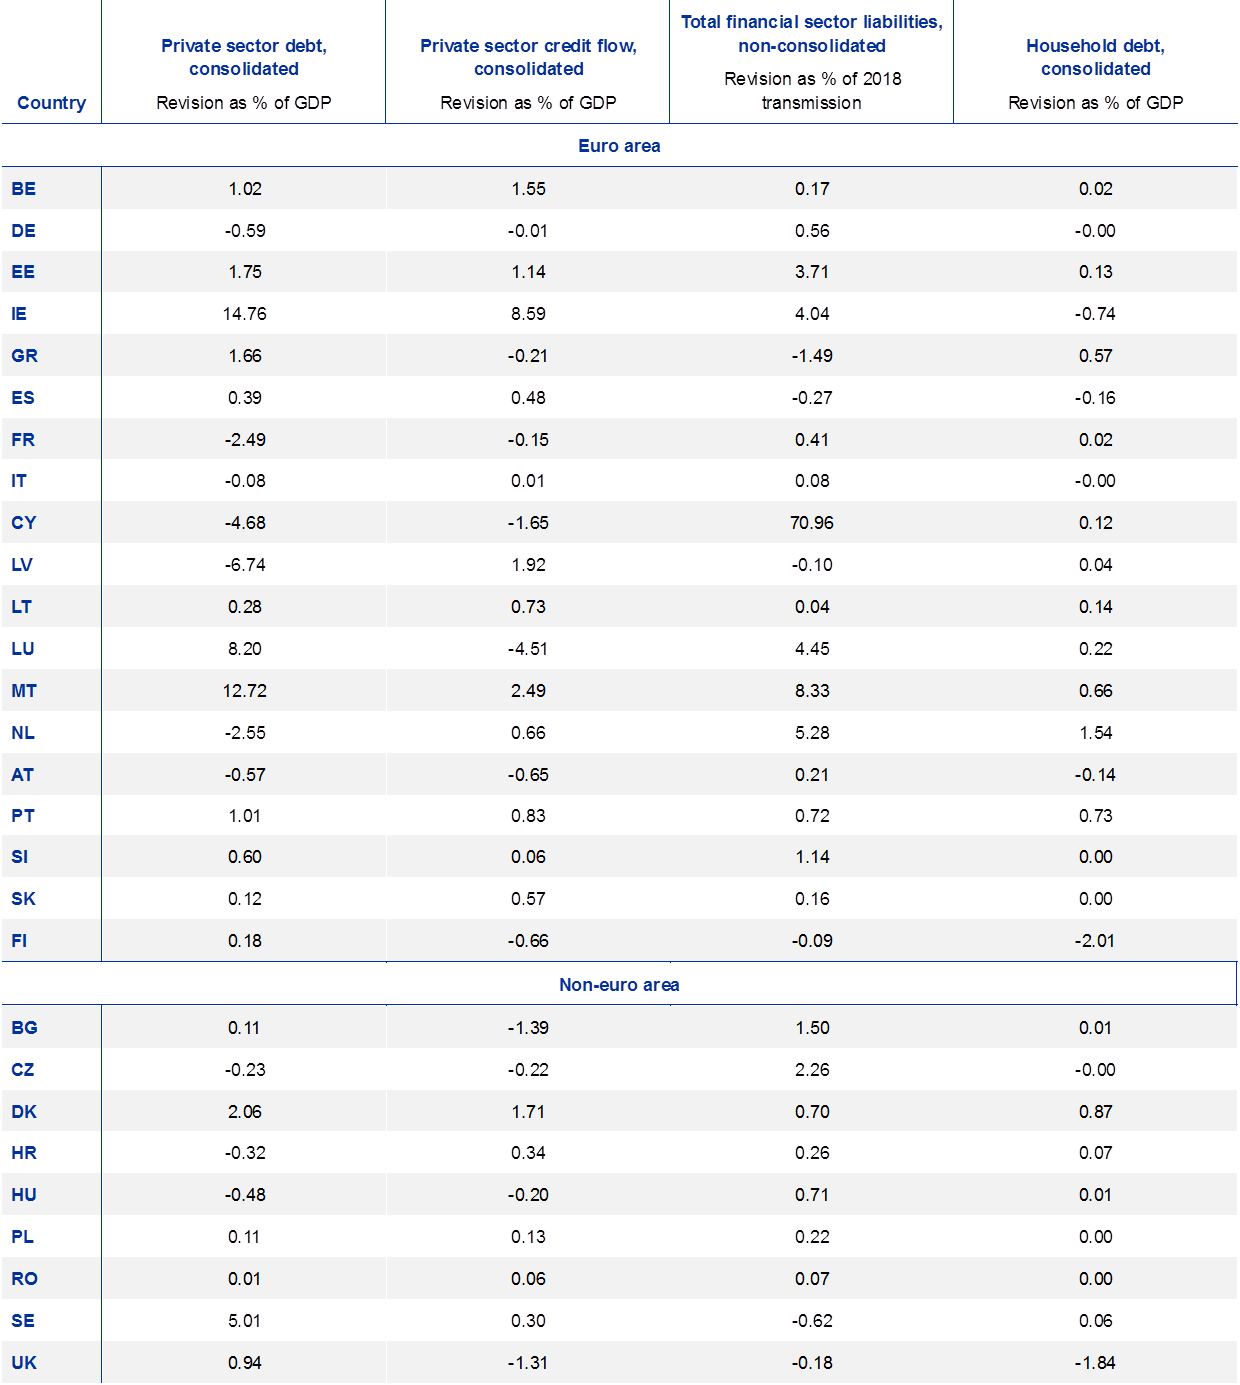
MIP Annex Table A
Revisions
(revisions of financial accounts data underlying MIP indicators for 2017 (October 2019 transmission compared with October 2018 transmission))
Annexes
See more.
© European Central Bank, 2020
Postal address 60640 Frankfurt am Main, GermanyTelephone +49 69 1344 0Website www.ecb.europa.eu
All rights reserved. Reproduction for educational and non-commercial purposes is permitted provided that the source is acknowledged.
For specific terminology please refer to the ECB glossary (available in English only).
PDF ISBN 978-92-899-4355-0, ISSN 2363-0191, doi:, QB-AV-20-001-EN-NHTML ISBN 978-92-899-4356-7, ISSN 2363-0191, doi:10.2866/689968, QB-AV-20-001-EN-Q
- [1]The principles underpinning this report can be found in the Public commitment on European Statistics by the ESCB. The ECB Statistics Quality Framework (SQF) and quality assurance procedures, published in April 2008, build upon the ESCB’s public commitment.
- [2]Guideline 2014/3/EU of the European Central Bank of 25 July 2013 on the statistical reporting requirements of the European Central Bank in the field of quarterly financial accounts (recast) (OJ L 2, 7.1.2014, p. 34)
- [3]The SQF is available on the ECB website.
- [4]See the final report of the DMES Task Force on Benchmark Revision Policy.
- [5]See the final report of the CMFB Task Force on Harmonised Revision Policy.
- [6]The principles underpinning this report can be found in the Public commitment on European Statistics by the ESCB. Published in April 2008, The ECB Statistics Quality Framework (SQF) and quality assurance procedures build on the ESCB’s public commitment.
- [7]Guideline of the European Central Bank of 25 July 2013 on the statistical reporting requirements of the European Central Bank in the field of quarterly financial accounts (recast) (ECB/2013/24) (OJ L 52, 7.1.2014, p.34).
- [8]The CMFB proposed that the harmonisation be extended to the financial accounts.
- [9]Guideline of the European Central Bank of 25 July 2013 on the statistical reporting requirements of the European Central Bank in the field of quarterly financial accounts (recast) (ECB/2013/24) (OJ L 52, 7.1.2014, p.34).
- [10]“The ECB shall publish the euro area aggregates it compiles, as well as the ‘national data’ collected under Article 2, as described in paragraphs 3 to 5 thereof, as deemed relevant by the STC except for data relating to the cells in rows 12-21 of Tables 3 to 9 of Annex I (referring to the counterpart sectors ‘residents in other euro area countries’ and ‘euro area RoW’)”. The STC confirmed in 2014 that all national financial accounts data required by the Guideline must be published, except as stated in the Guideline.
- [11]Guideline of the European Central Bank of 25 July 2013 on the statistical reporting requirements of the European Central Bank in the field of quarterly financial accounts (recast) (ECB/2013/24) (OJ L 52, 7.1.2014, p.34).
- [12]Internal consistency covers the following four elements: (i) aggregation consistency: total economy (transmitted sector total) = sum of sectors (sub-sectors); (ii) horizontal consistency: assets (sum of relevant sectors) = liabilities (sum of relevant sectors); (iii) balancing item consistency: transmitted net lending/net borrowing calculated from the financial accounts (B.9F) and net financial worth (BF.90) = assets (sum of relevant instruments) – liabilities (sum of relevant instruments); and (iv) counterpart sector consistency: totals (as reported in Tables 1-2) = sum of relevant counterpart sectors (as reported in Tables 3-7).
- [13]In order to compile appropriate euro area rest-of-the-world accounts, cross-border transactions and positions between euro area countries must be converted into domestic ones. For example, loans between non-financial corporations for two euro area countries are recorded as loans between non‑financial corporations rather than loans to and from the rest of the world. However, in the national data of euro area countries, the bilateral transactions and positions do not always mirror each other. These “asymmetries” are eliminated in order to obtain a consistent set of euro area accounts.
- [14]Internal discrepancies of more than €10 million have been observed for a few countries but these were generally corrected in later transmissions.
- [15]These inconsistencies were corrected in the January 2020 transmission.
- [16]The harmonised EU revisions policy also supports equality between the two statistical domains.
- [17]Or at the time of the next European benchmark revision which, for most EU countries (17 out of 28), occurred in 2019. The remaining countries either implemented it in 2018 or plan to do so in 2020.
- [18]In the RoW dataset an elaborate method is used to estimate market prices while in i.i.p. statistics the own funds at book value methodology is consistently applied.
- [19]Private sector debt as defined in the MIP scoreboard is the stock of liabilities of the non-financial corporations (S.11) and households and non-profit institutions serving households (NPISH) sectors. The instruments taken into account to compile private sector debt are debt securities and loans.
- [20]i.e. not taking into account the stock (transactions, in the case of credit flow) of debt within the same sector.
- [21]Private sector credit flow refers to the net amount of liabilities that have incurred (transactions) in the non-financial corporations (S.11) and households and NPISH sectors during the year.
- [22]Total financial sector liabilities measure the evolution of the sum of liabilities from currency and deposits, debt securities, loans, equity and investment fund shares/units, insurance, pensions and standardised guarantee schemes, financial derivatives and employee stock options and other accounts payable of the financial corporations sector.
- [23]i.e. taking into account the stock of liabilities within the same sector.
- [24]Non-profit institutions serving households.
- [25]Guideline 2014/3/EU of the European Central Bank of 25 July 2013 on the statistical reporting requirements of the European Central Bank in the field of quarterly financial accounts (recast) (OJ L 2, 7.1.2014, p. 34).
- [26]Regulation (EU) No 549/2013 of the European Parliament and of the Council of 21 May 2013 on the European system of national and regional accounts in the European Union Text with EEA relevance (OJ L 174, 26.6.2013, p. 1).
- [27]The ECB runs its quality procedure on the quarterly financial accounts received from all EU Member States. According to the MoU it is then up to Eurostat to assess whether the quarterly data are comparable with the annual data it receives from an EU Member State. For a large majority of Member States the quarterly and annual accounts are the results of the same compilation system. The derivation of the MIP indicators by Eurostat is based on the annual financial accounts.
- [28]NCBs are not required to transmit data relative to quarters prior to the first quarter of the year in which the relevant Member State acceded to the European Union.
- [29]See CMFB Opinion on the statistical sector classification of the Hungarian Export-Import Bank (Eximbank).
- [30]Magyar Nemzeti Bank publishes both quarterly and annual financial accounts that include Eximbank in the financial sector.
-
15 May 2020