

- SPEECH
Monetary policy after the energy shock
Speech by Fabio Panetta, Member of the Executive Board of the ECB, at an event organised by the Centre for European Reform, the Delegation of the European Union to the United Kingdom and the ECB Representative Office in London
London, 16 February 2023
It is a pleasure to be with you here in London today.
The energy shock stemming from Russia’s aggression against Ukraine has prolonged and aggravated a sequence of unprecedented supply shocks.[1] These shocks, combined with the reopening of the economy after the pandemic, have driven inflation in the euro area to persistently high levels.[2]
To prevent inflation from becoming entrenched, the ECB tightened its monetary policy stance decisively. We needed to avert second-round effects in the form of a de-anchoring of inflation expectations or a wage-price spiral.
We started to adjust our stance in December 2021[3]. Since July we have increased rates by 300 basis points. We have also started to normalise our balance sheet, which has shrunk by about €1 trillion since its peak. And from March we will reduce our asset purchase programme holdings by an average of €15 billion per month[4].
After this pronounced tightening, we need to carefully reassess the medium-term outlook for inflation and the risks surrounding it. In this respect, risks to the inflation outlook are now more balanced than at the time of our projections in December.
The economic environment is changing. Supply shocks have started to reverse, with energy and food commodity prices receding from their peaks last year and supply bottlenecks easing. It will take time for this to be fully reflected in retail prices across the economy and ultimately in core inflation.
We also face formidable sources of economic and geopolitical uncertainty globally. And major central banks are tightening their monetary policy stance simultaneously, the overall effects of which are difficult to assess.
In the euro area, market rates have increased significantly and bank lending is decelerating sharply. While housing and business investment has already weakened, the effect of our monetary policy impulses on domestic demand will only be felt in full over the coming quarters.
In this setting, I will argue that the ECB should not unconditionally pre-commit to future policy moves. Instead, we need to calibrate our monetary policy in a way that is data-dependent, forward-looking and adaptable to changing developments.
This approach can be best implemented by providing clarity on our monetary policy reaction function and then being guided by that reaction function in our decisions. We should respond to incoming information on the medium-term inflation outlook and the balance of risks surrounding it. And we should keep our policy tight until we see inflation firmly converging back to 2% over our policy horizon, taking into account the lags with which our monetary policy operates.
When we were normalising rates the pace of adjustment was key. But with rates now moving into restrictive territory, it is the extent and duration of monetary policy restriction that matters. By smoothing our policy rate hikes – that is, moving in small steps – we can ensure that we calibrate both elements more precisely in the light of the incoming information and our reaction function.
This framework will allow us to return to our target without undue delay. And it will allow us to do so at minimal cost to the economy and employment, reducing the risk that we tighten too much.
The uncertain economic environment
The current uncertain economic environment makes forecasting inflation particularly challenging.
The medium-term inflation outlook was revised substantially upwards in our staff projections last December. Headline inflation was projected to stand at 3.4% in 2024, before falling to 2% in the third quarter of 2025 (Chart 1). And core inflation was expected to remain above target throughout our horizon, declining to 2.4% on average by 2025. The risks to this outlook were primarily on the upside.
Chart 1
Euro area HICP headline inflation and inflation projections
(annual percentage changes and percentage point contributions)

Source: Eurosystem staff macroeconomic projections for the euro area, December 2022.
Notes: The dashed yellow line denotes projections. The latest observations are for the fourth quarter of 2022.
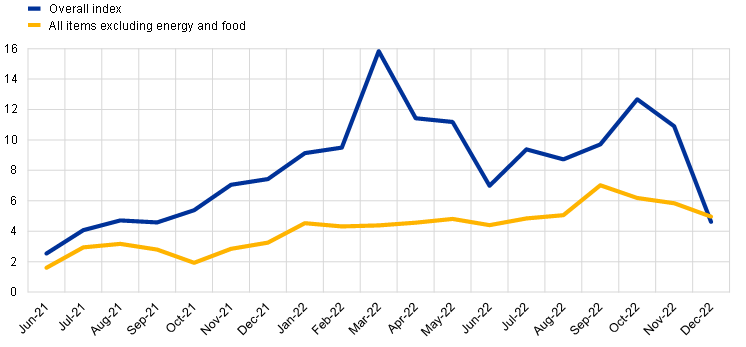
But key assumptions underpinning economic projections can change quickly. In fact, recent surveys and the latest European Commission forecast see headline inflation significantly below our December projections for 2024.[5] And risks have become more balanced.
Let me now review the key factors making projections difficult in the current environment.
Energy prices
Energy inflation has slowed more than projected in December. As a result, headline inflation is also falling: in January it was well below what we expected in December, driven by the energy component (Chart 2). If the drop in energy prices is sustained, headline inflation may fall below 3% towards the end of the year.
Chart 2
Inflation in the euro area
(annual percentage changes and percentage point contributions)
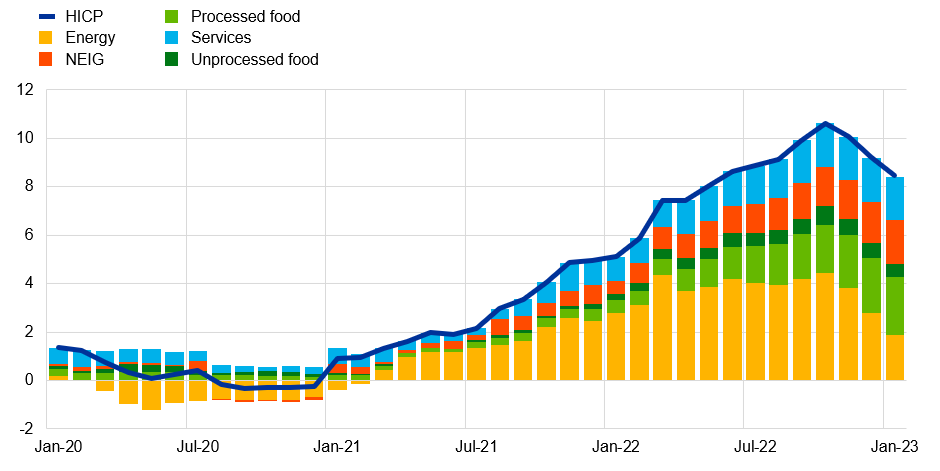
Sources: Eurostat and ECB calculations.
Note: NEIG stands for “non-energy industrial goods”.
The deceleration in headline inflation is particularly visible from indicators of inflation momentum, which may be more informative than the usual year-on-year inflation rate when inflation is changing rapidly.[6] These indicators are also showing signs of deceleration in core inflation (Chart 3).
Chart 3
Short-run inflation momentum: three-month HICP change, annualised, working-day and seasonally adjusted
(percentage changes)
Sources: Eurostat and ECB.
Note: The latest observation is for December 2022.
Wholesale electricity and gas prices are currently lower than assumed in the December projections, pointing to a continued decline in energy inflation. And wholesale energy prices will affect all inflation components as they remain the largest driver of both goods and services inflation (Chart 4).
Chart 4
Contributions of energy-sensitive components to goods and services inflation in the euro area
(annual percentage changes and percentage point contributions)
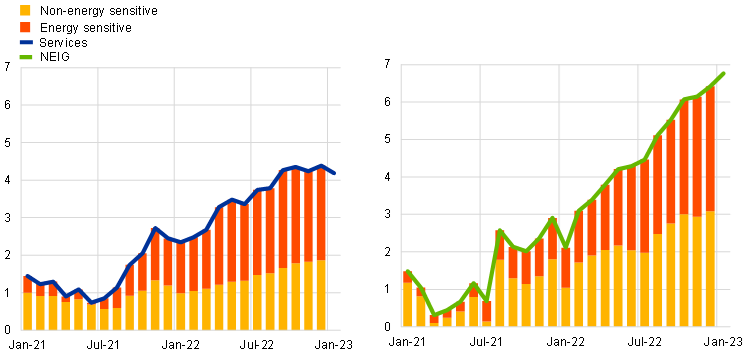
Sources: Eurostat and ECB staff calculations.
Notes: The term “energy-sensitive component” reflects items with a share of energy in direct costs above the average share of energy across services items (left-hand panel) and non-energy industrial goods (NEIG) items (right-hand panel). The latest observations are for December 2022
Core inflation has been less affected by the fall in energy prices so far. This is not surprising, as energy typically has a gradual and indirect impact on the price of goods and services through changes in the cost of inputs. For example, the cost of offering goods will over time benefit from lower transportation costs. Similarly, the cost of producing food will benefit from lower fertiliser costs, and the cost of providing hospitality services will benefit from lower heating costs.
Core inflation cannot turn on a dime, and the speed at which lower energy prices will pass through to core inflation is uncertain. If lower energy prices strengthen consumer demand, the pass-through could be slower as firms seize the opportunity to increase margins. At the same time, over the past year we have seen more frequent price adjustments, which could make downward price rigidities less binding. In any case, the direction of core inflation will eventually follow that of headline inflation, just like what happened on the way up.
Lower energy prices will help to temper core inflation through other channels too.
For example, improving terms of trade due to lower energy prices have contributed to the euro’s appreciation both directly[7] and indirectly by supporting the growth outlook (Chart 5). In turn, the appreciation of the euro against the dollar – by 12% from the through in September and 4% since the December projections – further reduces the cost of dollar-denominated commodities and other inputs imported in the euro area[8].
Chart 5
Drivers of the euro-US dollar exchange rate
(cumulative changes since January 2022, percentage changes and percentage point contributions)
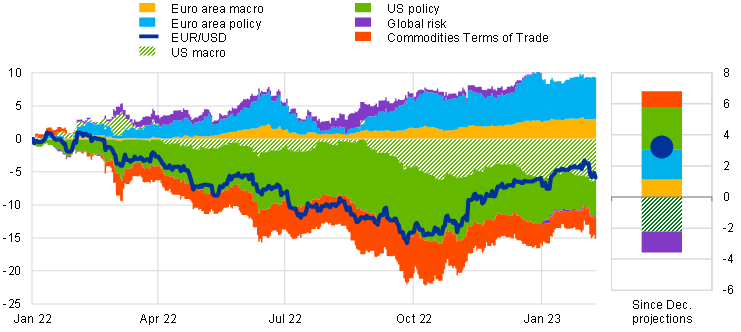
Sources: ECB and ECB calculations.
Notes: A decrease denotes a euro depreciation against the US dollar. The decomposition of exchange rate changes is based on an extended two-country Bayesian vector autoregression (BVAR) model including ten-year euro area overnight index swap rate, euro area stock price, EUR/USD, ten-year euro area overnight index swap-US Treasury spread, US stock prices and the relative Citi commodities terms-of-trade index in the euro area compared with the United States. An adverse euro area terms-of-trade shock is assumed to depreciate the euro against the dollar, reduce euro area equity prices, and increase euro area yields and yield spreads against the United States. Identification via sign and narrative restrictions, using daily data. “Dec. projections” refers to the December 2022 Eurosystem staff macroeconomic projections for the euro area. The latest observation is for 10 February 2023.
Moreover, current developments alleviate the concerns that high energy prices could lead to a loss of potential output and thus exacerbate inflationary pressures[9]. I recently argued that this was still a conjecture rather than a fact.[10] But if energy prices continue to fall, potential output will prove more resilient.
In my view, even though we need to be cautious as energy prices are highly volatile, recent developments in energy markets have made the risks surrounding the inflation outlook more balanced.
Fiscal measures
One major factor behind the upward revision to the December inflation projections for 2024-25 was the assessment made by Eurosystem staff about the fiscal measures taken since 2022 to attenuate the impact of the energy shock.
The projections foresaw that the price-based measures – introduced or announced by governments in order to contain changes in consumers’ purchasing power over time – would reduce inflation this year. The projections also reflected the expectation that the bulk of these measures would be withdrawn next year, increasing inflation by 0.7 percentage points in 2024 and generating significant carry-over effects for 2025. And this delayed the moment at which inflation was projected to return to our 2% target, with important implications for our monetary policy decisions. Moreover, according to the projections, most of these measures would not be limited to vulnerable population groups, potentially creating an expansionary impulse for demand.
As I argued recently[11], this risked creating a highly inefficient interaction between monetary and fiscal policies. Fiscal measures that were introduced to protect consumers’ purchasing power might paradoxically trigger a contractionary monetary policy reaction that would hit the real economy, reducing household incomes and increasing the interest bill for governments. This would be like giving with one hand and taking away with the other.
This assessment of the inflationary effects of the fiscal measures is however surrounded by high uncertainty. Discretionary fiscal spending is hard to predict accurately, and the measures could be adjusted to avoid inefficient interactions with monetary policy. Indeed, some governments have announced that they may reduce spending on energy price brakes or move to more targeted income-based measures. Moreover, falling energy prices are likely to imply that energy support measures will be less extensive than foreseen in the December projections. This is also contributing to the rebalancing of risks to inflation.
Wage developments
Another factor that drove up our projections was wage growth. As workers sought compensation for high inflation, we expected wages to accelerate. This robust wage dynamic boosted the baseline projection and the risks surrounding it, as accelerating wages coupled with a tight labour market could raise the spectre of a wage-price spiral.
Wages are still a source of upside risk. In the seven countries covered by the ECB’s wage tracker, recently concluded agreements signal that wage pressures are rising (Chart 6), albeit remaining consistent with the December projections.
Chart 6
Wage developments
(annual percentage changes)
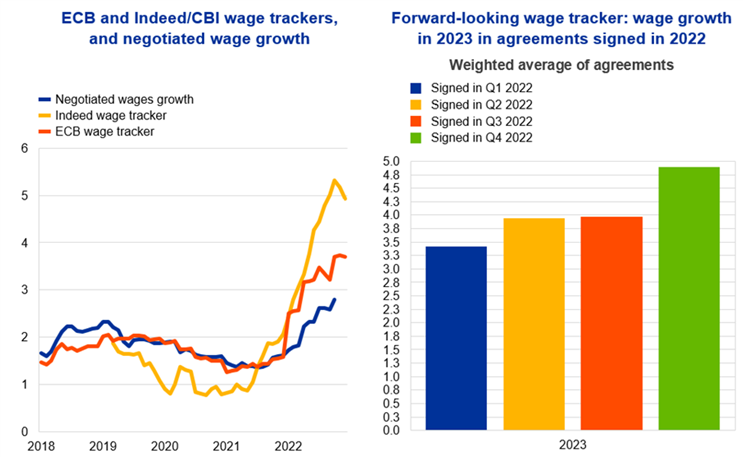
Sources: Left panel: Eurostat, ECB, national sources. The difference between the ECB wage tracker and negotiated wage growth series in 2022 is mostly due to different series of negotiated wage growth for France, with the ECB euro area tracker using wage growth in sectoral negotiations in France. Data on Indeed wage trackers can be found here.
Right panel: Calculations based on micro data on wage agreements provided by Bundesbank, Banco de España, the Dutch employer association AWVN, Oesterreichische Nationalbank, Bank of Greece, Banca d’Italia and Banque de France. Data for FR are based on an updated version of Gautier, E. (2022): “Negotiated wage rises for 2022: the results so far”, Eco Notepad, No 269, Banque de France.
Notes: Euro area aggregate is based on ES, IT, GR, AT, DE, NL and FR.
The latest observations are November 2022 for negotiated wages (excluding NL), fourth quarter of 2022 for the wage trackers.
But so far there is no convincing evidence that inflation expectations are de-anchoring, which is a necessary condition for a wage-spiral to take hold. Survey evidence suggests that consumers expect inflation to moderate over the medium term.[12] And longer-term inflation expectations remain firmly anchored.[13]
The upside movement in wages might reflect a one-off rebalancing in the income distribution between workers and firms. Workers have so far borne the brunt of the “Putin tax”, suffering a large loss of real income while, on balance, firms’ mark-ups remained stable or even increased in some sectors.[14] Ultimately, the “tax” will be absorbed by the factors of production – labour and capital – in proportion to their respective bargaining power in the labour market.
Moreover, lower energy prices limit workers’ loss of real income, thereby containing their drive to seek compensation through higher wages. And lower energy bills reduce input costs, allowing firms to better absorb wage increases without having to raise prices in response. In this way, we could see strong one-off wage growth but limited aggregate “cost-push” effects that raise core inflation.
All in all, higher wage increases do not necessarily signal a persistent divergence from our 2% inflation target. But we cannot rule out that stronger and sustained wage dynamics will take hold if above-target inflation proves to be persistent. I consider this risk broadly unchanged compared with the December projections.
Risks to the growth outlook
The same supply shocks that are rebalancing the risks to inflation are also rebalancing the risks to growth.
Since December, economic activity and labour markets have proven more resilient than expected. And the outlook may improve further as lower energy prices support the economy and economic confidence in the current context of robust job growth. That could reduce the downside pressure on the prices of core goods and services.
These positive developments could be partly counterbalanced by the appreciation of the exchange rate and the tightening of credit conditions observed in recent months. And macro-econometric models may only partially capture the contractionary effects of our sizeable monetary policy tightening.[15]
There is also high uncertainty surrounding the international environment. While the US economy is decelerating, its labour market has recently surprised on the upside. In China, the exit from zero-COVID policy has led to a wave of infections that have adversely affected the economy, but the outlook is expected to improve as the economy reopens. More broadly, global demand and supply remain difficult to predict in view of geopolitical unknowns and the synchronised tightening by major central banks across the world.[16]
In short, the next steps facing monetary policy are anything but obvious.
A data-dependent monetary policy with a clear reaction function
So how should policy respond to this environment?
The benefits of data dependency
There are times when it makes sense to commit to a specific future course of monetary policy action – this is what we call forward guidance. That is the case when the economy faces deflationary risks and interest rates are at their lower bound.[17] And it can also be true when faced with inflationary risks: if the outlook changes rapidly and the monetary stance becomes clearly inappropriate, the commitment to normalise policy rates quickly is key to anchor inflation expectations.[18]
But today we are in a different situation. Monetary policy has already made a sizeable adjustment, and we now face inflation uncertainty in both directions. Moreover, we are not constrained in using interest rates to return to our target.
Forward guidance is therefore unnecessary. In fact, it would be tantamount to tying our own hands at a time when the inflation outlook can change rapidly.
In such circumstances, a truly data-dependent approach to calibrating monetary policy is preferable since it enables us to react nimbly to the incoming data. And it gives us enough time to see how our decisions affect the wider economy – a process that is hard to assess today.
Given the extent and speed of our tightening so far, there is a question mark over just how fast and how strong its effects on the economy will be.
Very early evidence suggests that bank lending rates are increasing more quickly than in previous hiking cycles, in line with the steeper increase in policy rates. And lending to firms and households is decelerating rapidly (Chart 7).
Chart 7
Key macro-financial variables during hiking cycles
(cumulative changes in percentage points for policy and lending rates; index (t=1) for total credit to firms and loans to households for house purchase)
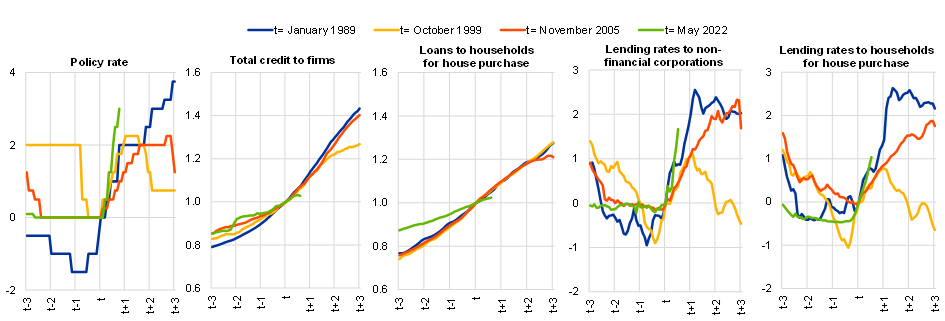
Sources: ECB, Eurostat and ECB calculations.
Notes: The ECB-relevant policy rate is the Lombard rate up to December 1998, the MRO up to May 2014 and the DFR thereafter. Total credit to firms includes borrowing from banks and debt securities issued by non-financial corporations. Monetary financial institution loans to firms and households are adjusted for sales, securitisation and cash pooling. Data for debt securities and private residential investment before 1989 are not available and have been estimated. Latest observations are December 2022 for lending rates and loans, January 2022 for HICP and February 2022 for the DFR.
But given the long lags with which monetary policy is transmitted to the real economy,[19] most of the effects of our tightening are still ahead of us. This means, for example, that the current adjustment in the credit market – involving higher loan rates, as well as tighter lending standards and lower demand for loans to firms and households (Charts 8 and 9) – will likely compress consumption and investment in the coming months.
Chart 8
Changes in credit standards and demand for loans to euro area firms
(net percentages)

Source: Bank Lending Survey (BLS).
Notes: The net percentage for credit standards refers to the difference between the sum of the percentages of banks responding “tightened considerably” and “tightened somewhat” and the sum of the percentages of banks responding “eased somewhat” and “eased considerably”. The net percentage for loan demand refers to the difference between the sum of the percentages of banks responding “increased considerably” and “increased somewhat” and the sum of the percentages of banks responding “decreased somewhat” and “decreased considerably". Net percentages for the “Other factors” refer to further factors which were mentioned by banks as having contributed to changes in credit standards.
Latest observation: January 2023 BLS.
Chart 9
Changes in credit standards and demand for loans to euro area households for house purchases
(net percentages)
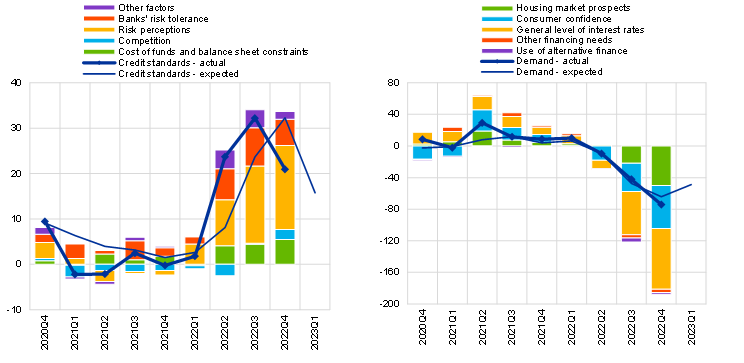
Source: BLS.
Notes: The net percentage for credit standards refers to the difference between the sum of the percentages of banks responding “tightened considerably” and “tightened somewhat” and the sum of the percentages of banks responding “eased somewhat” and “eased considerably”. The net percentage for loan demand refers to the difference between the sum of the percentages of banks responding “increased considerably” and “increased somewhat” and the sum of the percentages of banks responding “decreased somewhat” and “decreased considerably". Net percentages for the “Other factors” refer to further factors which were mentioned by banks as having contributed to changes in credit standards.
Latest observation: January 2023 BLS.
In the light of this, we increasingly need to consider the risk of overtightening. After many years of low growth, tipping the economy into a full-scale recession could trigger a permanent destruction of productive capacity and harm future employment opportunities, especially for the vulnerable members of society. Even if subsequently corrected, such overtightening would be very costly, given the low flexibility of the European economy.[20]
Overall, monetary policy needs to react forcefully when major shocks hit the economy and push inflation in a clear direction. But when risks are more balanced, a data-dependent approach is a prerequisite to avoiding costly mistakes.
Clarifying the reaction function
For such a data-dependent approach to be effective and avoid exacerbating uncertainty, we need to give some guidance on our future policy. Although we should avoid giving unconditional forward guidance on the policy rate path many months ahead, a meeting-by-meeting approach alone may not suffice. It may leave investors in the dark, having to guess our future moves and focusing on the near term[21].
To deal with this conundrum, we must instead provide investors with a framework for how we evaluate and respond to the incoming information. In other words, we need to clarify our reaction function.
In line with our price stability mandate, our reaction function is informed by the inflation outlook as well as the risks surrounding it. And it is designed to ensure that inflation returns to 2% without undue delay, taking into account the lags with which our monetary policy operates.
A proper understanding of this reaction function can benefit from two important clarifications.
The first is what will contribute to determining our reaction – that is, the set of factors that will affect inflation the most at our medium-term policy horizon[22].
At the global level, the most significant of these factors are energy prices, simply because lower energy prices are crucial for current inflationary pressures to unwind.
As for the domestic economy, a key factor in the coming months will be how rapidly lower energy prices and the associated lower cost pressures for firms are passed on to retail prices. In this respect, we need to carefully monitor mark-ups and wage growth, which could push in the opposite direction; for wages, we need to distinguish one-off adjustments from generalised increases, which could trigger self-sustaining wage-price rises. The conditions in the credit market are also important: we need to assess how fast credit to the economy is contracting and what its effects are on consumption and investment.
Second, we need to clarify how we should react to new information.
Last year, the need to normalise monetary policy quickly from a very accommodative starting point placed emphasis on the pace of rate hikes to prevent inflation becoming entrenched.
But now that we have made a major policy adjustment, the extent and duration of restriction have become increasingly relevant. By smoothing our policy rate hikes – that is, moving in small steps – we can ensure that we calibrate these two elements more precisely, remaining truly data-dependent and avoiding mistakes. This means that we will need to act in a non-mechanical way, keeping a genuine forward-looking approach and avoiding overreacting to individual data points.
We also need to ensure consistency across our tools. It is natural to normalise the size of the balance sheet in a tightening phase, thereby making it “push” in the same direction as our interest rate policy. But we are in unprecedented territory, and the pace of normalisation should be gradual and prudent, with rates remaining the key instrument to steer our monetary stance. There is little reliable experience of balance sheet tightening. It is hard to assess how a contraction of our balance sheet will affect bond markets and financial stability – especially if it happens in conjunction with an abrupt increase in interest rates.
What we do know is that we must preserve the singleness of our monetary policy by ensuring that our policy impulse is transmitted smoothly across all euro area countries. We should remain committed to all our lines of defence, which reinforce each other. First, a measured approach to hikes and balance sheet normalisation. Second, the flexibility embedded in our reinvestments under the pandemic emergency purchase programme. And third, the Transmission Protection Instrument.
Conclusion
Let me conclude.
The energy shock has coincided with the post-pandemic reopening of the economy to result in persistently high inflation in the euro area.
That in turn has increased the risk of a de-anchoring of inflation expectations and inflationary wage-price dynamics. In response, we have tightened our monetary policy decisively to prevent inflation becoming entrenched in the economy.
But as policy rates move more firmly into restrictive territory and the energy shock abates, the risks to the inflation outlook have become more balanced. And the outlook for the economy and inflation has become increasingly uncertain, both globally and in the euro area.
In this environment, we no longer need to overweight upside risks to avoid worst-case scenarios. We now need to take into account the risk of overtightening alongside the risk of doing too little.
A data-dependent calibration of monetary policy – firmly rooted in a clear reaction function – offers the best way forward. It will enable us to clarify our policy intentions, providing markets with the necessary guidance while keeping volatility in check. In parallel, by smoothing our policy moves we ensure that their cost to the economy is minimal.
This doesn’t mean we will not be resolute in the fight against inflation. It means being resolute in the right direction. What we do not want is “to drive like crazy at night with our headlights turned off” – as Italian singer Lucio Battisti once put it.[23]
Thank you.
Panetta, F. (2022), “Europe as a common shield: protecting the euro area economy from global shocks”, keynote speech at the European Parliament’s Innovation Day “The EU in the world created by the Ukraine war”, 1 July.
Panetta, F. (2022), “Mind the step: calibrating monetary policy in a volatile environment”, speech at the ECB Money Market Conference, 3 November.
In December 2021 we announced a step-by-step reduction in net asset purchases under our asset purchase programme (APP) and the discontinuation of net asset purchases under the pandemic emergency purchase programme at the end of March 2022. In March 2022 we accelerated the reduction of net purchases under the APP and in April we pre-announced their discontinuation in the third quarter. In July we raised the ECB key interest rates for the first time in 11 years.
This pace applies until the end of June. The subsequent pace of portfolio reduction will be determined over time.
The Survey of Professional Forecasters for the first quarter of 2023 sees inflation at 2.7% in 2024 (0.7 percentage points below our projection) and at 2.1% in 2025. The Survey of Monetary Analysts for February 2023 sees inflation back to 2.1% in the fourth quarter of 2024 and 2.0% in the first quarter of 2025. The European Commission’s Winter 2023 Economic Forecast projects inflation at 2.5% in 2024.
When inflation changes rapidly, either upwards or downwards, the year-on-year inflation rates that are typically used in the public debate (i.e. the change in prices compared with one year ago) may not be very informative about the current change in the prices of goods and services. This reflects the fact that year-on-year inflation rates may give too much weight to data that are too far in the past. In such a situation, it is useful to get an indication about turning points by also looking at more recent inflation developments, including changes in prices over a period of three months or six months based on seasonally adjusted data. However, such shorter time horizons give more weight to recent shocks, some of which may be temporary.
As euro area energy and commodity imports are often dollar-denominated, lower energy and commodity prices reduce the demand for dollars.
It should however be noted that dollar-denominated commodity prices are, at least in part, jointly determined with euro-dollar exchange rate in global financial markets.
In theory, permanently higher energy prices could lower potential output, for instance by making energy-intensive production technology unprofitable. However, there is no clear empirical evidence that oil price shocks have a lasting effect on potential output and recent analysis by ECB staff suggests that shocks analogous to those seen in recent months are likely to have limited effects on potential output, and that those effects are surrounded by considerable uncertainty. See Le Roux, J., Szörfi, B. and Weißler, M. (2022), “How higher oil prices could affect euro area potential output”, Economic Bulletin, Issue 5, ECB.
Panetta, F. (2022), “The complexity of monetary policy”, keynote speech at the CEPR-EABCN conference on “Finding the Gap: Output Gap Measurement in the Euro Area” held at the European University Institute, 14 November.
Panetta, F. (2023), Interview with Handelsblatt, 24 January.
ECB (2023), Consumer Expectations Survey results – December 2022.
In the Survey of Monetary Analysts for February 2023, longer-term expectations for headline inflation stood at 2.0% and in the Survey of Professional Forecasters for the first quarter of 2023, longer-term expectations for headline inflation were 2.1%.
As suggested by national accounts data.
The current extraordinary situation poses a challenge to conventional tools in assessing the macroeconomic ramification of the sharp and sizeable re-orientation of the monetary policy posture and its effects on the various channels through which it affects demand and inflation (exchange rate, consumption, investment, expectations, bank lending, assets prices, etc.). A set of models designed to assess the impact of monetary policy suggests that the tightening may have significantly larger effects than estimated through standard projection tools.
See Dieppe A. and Brignone D. (2022), “Synchronised interest rate hikes, spillovers and risks to global growth”, VoxEU, 14 November, and Panetta, F. (2022), “Mind the step: calibrating monetary policy in a volatile environment”, speech at the ECB Money Market Conference, 3 November.
In this setting, one way to engineer a looser monetary stance is to act on expectations of future rates by signalling that policy rates will remain low for a long time.
Equally, when inflation risks are heavily to the upside, there is a case for programming a series of hikes to avoid an inflationary spiral.
Model-based analysis by ECB staff suggests that, on average, the impact of a rate hike on inflation builds up gradually over time to reach its peak during the second year following the initial shock. See Lane, P. (2022), “The transmission of monetary policy”, speech at the SUERF, CGEG|COLUMBIA|SIPA, EIB, SOCIÉTÉ GÉNÉRALE conference on “EU and US Perspectives: New Directions for Economic Policy”, 11 October.
Empirical analyses show that the euro area is typically slower to recover from recessions than other large economies. In particular, it lags significantly behind the United States in terms of labour market efficiency (although levels for individual euro area countries vary; see Chart 1 in Sondermann, D. (2018), “Towards more resilient economies: The role of well-functioning economic structures”, Journal of Policy Modeling, Vol. 40, No 1, pp. 97-117). Productivity growth has also generally been lower in the euro area than in the United States (see Chart 7 in Masuch, K. et al. (eds.) (2018), “Structural policies in the euro area”, Occasional Paper Series, No 210, ECB, June). These factors may limit the euro area’s relative capacity to bounce back from a recession.
If the yield curve gets unanchored it becomes harder for the central bank to deliver inflation at target and minimise side effects on the economy.
We have a medium-term orientation in pursuing price stability to account for the lags in the transmission of monetary policy to the economy and to inflation. The definition of medium term, however, is flexible because the appropriate monetary policy response to a deviation of inflation from the target depends on the origin, magnitude and persistence of the deviation. See ECB (2021), “An overview of the ECB’s monetary policy strategy”, July.
Battisti, L. (1970), Emozioni.
Banco Central Europeu
Direção-Geral de Comunicação
- Sonnemannstrasse 20
- 60314 Frankfurt am Main, Alemanha
- +49 69 1344 7455
- media@ecb.europa.eu
A reprodução é permitida, desde que a fonte esteja identificada.
Contactos de imprensa-
16 February 2023