
The euro area and its Monetary Policy
President’s Address by Jean-Claude Trichet, President of the ECBat the conference “The ECB and its Watchers IX” Frankfurt am Main, 7 September 2007
Ladies and Gentlemen,
Television dramas tend to be made about medical rescue teams, hospital emergency rooms and heart surgeons, not about the internists who regularly take your blood pressure and check your cholesterol.
A central bank has one emergency room which – sporadically – tackles casualties of car accidents and applies angioplasty and bypass surgery. These are, for example, the exceptional decisions on the refinancing on the money market to help it normalize its functioning. But these activities – critical as they are to the functioning of the system – make up a small fraction of their duties. Central banks are for the most part made up of legions of internists who stare at your X-rays and engage in sober consultations. At the end, they write diagnostic statements based on regularities and new facts – facts that can change your conditions in the longer run. We call regularities the “deep structure of the economy”. We call the new facts “shocks”.
The deep structure is formed by economic institutions, which take considerable time to develop. So central banks, not unlike doctors, take them largely as given. Shocks occasionally surprise economic agents, causing them to revise their medium-term outlook.
Because constant monitoring of regularities and new facts that can change the outlook in a long-lasting fashion is what we practice most often in central banks, central bank watchers should resist the temptation to focus on the drama of emergency medicine. Central banking is prevention and regular, unglamorous assistance – the better part of cure. It is concerned always with life-time health conditions, only occasionally with emergency interventions, and never with the application of quick fixes.
So I will concentrate on structure and facts that can change the outlook in a long-lasting fashion, not on the drama. And I will give you a diagnosis and draw an inference for monetary policy.
Diagnosis
The diagnostic part of my observations has two elements. One is a basic stylised fact that can be shown – like an X-ray – in a simple picture. The second element consists in a substantial body of evidence on the deep economic structure that forms the landscape in which monetary policy in the euro area has to operate. I will argue that the two elements taken together – the stylised fact and what we know about the deep economic structure – pose a puzzle. I will then offer the key to solving the puzzle.
Take the simplest measure of economic performance, the mean and the standard deviation of annual CPI inflation and of a conventional measure of detrended output for the euro area, the United States and several other countries over the period following the start of Economic and Monetary Union (EMU). Plot these statistics in the same chart and treat this simple picture as a representation of the facts. [Figure 1 does this in the form of a scatter-plot. [1]] In order to make the comparison meaningful, take detrended output, which in the short-to-medium term reflects output movements over and above the low-frequency variation that is beyond the control of monetary policy. If you compare means and standard deviations across countries, several interesting aspects emerge from the chart.
Figure 1. Inflation and de-trended output: means and volatilities since January 1999
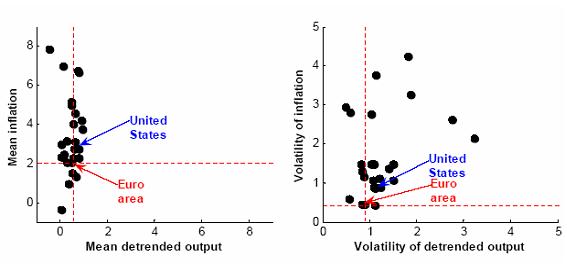
Source: ECB calculations
First, and almost en passant, you are led to confirm a fundamental economic principle which is a cornerstone of our monetary framework: higher inflation is not automatically associated with a superior economic performance. Comparing means – of inflation and detrended output – across countries you can find simply no connection between average inflation and average macroeconomic performance, even at business cycle frequencies. As a simple corollary, higher inflation merely imposes additional costs on the economy, costs which it is my precise duty to spare euro area businesses and consumers. [2]
But it is by comparing volatilities in the right-hand panel that you would be most surprised. In terms of volatility, the euro area exhibits a remarkable comparative performance for what concerns both inflation and detrended output. EMU has kept inflation in the vicinity of levels consistent with our objective, without this having caused abnormal swings in business conditions.
When seen from an international perspective, real activity in the euro area – in its deviation from trend – has been remarkably in line with that seen in other countries, but with a crucial difference: euro area inflation has been appreciably lower and more stable, thus benefiting consumers and allowing businesses to make decisions within an economic environment unclouded by the “fog” that inflation inevitably creates. In the volatility scatterplot, you would find the euro area at bottom-left corner, close to the zero point: low inflation volatility has not come at the cost of larger swings in activity.
Now, moderate real and nominal volatilities are hard to square – at first sight – with the second element of my diagnosis: a structural environment in the euro area characterised by pervasive rigidities. While the sources of structural rigidities in the euro area are manifold, I will single out one dimension on which we have access to high-quality information, nominal rigidities. Here I can build on an extensive body of empirical research into price flexibility that has been assembled by staff of the European Central Bank (ECB) and of the entire European System of Central Banks in a monumental analytical effort to identify the main microeconomic facts on which the workings of EMU are founded. [3] This research comes to one main conclusion. In the euro area, prices are distinctly less flexible than, say, in the United States.
Prices change infrequently. The frequency of price adjustments – the share of prices in a representative sample of product categories that are changed each month – is low relative to the US record [Table 1]. The average duration of a consumer price spell – a measure of the time that it takes for retailers to re-price their products – is 13 months. According to surveys, the average producer price spell is 11 months. In the United States, comparable figures indicate durations of less than 7 months and slightly more than 8 months respectively. [4]
More infrequent price revisions make the setting of prices less responsive to economic news, including changes in monetary conditions. In general, sticky price revision processes reduce the odds that the imbalances created by economic shocks can be rectified by adjustments in prices. Symmetrically, they make the burden of adjustment to a shock fall disproportionately on changes in output, incomes and employment. Also, stickier prices tend – all other things being equal – to increase the persistence of inflation. This is because the impact of a shock that today modifies firms’ real cost conditions, and whose impact is itself protracted by transmission lags in the real economy, tends to be spread out over an extended future, as staggered price adjustments catch up only slowly with the changed underlying circumstances.
Table 1: Measures of price stickiness for the euro area and the United States
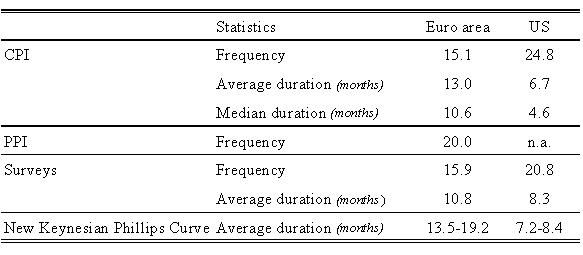
Sources: On CPI for the euro area, Dhyne et al. (2005); for the United States, Bils and Klenow (2004). For the producer price index, PPI, Vermeulen et al. (2005). Surveys: for the euro area, Fabiani et al. (2005); for the United States, Blinder et al. (1998). New Keynesian Phillips curve: estimates from Galí et al. (2001, 2003), referring to the GDP deflator and converted from original quarterly figures.
As I mentioned before, this evidence poses a puzzle. By placing the great burden of macroeconomic adjustment on volumes rather than prices, nominal rigidities tend to increase – not decrease – the volatility of real activity that an economy would experience at any level of inflation volatility. Indeed, symmetrically, stabilising inflation at levels consistent with the central bank’s objective is more costly – and thus less likely to happen – in economies where prices are slow to respond to innovations. Bearing in mind the microeconomics of price adjustments in continental Europe, one would thus expect to see the euro area in the upper-right-hand quadrant of the volatilities scatterplot. Instead, as the scatterplot makes clear, the volatilities of both inflation and detrended output have been remarkably low under EMU, lower than in more flexible economies. What can reconcile the facts with the structural evidence?
A first possibility is that, since January 1999, the euro area has simply been lucky, and has been hit by a sequence of smaller and more favourable shocks than other economies. Reduced shock volatility may have created a steadier economic picture, and thus steady inflation and output.
Structural analysis does not support this conjecture, however. As a matter of long-run regularities, the variance of the shocks hitting the euro area economy is not statistically different than that, say, in the United States, the epitome of a flexible economy. [5] More to the point, over the past eight years, the shocks that have driven the business cycle in the euro area and US economies have differed in timing and nature, not in magnitude. [6] The shocks that in late 2000 drove the United States into recession hit almost a year before those that produced the slump in the euro area. But, when the sharp reappraisal of the outlook in 2000 caused the markets to collapse and business investment to enter a prolonged phase of retrenchment, capital deepening in the United States was promptly replaced, as the main engine of output-per-hour growth, by extraordinary advancements in total factor productivity. As I have argued elsewhere, US firms have been able to meet expanding demand with a more efficient organisation of their production processes. [7]
The same ten-year episode had a distinctly different face in the euro area. In the downswing that started in 2001, a decline in total factor productivity reinforced, rather than offset, the diminishing contribution of capital. [8] Rapidly decelerating productivity was one force behind the counter-cyclical rebound in unit labour costs that we observed during the early part of the new millennium. [9]
These events played out for much of the short history that is summarised in the volatilities scatterplot. All in all, the technological shock was negative, protracted and quantitatively important, a primary additional drag on activity in a phase of falling demand and dim economic prospects.
During this time, if shocks were no milder or more benign, moderate volatilities and sticky underlying mechanisms of macroeconomic adjustment in the euro area still need to be reconciled. An alternative channel might hold the key to resolving the puzzle. This channel is suggested by time series evidence that points to low inflation persistence in the euro area. [10] The extent of serial correlation that one can find in inflation statistics is very moderate. An inflationary shock dissipates quickly in the euro area despite rigidities, and inflation has a tendency to return to its long-run norm reasonably quickly. The duration of the effect of a shock to inflation is considerably less than one year, which is close to the figure that one obtains, for example, for the United States, again notwithstanding vastly different patterns of price-updating practices across the two areas.
Recent ECB research goes further than pure time series analysis, and helps it to be interpreted. [11] This research – adopting a structural approach – identifies the launch of EMU and the establishment of a clearly defined nominal anchor as the defining event that changed the very nature of the inflationary process in the euro area. This institutional break has eradicated the “intrinsic” component of the inflation formation mechanism, namely the extent to which economic agents – in re-setting prices or negotiating wages – look at the past history of inflation, rather than into the eyes of the central bank.
To be sure, this phenomenon is not confined to the euro area. The results of this research, reported in Table 2 show that the introduction of clearly defined nominal anchors has been associated with the disappearance of intrinsic persistence in other countries as well. When structural models of inflation are estimated over the full data samples – i.e. including years during which virtually none of these economies enjoyed monetary stability – intrinsic persistence is estimated to be uniformly high. This is perfectly logical and to be expected, since for all these economies the full samples include observations from the Great Inflation of the 1970s, with its erratic inflation fluctuations. In the absence of guidance from central banks, extrapolation of past experience was a secure way for price and wage setters to protect the real value of earnings and returns. Through this mechanism, past inflationary shocks tended to be perpetuated and become endemic.
Table 2: Estimates of intrinsic inflation persistence by monetary regime
| Full sample | European Monetary Union | |
| Euro area | 0.855 | 0.000 |
| New monetary regime | ||
| Switzerland | 0.672 | 0.000 |
| Inflation targeting | ||
| United Kingdom | 0.600 | 0.008 |
| Canada | - | 0.103 |
| Australia | 0.539 | 0.010 |
| Sweden | - | 0.000 |
| New Zealand | - | 0.006 |
| After the Great Inflation | ||
| United States | 0.904 | 0.519 |
| Japan | 0.660 | 0.634 |
Sources: Benati (2007). Figures report the mode of the estimated structural persistence parameter in conventional hybrid Phillips curves, featuring a foward-looking and a backward-looking term for inflation. Monetary regimes are defined as follows. For the euro area, the full sample is 1970Q1-2006Q4, and the European Monetary Union period includes 1999Q1-2006Q4. For Switzerland, the full sample is 1970Q1-2006Q4, and the new monetary regime includes 2000:1-2006:4. For the United Kingdom the full sample is 1963Q1-2006Q4, and the inflation targeting period includes 1992Q4-2006Q4. For Canada the inflation targeting sample includes 1991Q1-2006Q4. For Australia, the full sample includes 1969Q3-2006Q3, and the inflation targeting sample includes 1994Q3-2006Q3. For Sweden, the inflation targeting sample includes 1993Q1-2006Q3. For New Zealand, the inflation targeting sample includes 1990Q1-2006Q4. For the US, the full sample is 1954Q3-2007Q1, and after the Great Inflation includes 1983Q1-2007Q1. For Japan, the full sample includes 1957Q1-2006Q4, and after the Great Inflation includes 1983Q1-2006Q4.
However, when the same test is conducted on a restricted sample, including the most recent years only, a dramatic difference emerges between the economies where there is a clearly defined objective of price stability – namely the euro area, Switzerland and the inflation-targeting regimes –and the rest of the sample. While in the former group intrinsic persistence has entirely vanished – to the point that, today, inflation can be characterised as a quasi-pure forward-looking process – in the latter it is still clearly there, and is still comparatively high. [12] Research in the Federal Reserve System has produced reinforcing evidence of this. [13]
What can explain these results? Although, it is certainly possible to conjure up many different and convoluted explanations, Occam’s razor naturally cuts through all and picks the simplest and most logical one. And the simplest, most logical and most elegant explanation is that, even if “hardwired” nominal and real sluggishness introduces persistence into the inflation process – which in itself tends to perpetuate past inflation pressures into the future [14] – a great portion of that persistence can be eradicated if the expectations of price and wage-setters are focused on the objective of the central bank. Indeed, another ECB study finds that the influence of the ECB’s numerical objective of price stability on the evolution over time of inflation outweighs the influence of past shocks, and thus to a great extent compensates for the added inertia resulting from a more rigid economic structure. [15]
Returning to my original puzzle, we now have what I think is a simple and theoretically sound explanation: by eradicating intrinsic inflation persistence from the economy, the current monetary regime has improved the inflation-output volatility trade-off, moving the euro area economy down and to the left – close to the zero point – where indeed you would find it in the scatterplot.
Was it luck? As the time-honoured saying goes, “The harder I try, the luckier I get”.
Alertness
The nature of the inflation process and the structural peculiarities of the euro area – some of which I tried to outline in my remarks today – have played an important role in positioning the stance of monetary policy over the past. The policy course was carefully calibrated to a rigid environment where, however, expectations have learned to look forward – and into the eyes of the ECB – rather than backward.
For one thing, we have been guided by the understanding that a central bank operating in a relatively rigid economy is able to exert the same amount of impact by adjusting its policy instrument in more moderate steps than in a relatively more flexible economy. Under the structural conditions that prevail in our economy, an erratic policy course would introduce unwelcome volatility in both inflation and output that would necessitate corrective, countervailing action further down the road.
And such harmful side-effects would be compounded in an economy where the inflation process is intrinsically forward-looking. In these conditions, a central bank that moves its policy rate around in response to each twist and turn in the data loses influence and works against its own intentions, because policy shifts that lack a steady orientation do little – in such an environment – to guide expectations when agents build their decisions on policy patterns, on the central bank’s long-term strategic orientations, rather than on extrapolations of their past experience.
The steady course of our policy did not impede a smooth adjustment of the euro area to the shocks that have hit the global economy over the turn of the century.
The markets have internalised these strategic principles with an increasing degree of precision. In some notable instances in the past, we were even able to steer market expectations effectively without explicit action, proof that markets accept as true the ultimate motives of policy that we profess. In those instances in which expectations displayed signs of overreaction to current events our renewed emphasis in communication on our objective, on the determination that we would apply to enforce it, on our steady alertness, provided effective resistance to inordinate developments. [16]
Over more recent times, incoming data which have indicated increasingly persuasive signs of a recovery in an environment of abundant credit and elevated commodity prices were correctly mapped into expectations that the stance would – gradually – be adjusted, consistent with our remit to control inflation over the medium term.
Concluding remarks
In retrospect, market expectations have aligned well with our intentions. They have internalised the principle that the withdrawal of accommodation is conditional on the evolution of our analysis. It is not been predicated on any single short-term indicator of the macroeconomic state. In the last few months, the ECB has not measured the state of the economy by the strength or weakness of any particular piece of incoming news. It has continued to extract the macroeconomic trend from the wealth of cumulative evidence accruing – from month to month – from the economic and the monetary side.
As I said yesterday, on behalf of the Governing Council, our monetary policy stance is still on the accommodative side and the medium term outlook for price stability remains subject to upside risks. I said that at the same time, the financial market volatility and reappraisal of risk of recent weeks have led to an increase in uncertainty. Given this high level of uncertainty, it is appropriate to gather additional information and to examine new data before drawing further conclusions for monetary policy in the context of our medium term oriented monetary policy strategy. That being said, our “constant steady alertness”, and determination to act in the future whenever it is necessary makes no doubt in the mind of observers.
By acting in a firm and timely manner we will ensure that risks to price stability over the medium term do not materialise and that medium term inflation expectations remain firmly anchored in line with price stability.
Particularly in times of high financial market volatility this continued solid anchoring of inflation expectations is one of the most precious assets on which we can draw to rebuild and consolidate the confidence which ultimately will itself permit the return to a normal functioning of the financial markets.
I thank you for your attention.
-
[1] For the euro area, inflation has been computed on the basis of the HICP. For all economies, the detrended measure of output is the Hodrick-Prescott-filtered logarithm of real GDP. With the exception of the euro area, the United States and the United Kingdom – for which data are from their respective national statistical agencies – all data are from the International Monetary Fund’s International Financial Statistics database. We have considered all the economies for which we could obtain data for both CPI inflation and real GDP.
-
[2] The average value of euro area detrended output under EMU, at 0.5, is exactly equal to the median of the distribution across countries (see the left-hand panel of the chart). To put it differently, over the period following the start of EMU, half of the countries in the sample experienced, on average, weaker economic conditions, while the other half had stronger pressures on economic resources. It could be noted that the favourable performance of the euro area might be due in part to the fact that the euro area is a collection of economies still lacking complete economic integration and thus over different cyclical phases. However, we have evidence of an increasing synchronisation of cycles within the euro area, which would weaken the argument.
-
[3] See E. Dhyne, L. Alvarez, H. Le Bihan, G. Veronese, D. Dias, J. Hoffmann, N. Jonker, P. Lünnemann, F. Rumler and J. Vilmunen (2005), “Price-setting in the euro area: some stylised facts from individual consumer price data”, ECB Working Paper No 524. The paper reports that the average duration of CPI price spells in the euro area is 4.3 quarters. By comparison, M. Bils and P. Klenow (2005), in “Some evidence on the importance of sticky prices”, Journal of Political Economy 112, calculate that the average duration of CPI prices in the United States is 2.2 quarters. Other Phillips curve-based analyses broadly confirm these results. For the euro area, see J. Galí, M. Gertler and D. López-Salido (2001), “European inflation dynamics”, European Economic Review 45(7), and J. Gáli, M. Gertler and D. López-Salido (2003), “Erratum”, European Economic Review 47(4).
-
[4] Allowing for methodological differences in price-collecting procedures across statistical institutes, it emerges that differences in the frequency of price adjustments can be due to various causes. Differences in the degree of competition, especially in the services sector, may be a factor, particularly given evidence that the divergence of such frequencies is most pronounced in that sector. Another often cited factor is that small corner shops, which change their prices less frequently than supermarkets, have a larger market share in euro area countries than in the United States.
-
[5] See in particular F. Smets and R. Wouters (2005), “Comparing shocks and frictions in US and euro area business cycles: a Bayesian DSGE approach”, Journal of Applied Econometrics, Vol. 20(2), March, pp. 161-183.
-
[6] See in particular L. Christiano, R. Motto and M. Rostagno (2007), “Shocks, structures or policies? The euro area and the US after 2001”, ECB Working Paper No 774, forthcoming in the Journal of Economic Dynamics and Control.
-
[7] See J.-C. Trichet (2006), “Activism and alertness in monetary policy,” lecture given at the Conference on Central Banks in the 21st Century, organised by the Banco de Espana (Madrid, 8 June). I expounded the reasons for sluggish productivity growth in the euro area in a recent lecture. See J.-C. Trichet (2007), “Productivity in the euro area and monetary policy,” special lecture delivered at the 22nd Annual Congress of the European Economic Association (Budapest, 27 August).
-
[8] Fresh evidence on the underlying factors explaining growth in the euro area and the US has become available in the so-called EU-KLEMS Growth and Productivity Accounts database, the first result of a two-year collaborative effort by researchers based on 16 institutions across the EU to produce long and internally consistent time series for output growth, employment, capital formation and total factor productivity at a disaggregated industry level. The dis-aggregation of output growth by source which results from this analysis indicates that the average contribution of capital to value added growth in the United States was 1 percentage point in the first half of the 1990s, increasing to 1.9 percent in the second half of the decade, and stabilising at 0.8 percentage point on average between 2001 and 2004. In the euro area – excluding Belgium, Greece, Ireland, Luxembourg, Portugal and Slovenia – the contribution of capital accounted for 1 percentage point in the first half of the 1990s and 1.4 percent in the second half, declining to 0.9 percentage points in 2001-2004. The TFP contribution in the United States was 0.7 percent in the first half of the 1990s, 1.4 percent in the second half of the 1990s and 1.9 percent on average between 2001 and 2004. In the euro area, the contribution of TFP was 0.2 percent during the first half of the 1990s, 0.9 percent during the second half and a disappointing -0.1 percent on average between 2001-2004. In my Budapest intervention, I mention the strengths and weaknesses of this body of evidence (see Trichet, J.C., 2007, op. cit.).
-
[9] Nominal wage growth per worker has been remarkably stable since the beginning of EMU but also relatively invariant to the cycle. So, the slowdown in labour productivity growth translated into greater increases in nominal unit labour costs in the contractionary phase between 2001 and 2003. See, for empirical evidence, A. Arpaia. and K. Pichelmann (2007), “Nominal and real wage flexibility in EMU,” European Economy Economic Papers No 281 (June).
-
[10] See F. Altissimo, M. Ehrmann and F. Smets (2006), “Inflation persistence and price-setting behaviour in the euro area – a summary of the IPN evidence”, ECB Occasional Paper No 46, June.
-
[11] See L. Benati (2007), “Investigating inflation persistence across monetary regimes”, ECB Working Paper, forthcoming.
-
[12] It is worth mentioning that there is a complete lack of persistence when structural models are estimated on the basis of data from another stable monetary regime, from a distant era: the classical gold standard (1879-1914). Benati (2007) shows that a century ago, exactly as today in the euro area, Switzerland and inflation-targeting countries, inflation exhibited no persistence and was purely forward-looking.
-
[13] See R. Gürkaynak, B. Sack and E. Swanson (2005), “The excess sensitivity of long-term interest rates: evidence and implications for macroeconomic models”, American Economic Review, 95(1), pp. 425-36 and R. Gürkaynak, A. Levin and E. Swanson (2006), “Does inflation targeting anchor long-run inflation expectations? Evidence from long-term bond yields in the U.S., U.K., and Sweden”, Federal Reserve Bank of San Francisco Working Paper 2006-09. The first paper finds that, while in the United States the difference between long-term forward rates on nominal and inflation-indexed bonds reacts significantly to macroeconomic announcements and new data releases – something which should not happen if inflation expectations were perfectly stabilised – in the United Kingdom there has been no such reaction since May 1997, when the Bank of England became independent. Again, the most logical explanation for this finding is that a clearly defined inflation target, coupled with central bank independence, has firmly anchored long-term inflation expectations, thus eliminating at the root the key cause of inflation persistence.
-
[14] Nominal price rigidities need not imply inflation persistence. For example, in a conventional simple New-Keynesian model with a Calvo-based Phillips curve, inflation is not inertial unless a backward-looking term is introduced in the Phillips curve itself. In this case, price-level inertia does not lead to inflation inertia. However, in a more complex model with wage and real rigidities of the sort that have become standard in dynamic general equilibrium modelling, inflation inherits persistence from the inertia that the real rigidities inject into firms’ real marginal costs. In this latter case, augmenting price-level inertia – a higher Calvo parameter – increases inertia in inflation. See for example the discussion in L. J. Christiano, M. Eichenbaum, and C. Evans (2005), “Nominal rigidities and the dynamic effects of a shock to monetary policy”, Journal of Political Economy, 113(1), pp. 1-45. Benati (2007), op. cit., convincingly argues that the intrinsic component of inflation persistence which many researchers have found in the past is the spurious statistical product of a central bank’s early failure to firmly stabilise inflation expectations. It is “spurious” is that such persistence is not “hardwired” in the structure of the economy – technically, it is not structural in the sense of the Lucas (1976) critique, and therefore invariant to policy – but is rather the product of the inability of monetary regimes lacking a clear nominal anchor to reliably guide expectations.
-
[15] See L. Christiano et al. (2007), op. cit.
-
[16] I have described this situation in an earlier intervention. See J.C. Trichet (2005), “Monetary Policy and ‘Credible alertness’,” speech delivered at the Panel discussion “Monetary Policy Strategies: A Central Bank Panel” at the Symposium sponsored by the Federal Reserve Bank of Kansas City, Jackson Hole, Wyoming, 27 August.
Banco Central Europeu
Direção-Geral de Comunicação
- Sonnemannstrasse 20
- 60314 Frankfurt am Main, Alemanha
- +49 69 1344 7455
- media@ecb.europa.eu
A reprodução é permitida, desde que a fonte esteja identificada.
Contactos de imprensa