
The ECB Survey of Professional Forecasters (SPF) - Third quarter of 2019
Summary
The results of the ECB Survey of Professional Forecasters (SPF) for the third quarter of 2019 show HICP inflation expectations of 1.3%, 1.4% and 1.5% for 2019, 2020 and 2021, respectively.[1] This represents downward revisions of 0.1 percentage points for each horizon relative to the previous survey. Longer-term inflation expectations were revised down to 1.7%. Real GDP growth expectations were broadly unrevised and stood at 1.2%, 1.3%, and 1.4% for 2019, 2020 and 2021, respectively, and at 1.4% for the longer term. Unemployment rate expectations were revised downwards across horizons and continued to point to further falls towards a longer-term rate of 7.3%.
Table 1
Results of the SPF in comparison with other expectations and projections
(annual percentage changes, unless otherwise indicated)
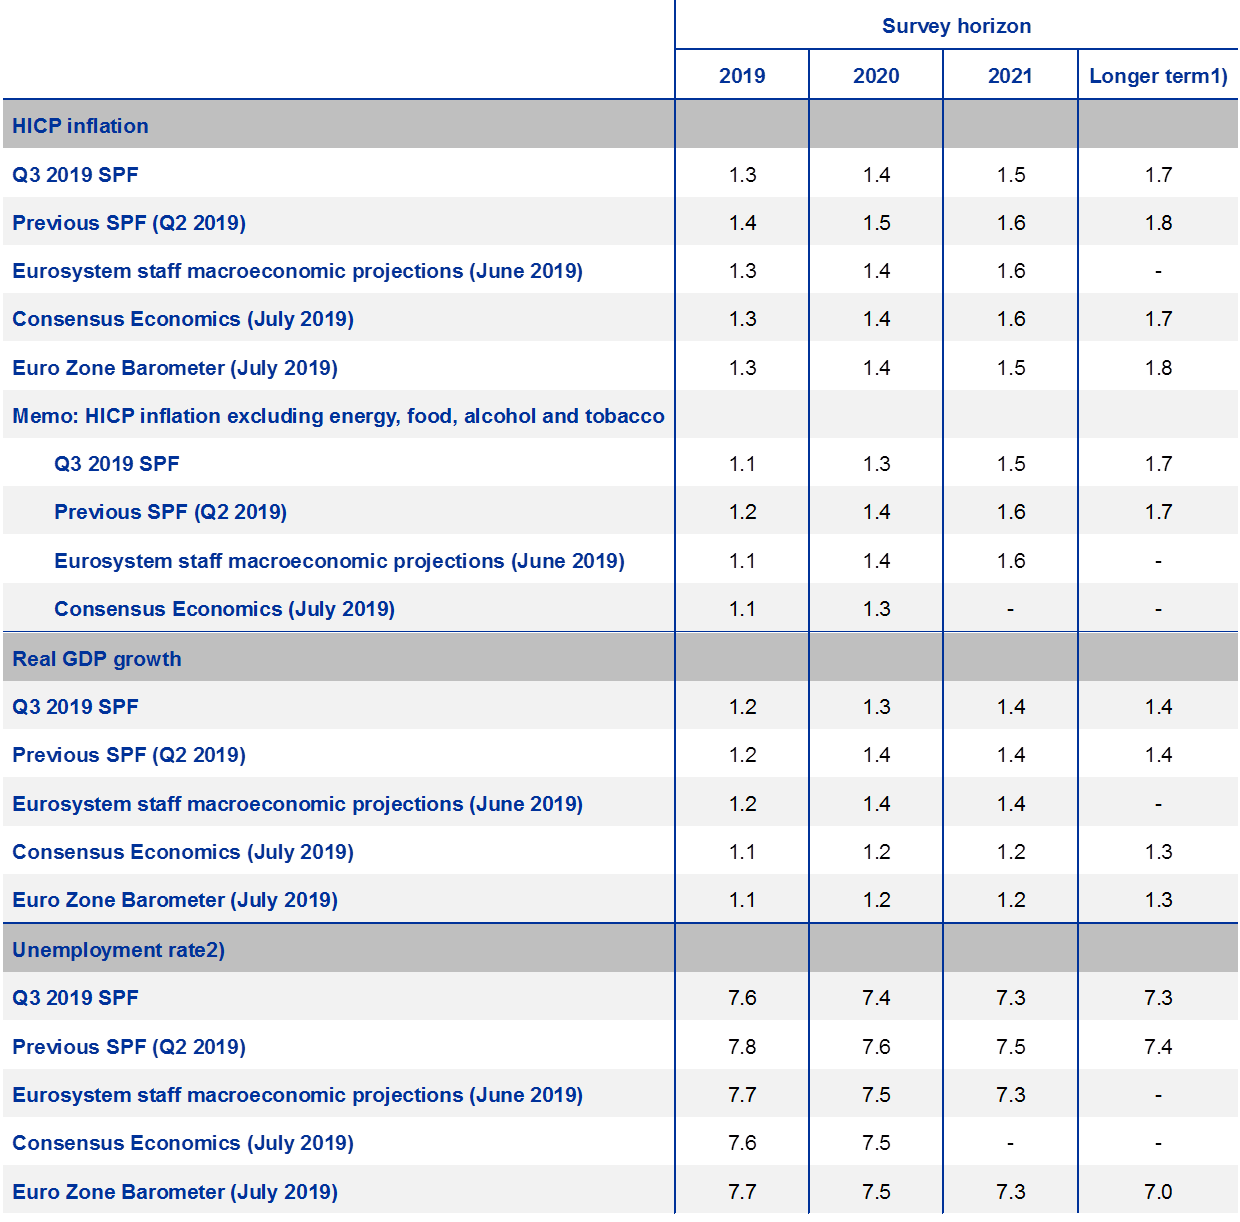
1) Longer-term expectations refer to 2024 in the Q3 2019 SPF and Consensus Economics and to 2023 in the Q2 2019 SPF and Eurozone Barometer.
2) As a percentage of the labour force.
1 Inflation expectations revised down for the period 2019-2021
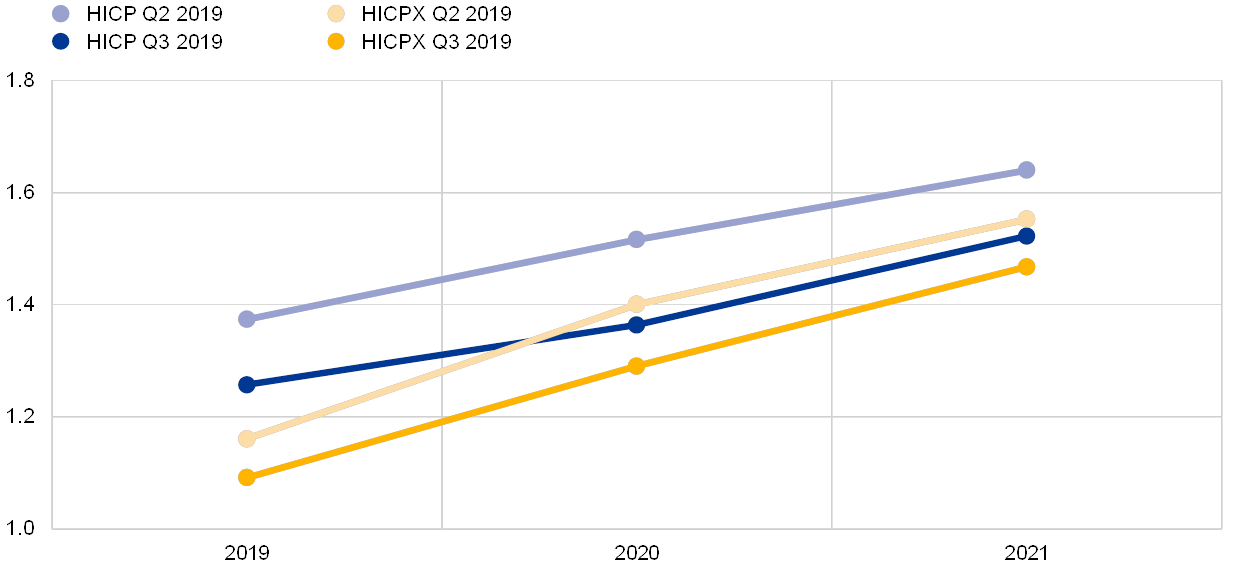
HICP inflation expectations for 2019, 2020 and 2021 were again revised down to stand at 1.3%, 1.4% and 1.5%, respectively (see Chart 1). These results represent downward revisions of 0.1 percentage points (p.p.) for each year surveyed, following downward revisions of 0.1 p.p. across horizons between the surveys conducted for the first and second quarters of 2019. In respondents’ qualitative comments, the revisions were predominantly attributed, in the short-term, to downward surprises in the inflation data since the previous survey and were considered to be a consequence of the downward revisions to real economic growth in 2020 and 2021. This profile of expected inflation is comparable with the expectations published in other surveys (see Table 1).
Average expectations for inflation excluding energy, food, alcohol and tobacco (HICPX) stood at 1.1%, 1.3% and 1.5%, respectively. This represents downward revisions of 0.1 p.p. for each of 2019, 2020 and 2021 (see Chart 1).
Chart 1
Inflation expectations: overall HICP and HICP excluding energy, food, alcohol and tobacco
(annual percentage changes)
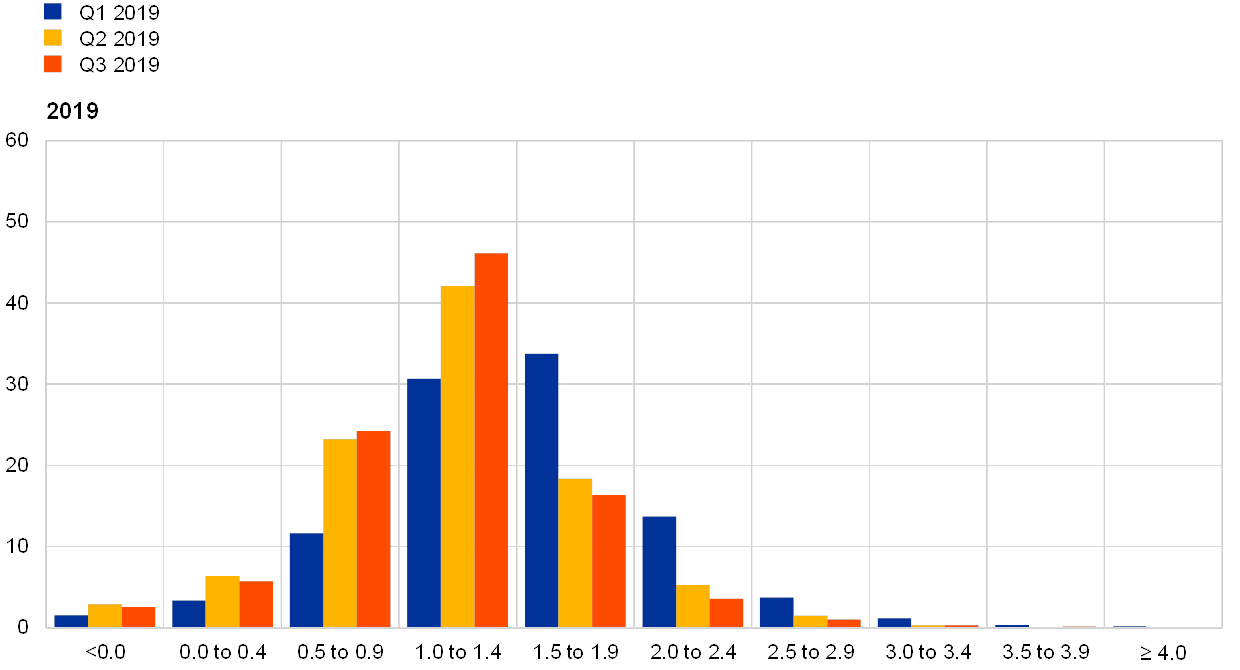
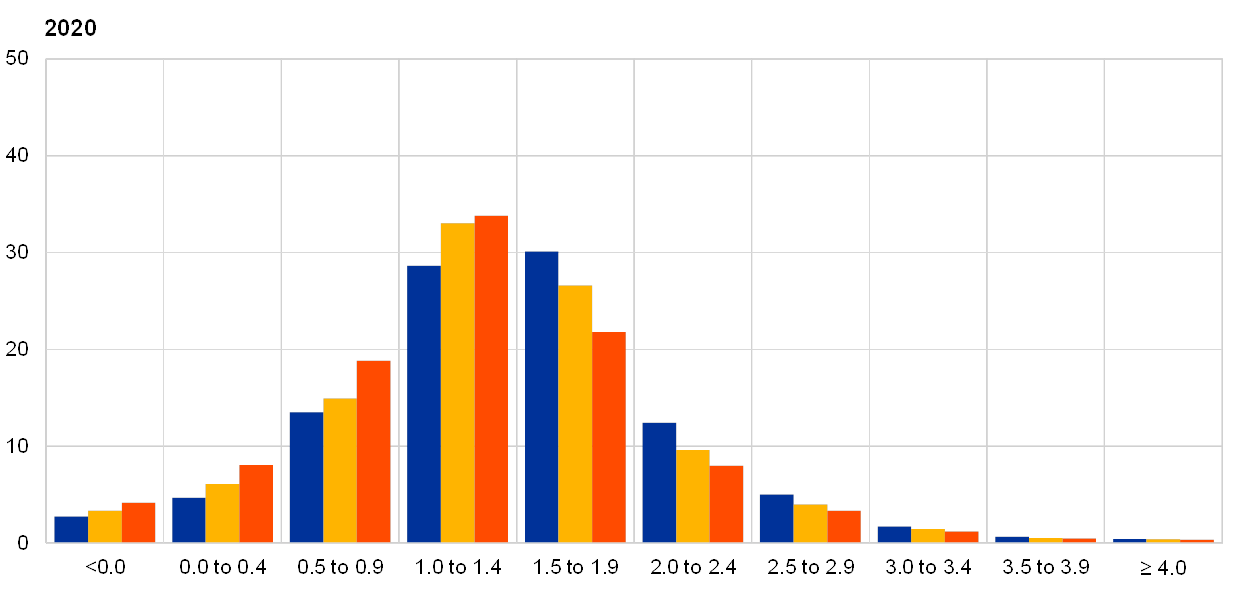
The reported probability distributions continued to indicate relatively elevated uncertainty around expected inflation in two years’ time, while the balance of risks remains to the downside. The width of the forward-looking probability distributions indicates the perceived degree of overall uncertainty, whereas the asymmetry of the distributions indicates whether that uncertainty is more concentrated on higher or lower outturns, i.e. it measures the perceived balance of risks. The aggregate probability distributions shifted further to the left, mirroring the reductions in the point forecasts (see Chart 2). In general, forecasters’ probability distributions remained wide by historical standards, suggesting that uncertainty about future inflation outcomes at this horizon remained elevated and the balance of risks remained skewed towards the downside. In their qualitative comments, respondents cited both the risk that the euro area economy will grow more slowly than expected and the risk that the external environment will prove more disinflationary than at present in their baseline forecasts as risks to the downside.
Chart 2
Aggregate expected probability distributions for inflation in 2019, 2020 and 2021
(x-axis: HICP inflation expectations, annual percentage changes; y-axis: probability, percentages)
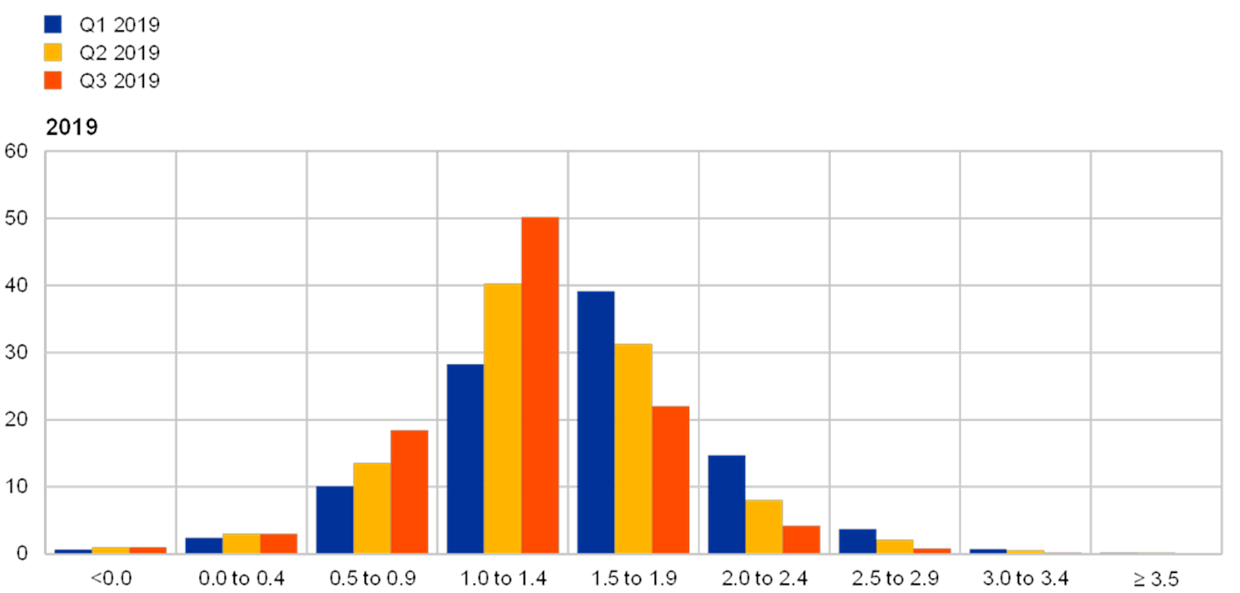
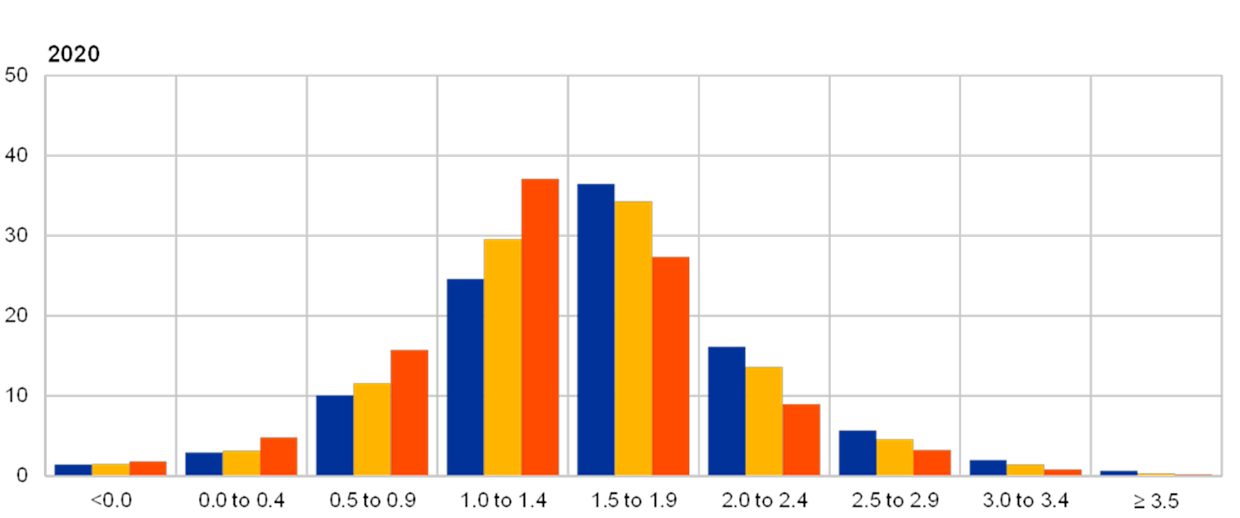

Note: The SPF asks respondents to report their point forecasts and to separately assign probabilities to different ranges of outcomes. This chart shows the average probabilities they assigned to inflation outcomes in 2019, 2020 and 2021.
2 Longer-term inflation expectations declined to 1.7%
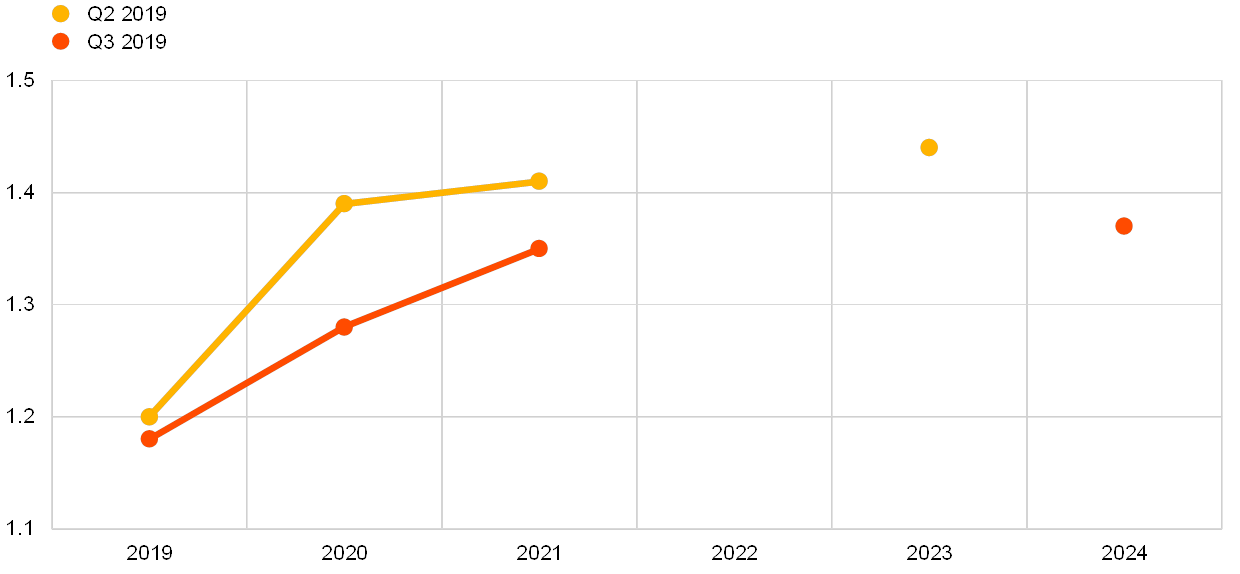
The mean point forecast for inflation in the longer term (2024) declined from 1.8% to 1.7%. Other summary statistics also decreased by 0.1 p.p. such that the median point forecast and the mean of the aggregate probability distribution stood at 1.7% and 1.6%, respectively (see Chart 3). Compared with the previous survey, a similar proportion (around 38%) of respondents reported a longer-term point forecast of 1.8% or 1.9%, while the proportion reporting a point forecast of 1.7% or less increased from 40% to 50% and the proportion reporting a point forecast of 2.0% or higher fell correspondingly (see Chart 4). Overall, the latest cross section of individual point forecasts is narrower than in recent surveys (driven in part by larger downward revisions from the small number of forecasters who had previously expected inflation in the longer term to be above 2.2%), indicating less disagreement. Longer-term expectations for HICP inflation excluding energy, food, alcohol and tobacco were unchanged, at 1.7%.
Chart 3
Longer-term inflation expectations
(annual percentage changes)
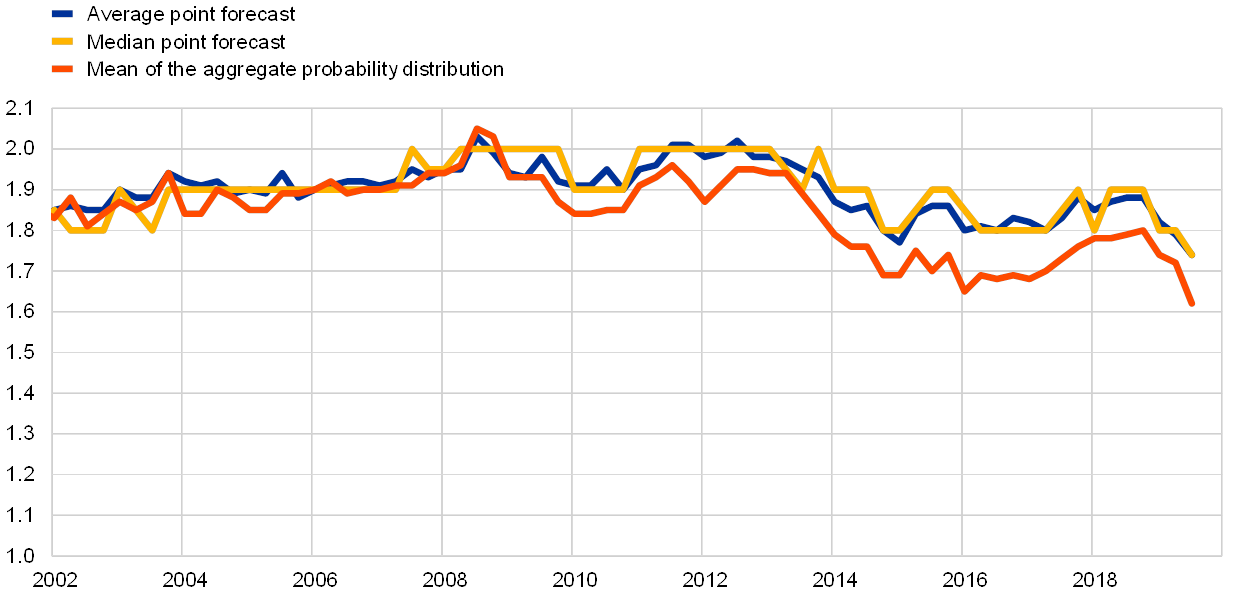
Chart 4
Distribution of point expectations for HICP inflation in the longer term
(x-axis: HICP longer-term inflation expectations, annual percentage changes; y-axis: percentages of respondents)

Notes: The SPF asks respondents to report their point forecasts and to separately assign probabilities to different ranges of outcomes. This chart shows the spread of point forecast responses.
As with shorter-term inflation expectations, perceptions of overall uncertainty remained high, with the balance of risks remaining to the downside. The width of forecasters’ probability distributions for inflation in the longer term remained high, indicating elevated uncertainty. Just as for shorter-term inflation expectations, the balance of risks remained to the downside (see Chart 5), but to a lesser extent than seen over the period 2016-17.
Chart 5
Aggregate probability distribution of longer-term inflation expectations
(x-axis: HICP inflation expectations, annual percentage changes; y-axis: probability, percentages)

Notes: The SPF asks respondents to report their point forecasts and to separately assign probabilities to different ranges of outcomes. This chart shows the average probabilities they assigned to inflation outcomes in the longer term.
3 Real GDP growth expectations broadly unchanged
Expectations for real GDP growth stood at 1.2% for 2019 and 1.3% for both 2020 and 2021 (see Chart 6). That implies downward revisions of 0.1 p.p. for 2020, while forecasts for 2019 and 2021 remained unrevised. Longer-term growth expectations (which refer to 2024) remained stable at 1.4%. While, on average, forecasts for 2019 remained unchanged, around 30% of forecasters made upward revisions and a similar share downwards revisions. Those revising up cited as the main reasons the better-than-expected GDP growth in the first quarter and the anticipation that the US and China will re-start trade talks, while those revising down mentioned the continuous weakness of business sentiment indicators, foreign trade and manufacturing activity. A more pessimistic view on Brexit was another factor behind some forecasters’ downward revisions. The latest SPF results for 2019 and 2021 are slightly more optimistic than those published in other surveys, but broadly in line for 2020 (see Table 1).
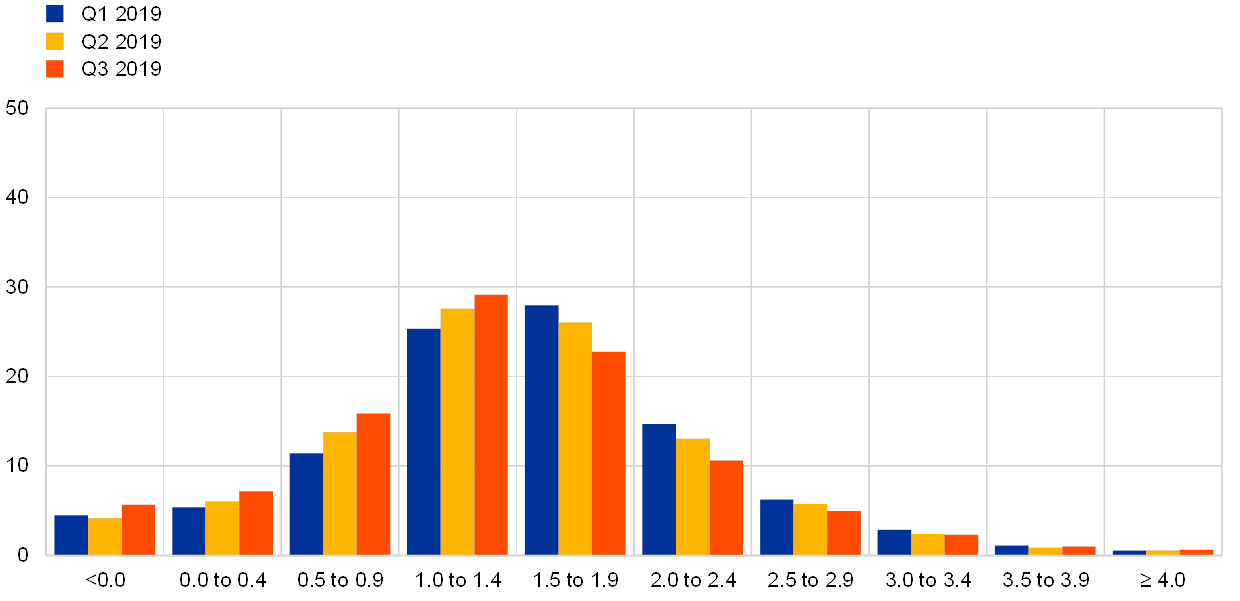
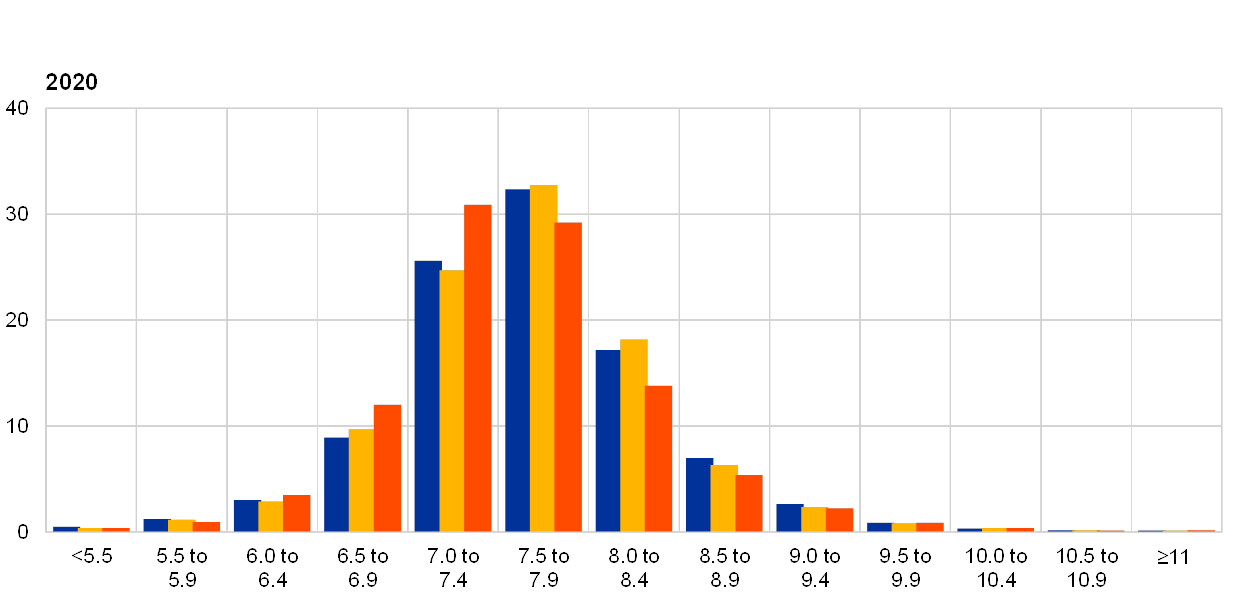
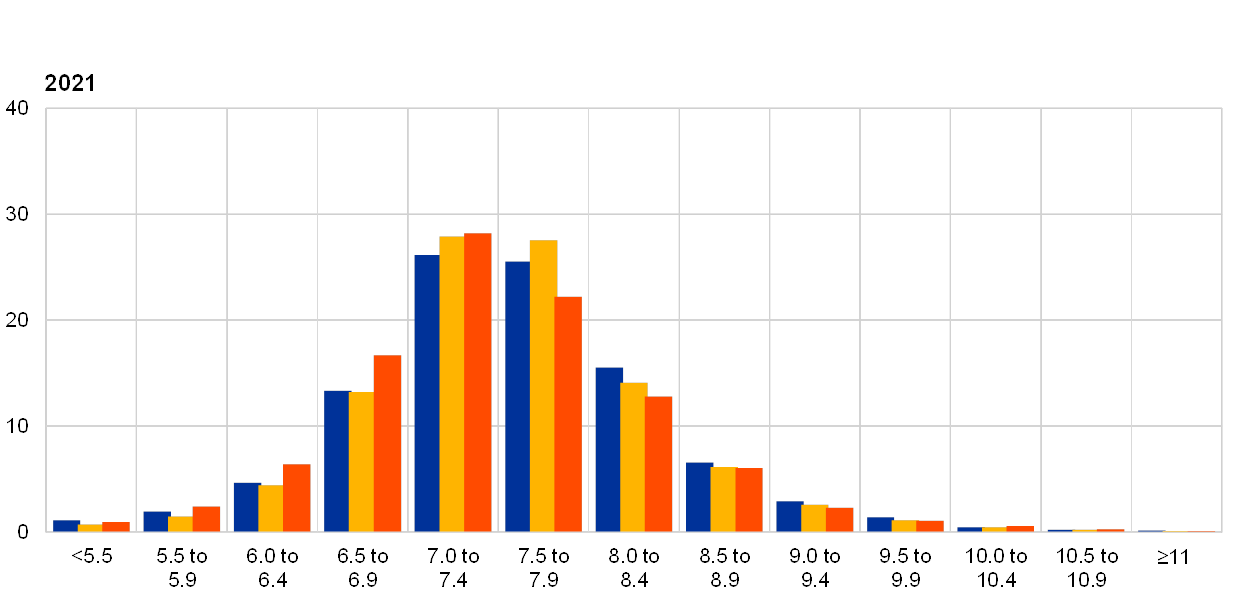
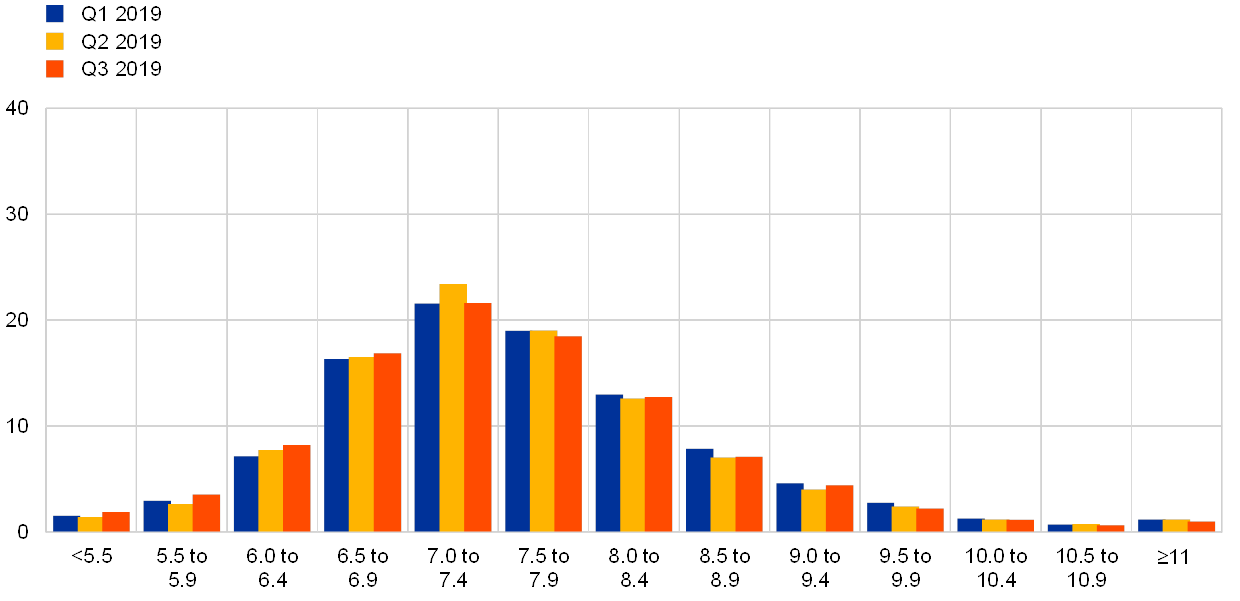
The probability assigned to real GDP growth of over 1.5% declined at all horizons. At all horizons, respondents continued to assign the highest likelihood to outcomes between 1.0% and 1.4%. The distribution for 2019 became more concentrated around this central range, while for 2021 and the longer term the distributions become more skewed to the downside. The probability assigned to GDP growth in 2019 of above 1.5% declined further from 26% to 21% and similar changes were seen in the probability distributions for the other horizons, with the probabilities assigned to growth outcomes above 1.5% reduced to 35% from 43% for 2020, to 42% from 47% for 2021 and to 42% from 49% for the longer term (see Chart 7 and Chart 8).
Chart 6
Expectations for real GDP growth
(annual percentage changes)
The balance of risks to real GDP growth forecasts remained to the downside. Both quantitative measures of the balance of risks and forecasters’ qualitative comments were similar to those from the previous survey round and pointed to downside risks on balance. Those specifically cited again included a further escalation of the trade conflict between the United States and China, the potential impact of a hard Brexit, and the apparent slowdown in China turning out stronger than expected, spilling over to other emerging economies. As in other recent survey rounds, very few forecasters mentioned upside risks. On the domestic side, some respondents considered the outlook for economic policy in some countries to have become more uncertain, while others saw a risk that the current weakness in the European manufacturing sector might spill over to domestic demand.
Chart 7
Aggregate probability distributions for GDP growth expectations for 2019, 2020 and 2021
(x-axis: real GDP growth expectations, annual percentage changes; y-axis: probability, percentages)
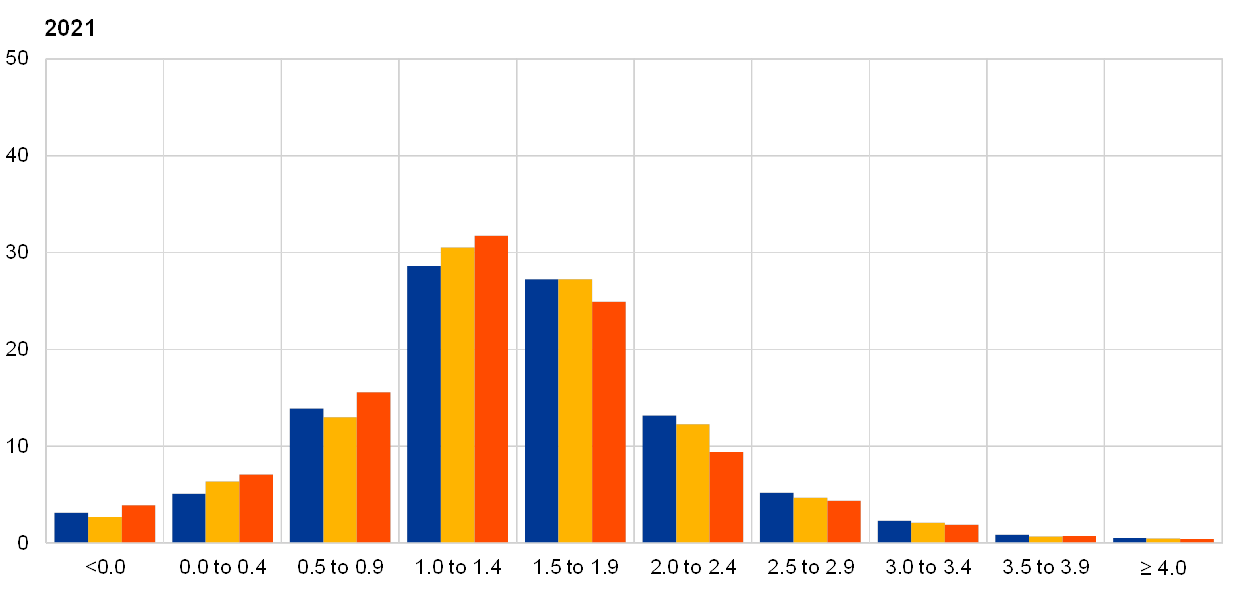
Notes: The SPF asks respondents to report their point forecasts and to separately assign probabilities to different ranges of outcomes. This chart shows the average probabilities they assigned to real GDP growth outcomes in 2019, 2020 and 2021.
Chart 8
Aggregate probability distribution for longer-term GDP growth expectations
(x-axis: real GDP growth expectations, annual percentage changes; y-axis: probability, percentages)
Note: The SPF asks respondents to report their point forecasts and to separately assign probabilities to different ranges of outcomes. This chart shows the average probabilities they assigned to real GDP growth outcomes in the longer term.
4 Unemployment rate expectations revised down
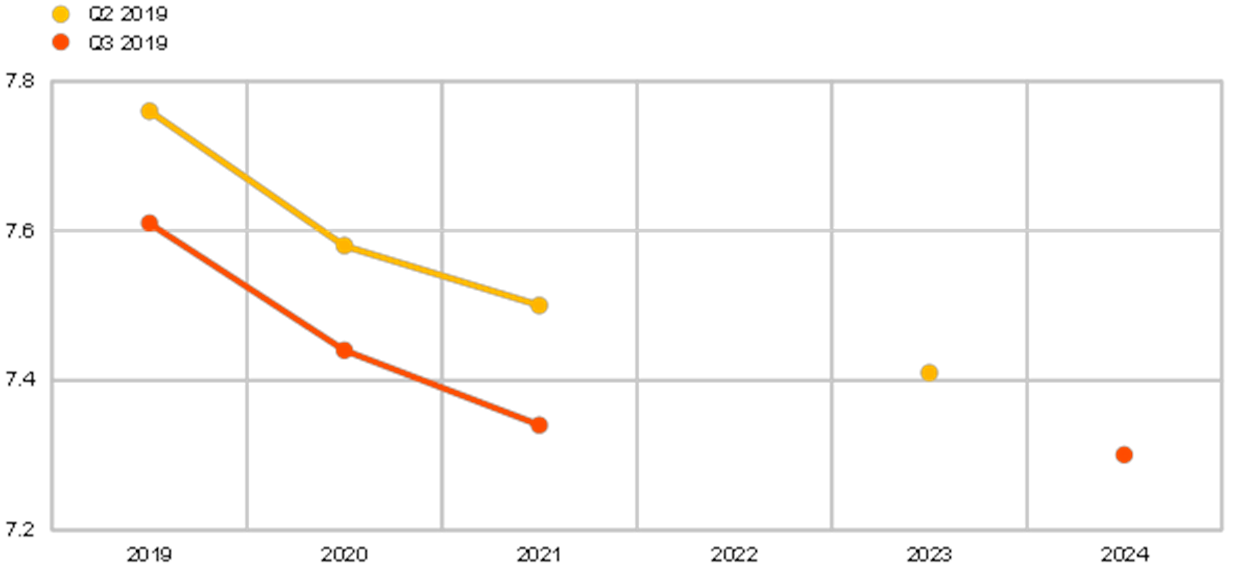
The average point forecasts for the unemployment rate for 2019, 2020 and 2021 were all revised down by 0.2 p.p. to stand at 7.6%, 7.4% and 7.3%, respectively (see Chart 9). This largely reflects developments in the data: the earlier-than-usual timing of the previous survey meant that when it was fielded, the latest unemployment rate data were for January 2019 (7.8%) whereas for this survey, the May data (7.5%) were already available. Forecasters noted that the labour market appears to have remained resilient despite the prospect of slowing growth. Longer-term unemployment rate expectations were also revised down, from 7.4% to 7.3%.
Chart 9
Expectations for the unemployment rate
(percentages of the labour force)
The balance of risks remained to the upside, and longer-term unemployment rate expectations remained very uncertain. At all horizons, the probability distributions remained skewed towards higher unemployment rate outcomes, indicating that the balance of risks is to the upside (see Chart 10 and Chart 11). As with other variables (across horizons), forecasters’ uncertainty about the unemployment rate in the future, as measured by the width of their probability distributions, has been greater since the financial crisis than it was before and in this survey round increased a little further at all horizons. At the longer-term horizon this measure is at a series high and stands materially above the levels recorded during 2018.
Chart 10
Aggregate probability distributions for the unemployment rate in 2019, 2020 and 2021
(x-axis: unemployment rate expectations, percentages of the labour force; y-axis: probability, percentages)
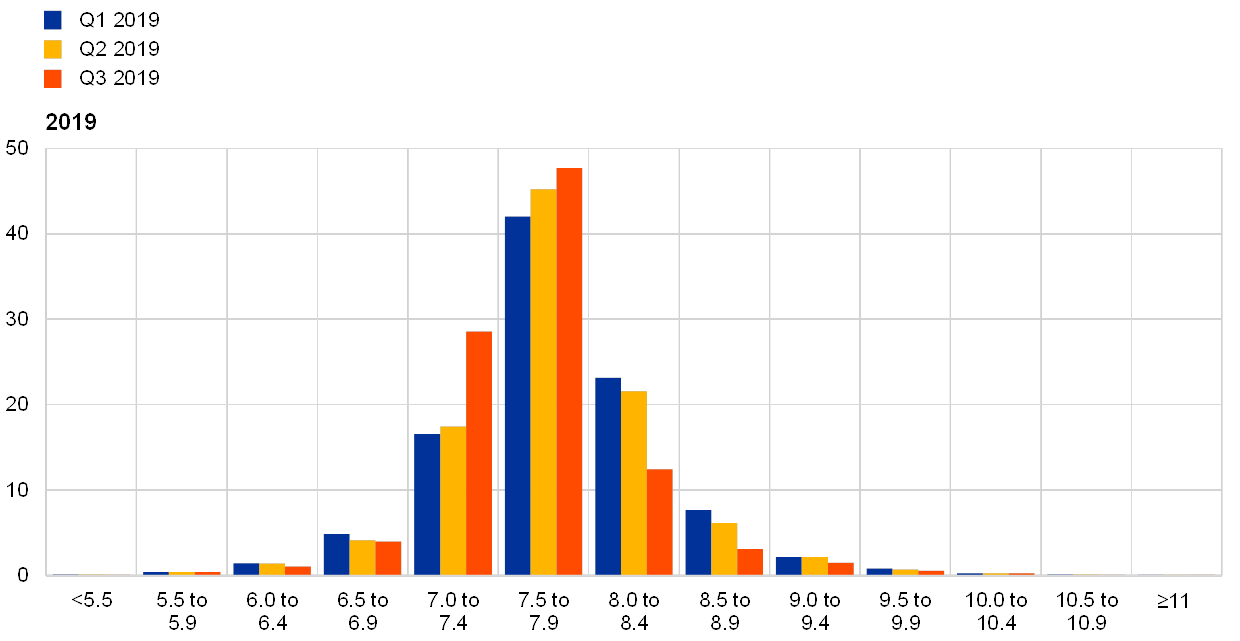
Notes: The SPF asks respondents to report their point forecasts and to separately assign probabilities to different ranges of outcomes. This chart shows the average probabilities they assigned to unemployment rate outcomes for 2019, 2020 and 2021.
Chart 11
Aggregate probability distribution for the unemployment rate in the longer term
(x-axis: unemployment rate expectations, percentages of the labour force; y-axis: probability, percentages)
Notes: The SPF asks respondents to report their point forecasts and to separately assign probabilities to different ranges of outcomes. This chart shows the average probabilities they assigned to unemployment rate outcomes in the longer term.
5 Expectations for other variables
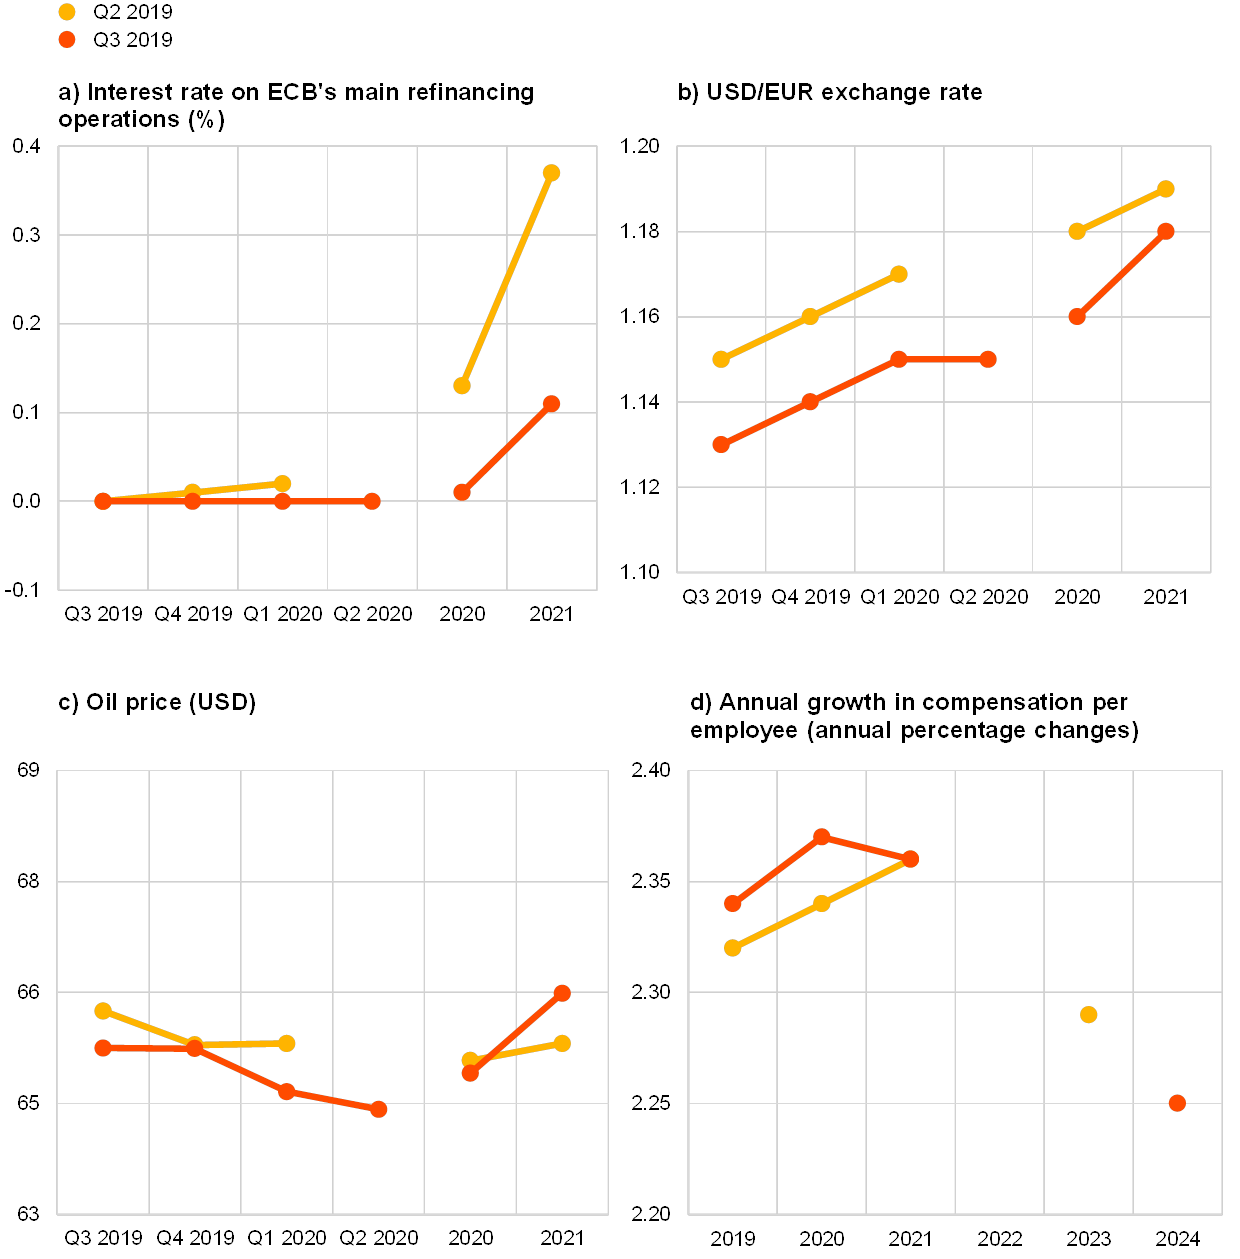
Respondents’ average expectations were for: the ECB’s main refinancing rate to start increasing only in 2021; the euro to continue appreciating against the US dollar until 2021; USD oil prices to remain broadly unchanged; and labour cost growth to remain stable until 2021 and then start to slow.
The mean expectation for the rate on the ECB’s main refinancing operations was for it to remain around 0% in the near term, increasing a little to 0.11% in 2021 (see panel (a) of Chart 12). Both the aggregate expectation for the near-term, quarterly profile and the expected policy rate in 2020 and 2021 were revised down from the previous round.
The average expected USD/EUR exchange rate decreased at all horizons compared to the previous round, but more so in the nearer term. Thus, relative to that lower starting point, the expected pace of future appreciation of the euro has increased (see panel (b) in Chart 12).
US dollar-denominated oil prices (per barrel) were expected to average USD 65.3 for 2019, USD 64.9 for 2020 and USD 66 for 2021, thus remaining stable across all horizons (in contrast to the downward sloping oil futures curve). This implies that forecasters now expect prices to be between 0.1% and 1.0% lower at all horizons except the longer term than they had expected in the previous survey (see panel (c) of Chart 12). When combined with expectations of a slight weakening – between 1.3% and 1.5% – in the USD/EUR exchange rate, these results imply a profile for the oil price in euro that is around 1.2% higher than in the previous survey.
On average, annual growth in compensation per employee was expected to be 2.3% for 2019, 2.4% for 2020 and 2021 and 2.3% for 2024, nearly unchanged at all horizons when compared with the previous survey (see panel (d) of Chart 12).
Chart 12
Expectations for other variables
6 Annex (chart data)
Excel data for all charts can be downloaded here.
© European Central Bank, 2019
Postal address 60640 Frankfurt am Main, Germany
Telephone +49 69 1344 0
Website www.ecb.europa.eu
All rights reserved. Reproduction for educational and non-commercial purposes is permitted provided that the source is acknowledged.
For specific terminology please refer to the ECB glossary (available in English only).
PDF ISSN 2363-3670, QB-BR-19-003-EN-N
HTML ISSN 2363-3670, QB-BR-19-003-EN-Q
- The survey was conducted between 1 and 5 July 2019; 52 responses were received. Participants were provided with a common set of the latest available data for annual HICP inflation (June 2019: all items, 1.2%; excluding energy, food, alcohol and tobacco 1.1%), annual GDP growth (Q1 2019, 1.2%) and the unemployment rate (May 2019, 7.5%).
-
26 July 2019