
Foreword

This 19th annual review of the international role of the euro published by the ECB presents an overview of developments in the use of the euro by non-euro area residents.
This report covers developments in 2019. This period was characterised by persistent international trade and geopolitical tensions, weak global economic activity, rising debt issuance by corporate and emerging market borrowers in global capital markets and a shift towards increased monetary policy accommodation in major economies. On balance, these developments resulted in a stabilisation in the international role of the euro. On the one hand, the euro’s share in outstanding international loans increased significantly. On the other hand, the share of the euro in outstanding international debt securities declined, albeit international debt issuance in euro continued to increase in volume. The share of the euro in global foreign exchange reserves and in outstanding international deposits remained broadly stable, as did the share of the euro as an invoicing currency for extra-euro area transactions in goods and the stock of euro banknotes circulating outside the euro area.
An interesting development, highlighted in Box 1 of this report, relates to the significant role of the euro in global green bond markets, with the euro being the main currency of denomination for the issuance of green bonds in 2019.
The international role of the euro is primarily supported by a deeper and more complete EMU, including advancing the capital markets union, in the context of the pursuit of sound economic policies in the euro area. The Eurosystem supports these policies and emphasises the need for further efforts to complete EMU. The recent COVID‑19 pandemic underlines the urgency of these policies and reform efforts, which are paramount to raising the attractiveness of the euro globally. The ECB has taken immediate and exceptional measures in response to the pandemic to address possible market dysfunction and euro liquidity needs in the euro area and globally, so as to mitigate risks to the smooth transmission of its monetary policy in line with its mandate. In doing so, these measures should in turn also serve to safeguard the attractiveness of the euro globally.
The ECB will continue to monitor developments in and publish information on the international role of the euro on a regular basis.
Christine LagardePresident
1 Main findings
The international role of the euro remained stable in 2019. This period was characterised by persistent international trade and geopolitical tensions, weak global economic activity, continuously rising debt build-up by corporate and emerging market borrowers in global capital markets and a notable shift towards increased monetary policy accommodation in major economies.
On balance, adjusting for exchange rate valuation effects, a composite index of the euro’s international role remained essentially flat in the review period at a low level (see Chart 1). The share of the euro across various indicators of international currency use averaged around 19% – close to historical lows. The euro remained unchallenged as the second most important currency in the international monetary system (see Chart 2).
The international role of the euro remained stable at a historically low level in the review period
Composite index of the international role of the euro
(percentages; at current and Q4 2019 exchange rates; four-quarter moving averages)
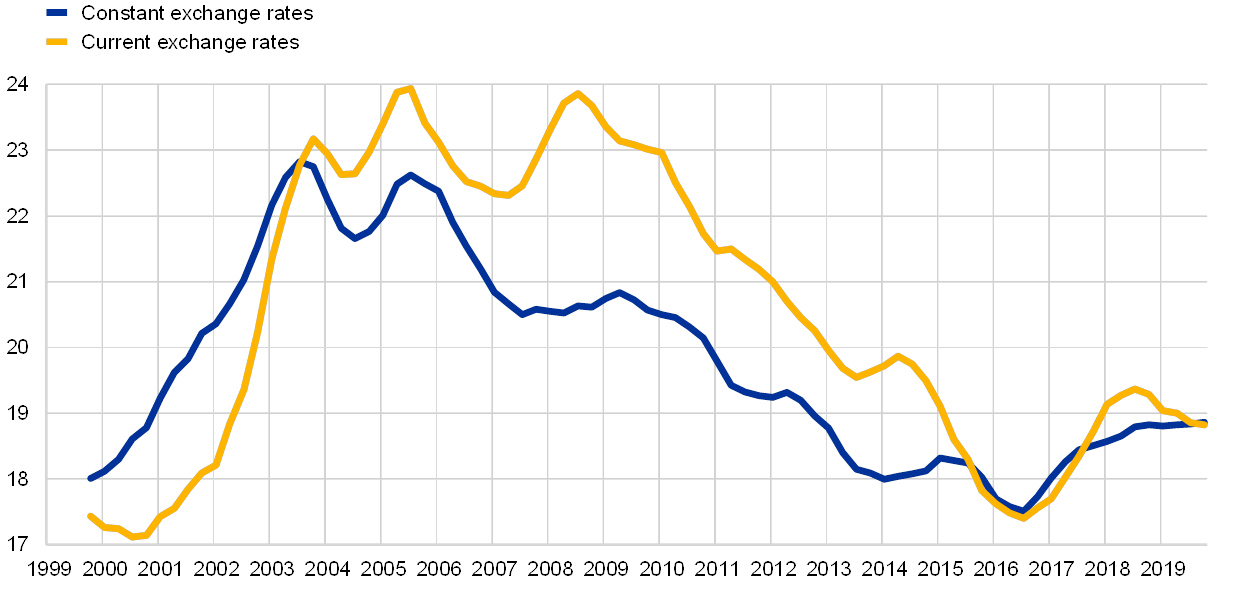
Sources: BIS, IMF, Ilzetzki, Reinhart and Rogoff (2019) and ECB calculations.Notes: Arithmetic average of the shares of the euro at constant (current) exchange rates in stocks of international bonds, loans by banks outside the euro area to borrowers outside the euro area, deposits with banks outside the euro area from creditors outside the euro area, global foreign exchange turnover, global foreign exchange reserves and the share of the euro in global exchange rate regimes. Data at constant exchange rates are not available for global foreign exchange turnover. The estimates for the share of the euro in global exchange rate regimes between 2016 and 2019 were obtained by ECB staff using the same methodology as Ilzetzki, E., Reinhart, C. and Rogoff, K. (2019), “Exchange arrangements entering the 21st Century: which anchor will hold?”, Quarterly Journal of Economics 134 (2), pp. 599‑646. The latest observations are for the fourth quarter of 2019.
The euro remains the second most important currency in the international monetary system
Snapshot of the international monetary system
(percentages)

Sources: BIS, IMF, SWIFT and ECB calculations.Note: The latest data are for the fourth quarter of 2019.
Following a significant rise in 2018, the share of the euro in global foreign exchange reserves remained broadly stable in the review period, increasing modestly by 0.2 percentage point (see Table 1). Large official reserve holders were among the main purchasers of euro-denominated assets. Anecdotal evidence suggests that purchases of reserve assets could reflect various motives, including exchange rate management and currency diversification decisions. The share of the US dollar, the leading global reserve currency, declined further to a two-decade low, suggesting that the trend towards gradual diversification of global reserve portfolios continued. Accumulation of gold by official reserve holders grew unabated, which indicates that central banks are exploring alternatives to the traditional major currencies.
The euro remained the second most actively traded currency in foreign exchange markets. Evidence from the latest triennial survey of global foreign exchange activity conducted by the Bank for International Settlements suggests that the share of the euro in global foreign exchange turnover increased by around 1 percentage point between 2016 – the year when the previous survey was conducted – and 2019. A large share of transactions involving the euro was initiated in the City of London. Almost 50% of global foreign exchange turnover in the euro was undertaken in the United Kingdom, against approximately 13% in the euro area.
Other indicators suggest that developments in the global attractiveness of the euro were mixed in the review period.
- On the one hand, issuance of international bonds denominated in euro rose, with the share of the euro increasing by more than 1 percentage point. Low interest rates in the euro area continued to support the use of the euro as a funding currency – even after adjusting for the cost of swapping euro proceeds into other currencies, such as the US dollar. This encouraged issuance by US borrowers and international borrowers from a broad range of economic sectors, such as manufacturing, construction and financial institutions. On the other hand, the share of the euro in the outstanding stock outstanding of international debt securities, which tends to adjust more gradually, and depends additionally on net redemptions and developments in money market instruments, declined by 0.3 percentage points.
- The share of the euro in international loans by banks outside the euro area to non-euro area borrowers also increased in 2019, by a full percentage point. Volumes of euro-denominated loans by banks outside the euro area to non-euro area borrowers were twice as large as in the aftermath of the global financial crisis in 2009. Volumes of all outstanding cross-border loans denominated in euro were around 3% higher compared to 2018, suggesting that deleveraging by euro area banks, which had been a feature of developments in the years after the global financial crisis, no longer acted as a drag on the use of the euro in international loan markets.
- The share of the euro as an invoicing currency for extra-euro area transactions in goods remained broadly unchanged relative to last year, while its share in transactions in services declined.
- The share of the euro in outstanding international deposits remained broadly stable.
- The stock of euro banknotes circulating outside the euro area was also broadly stable in 2019.
Recent research suggests that increasing the depth and liquidity of euro area financial markets, and strengthening the credit quality and liquidity of euro area debt, would support the international role of the euro.[1] At the Euro Summit on 13 December 2019, euro area leaders stressed that the international role of the euro “should be commensurate with the global economic and financial weight of the (European) Union”. Last year’s report noted tentative signs of recovery in the global appeal of the euro after years of decline. The stabilisation of the international role of the euro described in this report suggests that the policy implications stressed by the Eurosystem in the past remain fully valid. The international role of the euro is primarily supported by a deeper and more complete EMU, including advancing the capital markets union, in the context of the pursuit of sound economic policies in the euro area. The Eurosystem supports these policies and emphasises the need for further efforts to complete EMU.
This year’s report contains a box on the role of the euro in global green bond markets.
The international role of the euro from different perspectives
Summary of data in this report

Sources: BIS, CLS Bank International, Dealogic, IMF, national sources and ECB calculations.Notes: Outstanding amounts refer to outstanding amounts of foreign currency total amounts. An increase in the euro nominal effective exchange rate indicates an appreciation of the euro.
2 Key developments
2.1 Use of the euro as an international reserve
The share of the euro in global official holdings of foreign exchange reserves remained broadly stable in 2019. At constant exchange rates, the share of the euro in globally disclosed holdings of foreign exchange reserves rose modestly, by 0.2 percentage point between the end of 2018 and the end of 2019 – the second consecutive year of increase (see Chart 3).[2] The US dollar remained the leading global reserve currency in the review period, although its share in globally disclosed reserves declined by almost a full percentage point, to 60.9%, a two-decade low when measured at constant exchange rates.
The share of the euro in global foreign exchange reserves remained broadly stable in 2019
Developments in the shares of the euro, US dollar and other currencies in global official holdings of foreign exchange reserves
(percentages; at constant Q4 2019 exchange rates)

Sources: IMF and ECB calculations.Note: The latest observation is for the fourth quarter of 2019.
The trend towards gradual diversification of global reserve portfolios also continued. At constant exchange rates, the share of currencies other than the euro and the US dollar increased by 0.7 percentage point in the review period (see Chart 4). The increase primarily reflected purchases of official reserve assets denominated in Japanese yen, often considered a safe haven currency, the share of which rose by 0.4 percentage point to nearly a two-decade high.[3] The share of the Chinese renminbi increased modestly, by less than 0.1 percentage point, in line with the observation that growth in the unit’s international role has decelerated since its inclusion in the special drawing rights basket in 2016. The share of other non-traditional reserve currencies was stable.
Diversification of global reserve portfolios towards currencies other than the euro and the US dollar was largely confined to the Japanese yen
Developments in the shares of selected currencies in global official holdings of foreign exchange reserves
(percentages; at constant Q4 2019 exchange rates)

Sources: IMF and ECB calculations.Note: The latest observation is for the fourth quarter of 2019.
Large official reserve holders were among the main purchasers of euro-denominated assets. Motives underlying the purchases in question varied across central banks, including exchange rate management, currency diversification decisions and, in some cases, perhaps geopolitical considerations. For instance, press reports suggest that the Swiss National Bank (SNB) had been active in the foreign exchange market in order to manage the Swiss franc exchange rate as economic uncertainty raised by international trade tensions presumably led to safe haven capital inflows.[4] In line with this interpretation, holdings of euro-denominated foreign exchange reserves by the SNB increased by over EUR 20 billion in 2019. Moreover, the value of euro-denominated assets held as reserves by the Central Bank of Russia also increased by over USD 20 billion.[5] Russia had been among the main sellers of US Treasury securities between March and December 2018 in an attempt to rebalance the currency composition of its official reserves (see Chart 5). Together China and Russia sold a combined USD 204 billion worth of US Treasury debt securities amid concerns about unilateral sanctions and international trade tensions in 2018. China continued to sell US Treasury securities in 2019, to the tune of USD 54 billion. By contrast, Russia’s sales were limited in 2019, at just over USD 3 billion, having already disposed of the majority of its holdings.[6] These developments notwithstanding, US Treasury securities remained attractive safe assets globally. Several countries increased their exposures to US Treasury securities in 2019, such as Japan and some euro area countries.
China and Russia have reduced their exposures to US Treasury securities since 2018
Sales of US Treasury securities by selected countries
(net amounts in USD billions)
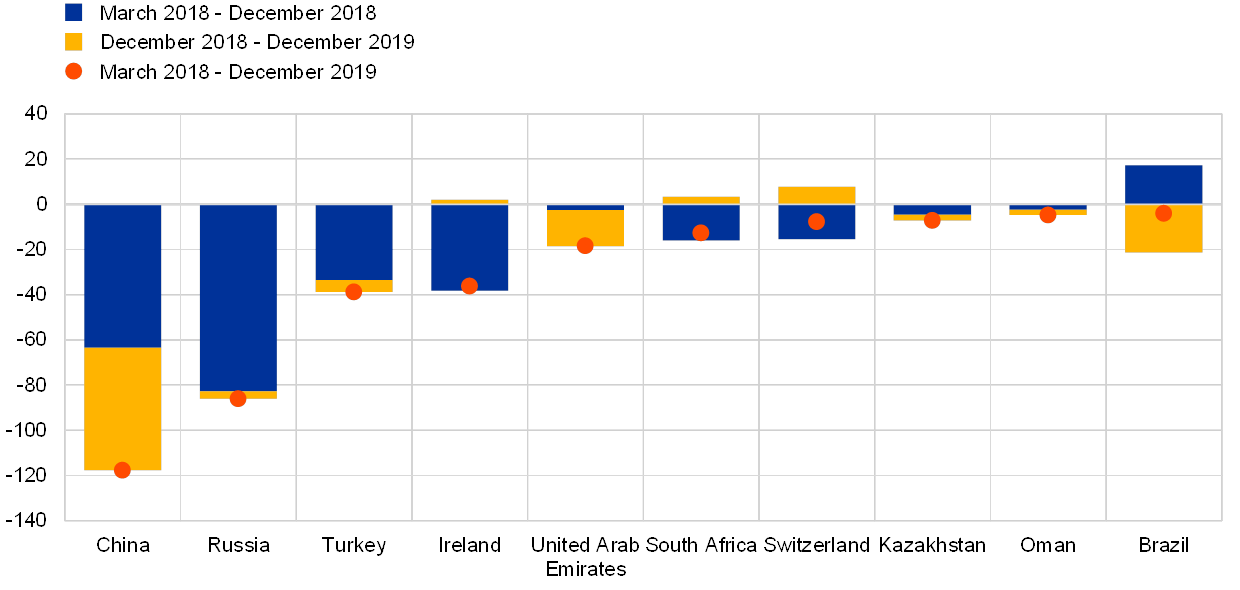
Sources: US Department of Treasury, Treasury International Capital (TIC) System and ECB calculations.
Accumulation of gold by official reserve holders continued unabated over the review period, suggesting that central banks globally are exploring alternatives to the major currencies. In value terms, official holdings of gold increased by over USD 280 billion over the review period, compared to an increase of USD 390 billion in foreign exchange holdings (see Chart 6). The share of gold in total global reserve holdings increased markedly, to 12% – a six-year peak.
Accumulation of gold by official reserve holders continued unabated
Changes in global official reserve holdings of gold and foreign currency
(amounts in USD billions)

Source: World Gold Council.Note: The latest observation is for the fourth quarter of 2019.
Since gold prices increased by close to 18% last year, the increase in gold holdings partly reflects valuation effects. However, official reserve managers also increased their real physical holdings of gold in vaults and storage facilities by over 500 tonnes in 2019 – in line with a trend that started a decade ago with the global financial crisis (see Chart 7). Strong interest in gold from central banks reflects multiple factors, such as the appeal of gold in anchoring public confidence in their balance sheets, the diversification benefits it offers relative to other assets and the decline in the opportunity cost of holding gold in a low or even negative interest rate environment.[7] Global geopolitical developments might have been an additional supportive factor. In line with this, it is notable that the countries that reduced their exposures to US dollar assets amid concerns about unilateral sanctions and international trade tensions, such as Russia and China, were also some of the largest official reserve purchasers of gold.
Holdings of physical gold by official reserve managers continued to trend upwards
Developments in global official holdings of gold
(in metric tonnes)
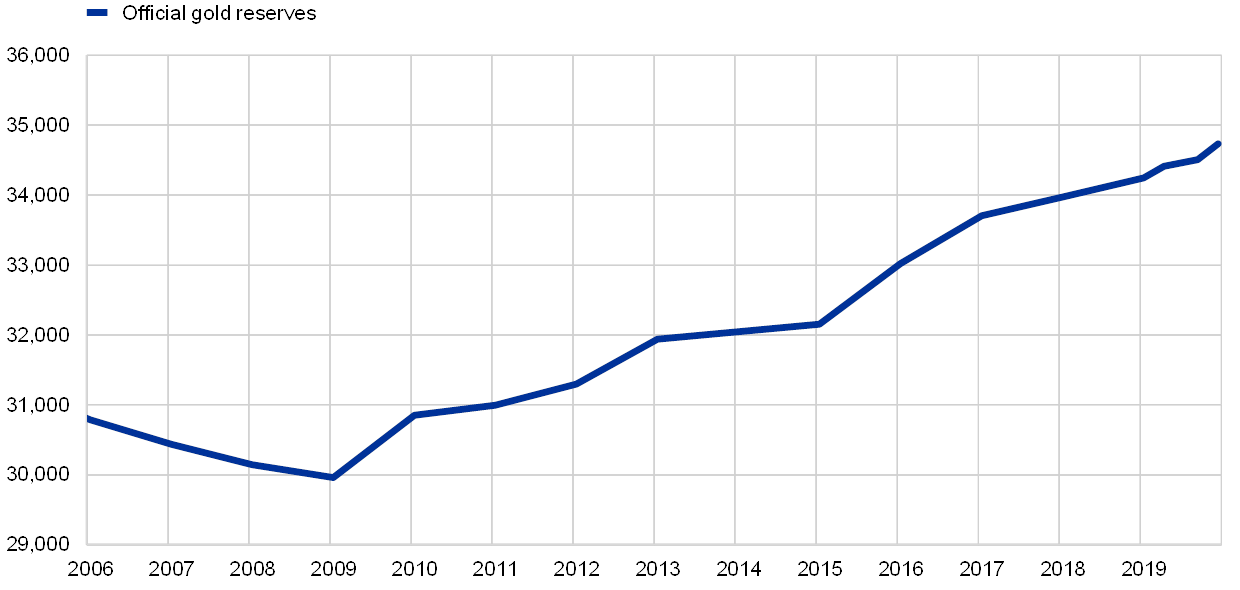
Source: World Gold Council.Note: The latest observation is for the fourth quarter of 2019.
2.2 The euro in global foreign exchange markets
The share of the euro in global foreign exchange trading increased somewhat in 2019. The BIS Triennial Central Bank Survey of Foreign Exchange and OTC Derivatives Markets in 2019 released by the Bank for International Settlements (BIS) indicates that trading in foreign exchange markets totalled USD 6.6 trillion per day in April 2019, up from USD 5.1 trillion in April 2016. More than half of the rise in foreign exchange trading is attributable to transactions in foreign exchange swaps. The US dollar remained the leading currency in the foreign exchange market, being involved in almost 90% of all transactions. The euro remained the second most actively traded currency, with its share increasing by around 1 percentage point, to around 32% in April 2019 (see Chart 8).[8] In line with global reserves, transactions in global foreign exchange markets became more diversified. The share of transactions against emerging market currencies rose further, to 25%.[9]
The share of the euro in global foreign exchange turnover increased somewhat in 2019
Share of the euro in global OTC foreign exchange transactions, on a net-net basis
(percentages, in April of the corresponding year shown on the x-axis)
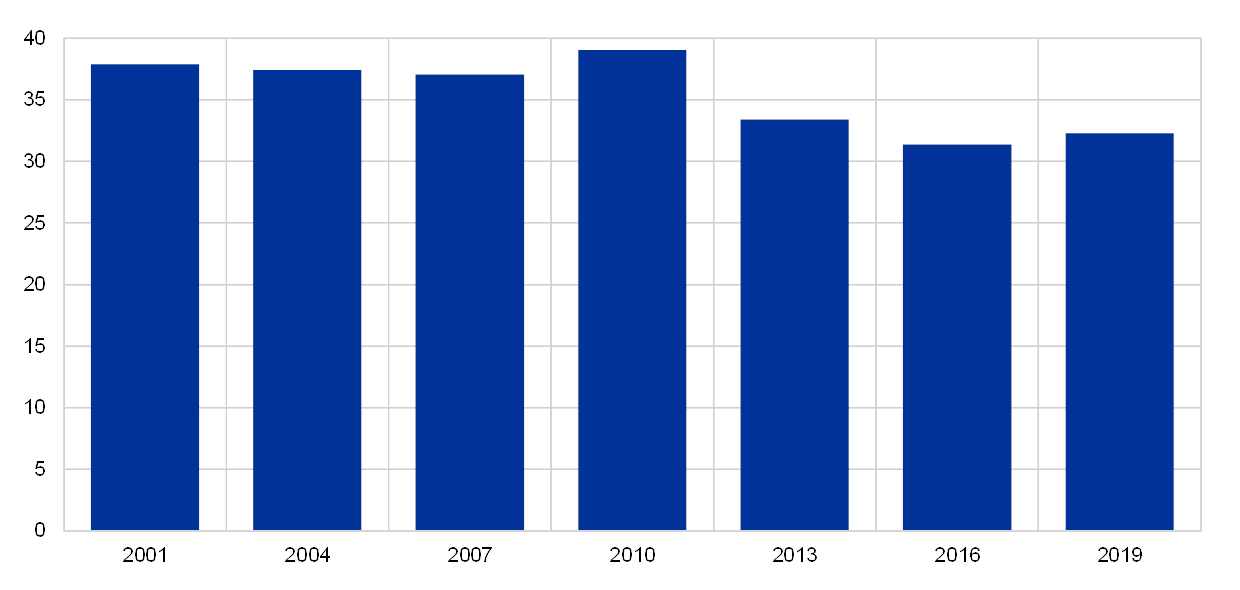
Sources: BIS and ECB calculations.Notes: As two currencies are involved in each transaction, the sum of the percentage shares of individual currencies totals 200% instead of 100%. Adjusted for local and cross-border inter-dealer double-counting (i.e. “net-net” basis).
The City of London remained the main venue globally for foreign exchange transactions in euro in April 2019, less than a year prior to the exit of the United Kingdom from the European Union. Foreign exchange trading is increasingly concentrated in a small number of large financial hubs. In 2019, the top five trading locations accounted for 79% of global foreign exchange transactions. The United Kingdom alone accounted for 43%. This largely reflects the role of the City of London, which plays a pivotal role across a range of financial markets, and is the world’s largest venue for foreign exchange trading. The role of the City of London was even more pronounced in foreign exchange transactions against the euro, with a share of almost 50% (see Chart 9). Most foreign exchange transactions vis-a-vis the euro took place outside the euro area, i.e. in London or in other locations. The combined share of euro area trading locations was just 13% of total transactions involving the euro in the review period. Research suggests that various factors combine to determine the location of foreign exchange trading. Increasing returns and the self-reinforcing effects of market liquidity tend to concentrate transactions in a few financial centres. Economies of scope arising from concentration of suppliers of intermediate goods or specialised services, such as legal, IT and accounting services, or the availability of skilled and talented staff, are additional sources of segmentation of the geography of foreign exchange trading.
However, research also suggests that technology dampens the impact of traditional spatial determinants to a significant extent and can have economically important implications for the distribution of foreign exchange transactions across financial centres. One estimate, for instance, suggests that the City of London’s status as a hub for fibre-optic cables – cables often considered as the “backbone of the internet” – boosts its share in global foreign exchange turnover by about one-third.[10] Market developments, such as the rising importance of high-frequency trading and co-location services, may mean that this factor has become increasingly important in the foreign exchange market. In turn, this is consistent with conjectures in market reports that the large sunk costs involved in laying undersea or terrestrial fibre-optic cables might lead to persistence in the current geographic distribution of foreign exchange trading after the exit of the United Kingdom from the European Union.
Most foreign exchange transactions in euro take place outside the euro area, notably in the City of London
Share of selected countries in global foreign exchange transactions in euro in 2019
(percentages)

Sources: BIS and ECB staff calculations.Notes: The data include spot transactions, outright forwards, foreign exchange swaps, currency swaps, options and other products. They are adjusted for local inter-dealer double-counting (i.e. net gross basis) and may differ slightly from national survey data owing to differences in aggregation procedures and rounding. The BIS uses several criteria to determine the location of a foreign exchange transaction, notably the location of the initiating sales desk.
The primacy of the City of London as a trading venue for the euro is a long-standing phenomenon and has grown further still over the past three years, with its share increasing by almost 5 percentage points, against 14 percentage points since 2001 (see Chart 10).
The importance of the City of London for foreign exchange transactions against the euro has grown over the past three years
Developments in the share of selected countries in global foreign exchange transactions in euro, 2001‑2019
(percentages)
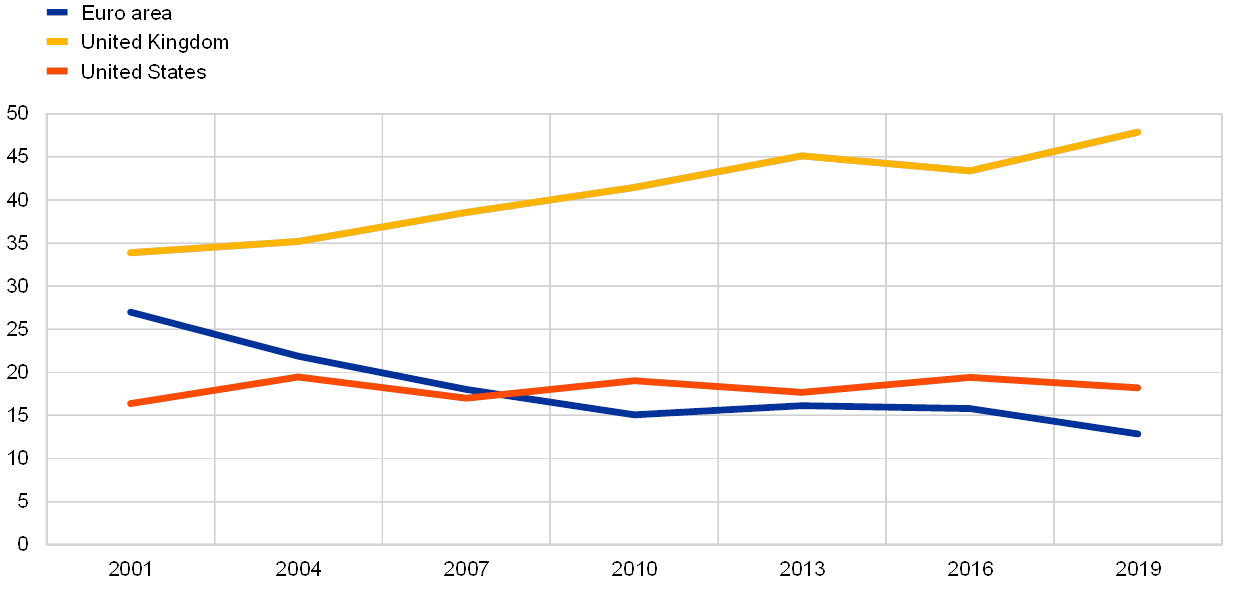
Sources: BIS and ECB staff calculations.Note: See Chart 9.
The share of the euro in global foreign exchange settlements declined somewhat over the past year. Data on foreign exchange transactions settled in the CLS system provide additional quantity-based evidence on the role of the euro in the foreign exchange markets.[11] According to these data, the share of the euro in foreign exchange settlements stood at around 36% in December 2019, down by approximately 1 percentage point over the previous 12 months (see Chart 11). The share of the US dollar remained in excess of 90%, making it by far the leading currency in global foreign exchange settlements.[12]
The share of the euro in global foreign exchange settlements declined in 2019
Share of foreign exchange transactions settled in CLS
(percentages)
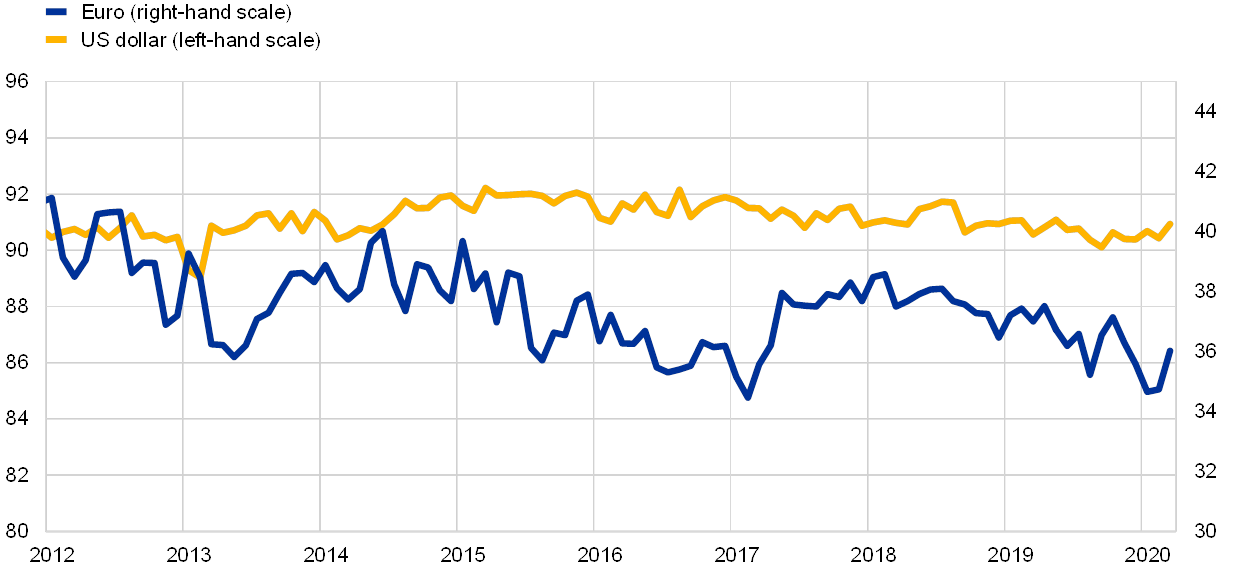
Sources: CLS Bank International and ECB calculations.Notes: The latest observation is for March 2020. As two currencies are involved in each transaction, the sum of shares in individual currencies totals 200%.
2.3 Use of the euro in international debt and loan markets
2.3.1 The euro in international debt markets
The share of the euro in the stock of international debt securities declined by 0.3 percentage point in 2019, standing at around 22% at constant exchange rates (see Chart 12 and Table A4).[13] The share of the US dollar increased by half a percentage point in the review period, continuing the rising trend seen since before the global financial crisis of 2007‑09. By contrast, the share of the euro declined by almost 9 percentage points over the same period. Recent research indicates that the geographic distribution of holdings of US-dollar bonds is unique in that a large share is held by foreign investors, while the vast majority of bonds in other currencies, including the euro, is held by domestic investors.[14]
The share of the euro in the stock of international debt securities declined in 2019
Currency composition of outstanding international debt securities
(percentages; at Q4 2019 exchange rates)
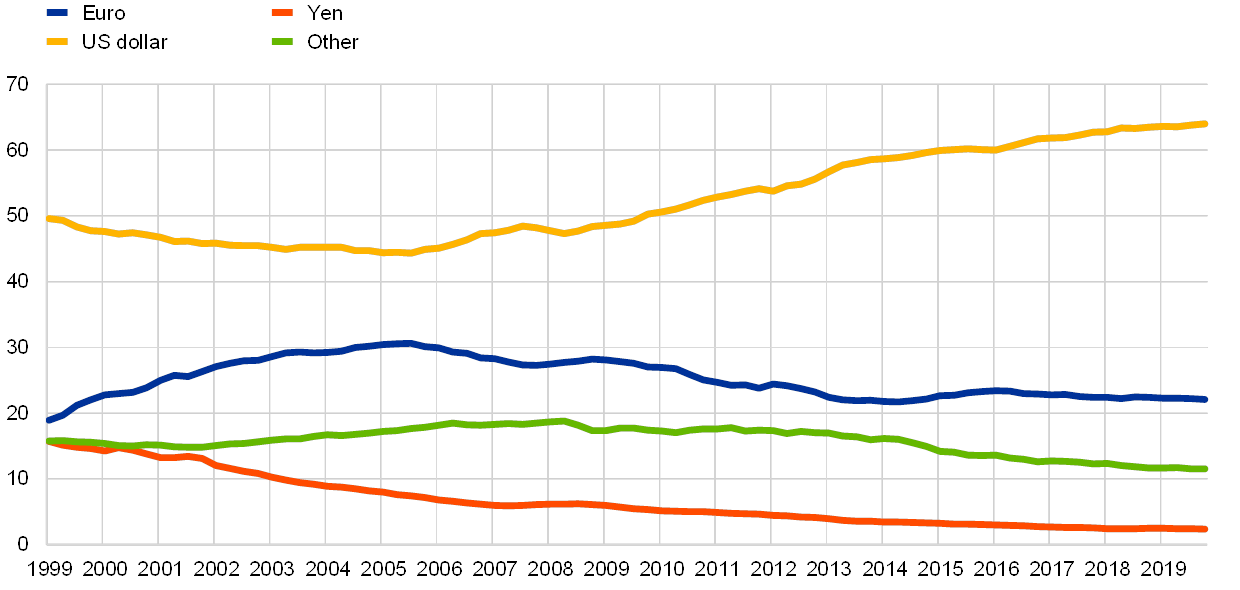
Sources: BIS and ECB calculations.Notes: Narrow measure. The latest data are for the fourth quarter of 2019.
An examination of granular (i.e. security-by-security) data on international issuance of foreign currency-denominated debt securities suggests that the share of US dollar-denominated issuance was broadly stable, while the share of euro issuance increased for the second consecutive year. In 2019 the total volume of foreign currency-denominated debt issuance increased by almost 4%, to just under USD 2 trillion, thereby partly reversing the marked decline observed in 2018 (see the left panel of Chart 13). Issuance of debt securities denominated in US dollars increased by just 2%, or USD 26 billion, while issuance in euro increased by 10%, or USD 44 billion.[15] The share of the US dollar issuance therefore remained broadly stable, at approximately 60% of total issuance in 2019 – almost 7 percentage points down from its peak in 2016. By contrast, the share of euro issuance increased by 1.4 percentage points in the review period, to almost 24%.[16] That the data on the share of the euro in foreign currency-denominated debt issuance reveal a different pattern than the data on the stock of international debt securities may be due to the fact that the latter depend additionally on net redemptions and developments in money market instruments.
The share of the euro in international issuance of foreign currency-denominated debt securities further increased in 2019
Currency composition of foreign currency-denominated debt issuance
(left panel: USD billions; right panel: percentages)

Sources: Dealogic and ECB calculations.Note: The latest data are for the fourth quarter of 2019.
Issuance of international US dollar debt securities in the review period was largely driven by resurgent issuance by emerging market borrowers possibly linked to the Federal Reserve’s pivot to more accommodative monetary policy. US dollar-denominated debt issuance by emerging market borrowers increased markedly by almost 30% in 2019, thereby reversing most of the decline of 2018 (see the green line in the left panel of Chart 14).[17] Issuance accelerated noticeably in the first half of 2019, perhaps in anticipation of a pause in increases in the federal funds target range of the Federal Reserve.[18] This is in line with developments over much of the last decade, whereby emerging-market issuers tried to take advantage of low US interest rates to borrow US dollars. The share of US dollar issuance rose noticeably between 2009 and 2013 when unconventional US monetary policies were deployed and remained high subsequently. By contrast with emerging markets, US dollar-denominated debt issuance in advanced economies declined in 2019.[19]
US borrowers were among the most active issuers of euro-denominated debt securities in 2019, as in earlier years. Euro-denominated issuance by US borrowers more than doubled to around USD 150 billion in 2019 (see the light-blue line in the right panel of Chart 14) and the combined issuance by advanced economies reached the highest level since the global financial crisis. The cross-currency swap basis – which measures the premium paid to borrow US dollars “synthetically” by using another currency such as the euro as the funding unit and swapping the proceeds into US dollars – was relatively stable in 2019. The cost of synthetic dollar issuance via the euro remained therefore broadly unchanged, which might have supported issuance of international euro-denominated debt securities by US borrowers. In line with this, press reports suggest that the very low rates available in the euro area during the review period encouraged market participants to use the euro as a funding currency in carry trade transactions, where funds are borrowed in economies with relatively low interest rates and invested in economies with higher interest rates.[20] Issuance by emerging market borrowers also increased somewhat, but remained relatively small in volume.[21] Overall, euro-denominated international bond issuance stood at over USD 470 billion in 2019, its highest level since 2008.[22]
Emerging market borrowers drove US-dollar denominated international debt issuance in 2019, while US borrowers were the most dynamic issuers of euro-denominated debt
Regional breakdown of US-dollar denominated (left panel) and euro denominated (right panel) international debt issuance
(USD billions)

Sources: Dealogic and ECB calculations.Note: The latest data are for the fourth quarter of 2019.
The composition of international issuance of euro denominated debt by security type has changed substantially. Issuance was primarily driven by investment-grade corporate-bond issuance, which increased by 26% in 2019 (see Chart 15). And it continued to account for the majority (60%) of issuance. Issuance of short-term debt, and asset- and mortgage-backed securities, which were widespread in the years preceding the global financial crisis, remained more limited in 2019.
International issuance of euro-denominated debt securities reached the highest level since the global financial crisis, driven by corporate borrowers
International issuance of euro-denominated debt securities, by security type
(USD billions)

Sources: Dealogic and ECB calculations.Note: The latest data are for the fourth quarter of 2019.
2019 also saw a shift in the sectoral composition of international issuance of euro-denominated debt securities. While financial institutions remained the most active issuers of US dollar-denominated international bonds, their share of total euro-denominated issuance declined by over 10 percentage points in the review period, to around 55% (see the left panel of Chart 16). By contrast, the share of the construction and manufacturing sector increased by approximately 5 percentage points, to over 22%. This contrasts with earlier years when the largest issuers were typically found among financial institutions but is consistent with the tendency for many global firms to finance themselves through foreign subsidiaries in conduit economies, often for tax optimisation purposes.[23] Sovereign issuance continued to account for approximately 10% of total international issuance of euro‑denominated debt securities.
Construction and manufacturing firms accounted for a larger share of issuance of euro-denominated international debt securities in 2019, with financial institutions remaining the most active issuers
Sector breakdown of euro-denominated (left panel) and US-denominated (right panel) international debt issuance
(percentages)

Sources: Dealogic and ECB calculations.
Box 1 The role of the euro in global green bond markets
A green bond is a type of fixed-income security whose proceeds are earmarked to finance investment projects with an environmental benefit. These debt instruments are increasingly used by companies, governments and financial institutions to finance the adoption of more energy-efficient technologies, reduce carbon emissions and reorient business models towards sustainable economic activities.[24] While the global green bond market is still relatively small, it has been growing rapidly in recent years. Global green bond issuance was only USD 9.1 billion or 0.2% of total bond issuance in 2014; that figure grew to approximately USD 205 billion or 2.85% of total issuance by 2019. This amounts to a 20 fold increase in the last five years. Growing investor demand for green financial products and the recent entry of sovereign issuers in the market suggest that there is significant potential for further growth in this segment.[25]
EU residents are the largest issuers of green bonds. In 2019 more than half of global issuance was concentrated in the EU and almost half of global green bond issuance was denominated in euro (see left panel of Chart A). The euro is also leading in terms of relative importance of green bonds compared to other bonds: the proportion of green bonds relative to total bond issuance denominated in euro rose to almost 9% by the end of 2019, compared to 2.1% for bonds in US dollars and around 2.5% for bonds in other currencies. The leading role of the euro does not simply reflect the prevalence of green bond issuers based in the euro area. As shown in the right panel of Chart A, issuance of euro-denominated green bonds is also strong among non-euro area residents, with non-euro area issuers accounting for almost 30% of total euro-denominated green bond issuance in 2019, which suggests that the euro is also attractive for foreign issuers. While incumbent currencies display a significant degree of inertia in established markets[26], the emergence of new segments of capital markets could provide a window of opportunity for other currencies to gain international use. As the euro is already the main currency of denomination for the issuance of green bonds, the consolidation of the EU role as a global hub for green finance could strengthen the euro as the currency of choice for sustainable financial products, bolstering its international role.
Chart A
Almost half of global green bond issuance is denominated in euro; issuance of euro-denominated green bonds – breakdown by issuer residence
Currency breakdown of green bond issuance in 2019 (left panel) and developments of the share of euro area and non-euro area issuers of green bonds in euro (right panel)
(percentages)
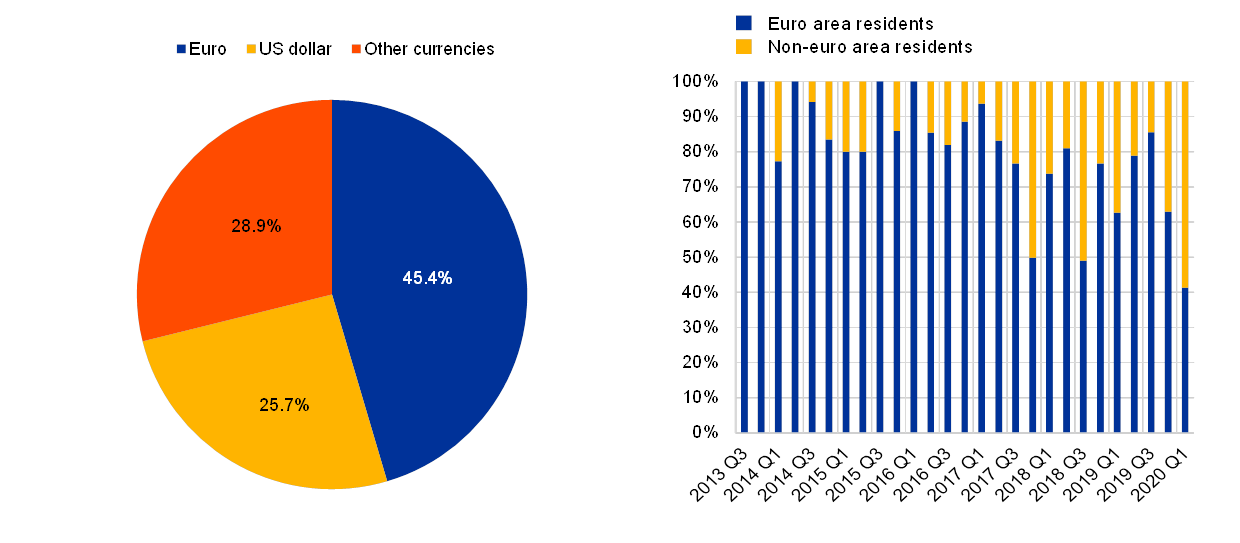
Sources: Dealogic and ECB calculations.Note: last observation 31 January 2020.
Future developments will depend on multiple factors, including the EU’s ability to fully reap the benefits of the capital markets union and the rapid developments in the regulatory environment. The European Commission launched an Action plan on sustainable finance in 2018. The objective of this action plan was to create an enabling framework for sustainable finance notably through the development of a taxonomy of sustainable economic activities aimed at preventing “greenwashing”, commonly defined as the practice of making an unsubstantiated or misleading claim about the environmental benefits of a financial product. The swift implementation of the taxonomy could be conducive to strengthening the international role of the euro by providing a credible and standardised framework and ensuring greater investor confidence. Further EU initiatives are ongoing to increase the availability of information on sustainability, develop an EU green bond standard, and enhance international coordination.[27] Whether the euro will benefit from these efforts will also depend on the approaches of other jurisdictions. A number of countries, most notably the United Kingdom, China and Singapore, have also developed green finance strategies to promote the growth of this segment and foster their role as international centres for green finance. One challenge going forward is to avoid regulatory competition undermining efforts to set common standards and to prevent “greenwashing”, which could lead to undue market fragmentation and reduce the environmental benefits of green finance.
2.3.2 The euro in international loan and deposit markets
The share of the euro in international loan markets continued to rise in 2019. This represents a reversal of the decline observed between 2006 and 2014. As shown in earlier reports, the decline in the share of the euro in international loans in that period was due to, among other things, deleveraging by euro area banks and regulatory efforts to reduce exposures to foreign loans.[28] At constant exchange rates, the share of the euro in international loans increased in 2019, by approximately 1 percentage point (see Chart 17 and Table A6).[29] At the same time, the share of the US dollar in international loan markets declined by more than 1 percentage point, albeit it remained the leading currency in international loan markets by a large margin.
The share of the euro in outstanding international loans increased in 2019
Currency composition of outstanding amounts of international loans
(percentages; at Q4 2019 exchange rates)

Sources: BIS and ECB calculations.Notes: The latest data are for the fourth quarter of 2019. International loans are defined as loans by banks outside the currency area to borrowers outside the currency area.
The ECB’s accommodative monetary policy stance may have continued to support the euro in international loan markets.[30] In absolute terms, volumes of euro-denominated loans by banks outside the euro area to non-euro area borrowers have grown rapidly since 2016, such that they were around twice as large in 2019 as in the aftermath of the global financial crisis in 2009 at current exchange rates (see Chart 18). Similarly, volumes of all outstanding cross-border loans denominated in euro were around 3% higher compared to 2018. Recent research indicates that euro area banks operating internationally reallocated funds abroad within their respective banking organisations in response to the ECB’s unconventional monetary policy measures. This suggests that international monetary policy transmission may be amplified by internal capital markets.[31] The increase in the supply of euro-denominated funding outside the euro area is also likely to have boosted euro lending by banks outside the euro area.
Volumes of international loans denominated in euro continued to increase in 2019
Amounts outstanding of international loans denominated in euro
(billions of US dollars; at current exchange rates)

Sources: BIS and ECB calculations.Note: The latest data are for the fourth quarter of 2019.
In line with this, volumes of outstanding euro-denominated loans increased in many countries in central, eastern and south-eastern Europe in 2019 (see Table A10). This occurred despite recent efforts by some local authorities to promote domestic currency lending, in order to mitigate potential financial stability risks raised by currency mismatches.
An examination of granular (i.e. security-by-security) data on international issuance of foreign currency-denominated debt securities suggest that international loan issuance declined in 2019, primarily due to a fall in US dollar-denominated loans (see Chart 19). US dollar-denominated investment-grade loan issuance declined by around 20%. By contrast, euro-denominated investment-grade loan issuance increased by more than 40% in 2019, to almost USD 90 billion, the highest level observed since 2011. As a consequence, the share of the euro in total investment-grade loan issuance increased from 10% in 2018, to almost 17% in 2019. The share of the euro in total leveraged loans issuance remained broadly stable. Overall, the share of euro-denominated international loan issuance remained well behind that of the US dollar, which accounted for around 80% of both investment grade and leveraged loan issuance.
Volumes of US dollar-denominated international loans declined in 2019, unlike euro-denominated loans
Breakdown of US dollar-denominated (left panel) and euro-denominated (right panel) international loans by type
(USD billions)

Sources: Dealogic and ECB calculations.Note: The latest data are for 2019.
The share of the euro in outstanding international deposits remained stable in 2019. The share of the euro in the stock of international deposits stood at just under 19% in 2019, at constant exchange rates (see Chart 20 and Table A7).[32] It is approximately 4 percentage points above the trough observed in 2016, albeit below the mid-2000s peak of just over 21%. The share of the US dollar in outstanding international deposits also remained stable over the review period, standing at around 53%.
The share of the euro in outstanding international deposits remained stable in 2019
Currency composition of outstanding amounts of international deposits
(percentages; at Q4 2019 exchange rates)

Sources: BIS and ECB calculations.Notes: The latest data are for the fourth quarter of 2019. International deposits are defined as deposits with banks outside the currency area from creditors outside the currency area.
2.4 Use of the euro as an invoicing currency
The share of the euro as an invoicing or settlement currency for extra-euro area trade remained broadly unchanged in 2019 for transactions in goods, but declined for those in services. 61% of extra-euro area exports and 51% of extra-euro area imports of goods were invoiced in euro in 2019 (see the left panel of Chart 21 and Table A8). 62% of extra-euro area services exports were invoiced in euro in 2019, down from 64% the previous year. Similarly, just under 52% of extra-euro area imports were invoiced in euro in 2019, compared to 53% in the previous year (see the right panel of Chart 21). Recent research suggests that there are three main factors which determine currency choice for international trade invoicing, namely: economic size, global value chain integration and strategic pricing complementarities in world export markets.[33]
The share of the euro in the invoicing of extra-euro area transactions in goods remained broadly stable in 2019, but declined for those in services
Share of the euro in the invoicing of extra-euro area trade in goods (left panel) and in the invoicing of extra-euro area trade in services (right panel)
(percentages)

Sources: ECB, IMF DOTS and ECB calculations.Note: The latest data are for 2019.
Patterns across euro area countries point to a positive correlation between invoicing transactions in goods and invoicing transaction in services in euro (see Chart 22). The correlation between the shares of international transactions in goods invoiced in euro and international transactions in services invoiced in euro is positive, albeit stronger for exports than for imports. Notable exceptions are Greece and Cyprus, perhaps due to a high share of services relating to shipping services, which are typically invoiced in US dollars.
Euro invoicing in external transactions of euro area members – goods versus services
Share of the euro in the invoicing of extra-euro area trade in services and goods: exports (left panel) and imports (right panel)
(percentages of total exports)

Source: ECB.Note: Data are for 2019 or the latest available year.
2.5 Use of euro cash outside the euro area
The stock of euro banknotes shipped to destinations outside the euro area remained broadly stable in 2019. Net shipments were broadly unchanged last year, following declines observed between 2015 and mid‑2018 (see Chart 23).[34] This suggests that foreign demand for euro cash outside the euro area has remained resilient, much as it is in the euro area. Chart 24 shows data collected from banknote wholesalers, which act as intermediaries between the national central banks of the Eurosystem and financial institutions outside the euro area. Entities in euro area neighbouring countries remained the main exporters and importers of euro banknotes, accounting for around 64% of both sales and purchases. The largest increase in net exports was to the Middle East region, where it rose by some EUR 2 billion compared to 2018. This was more than offset by the decline of net sales to non-EU eastern European countries of nearly EUR 5.5 billion.
Foreign demand for euro banknotes remained broadly stable in 2019
Net monthly shipments of euro banknotes to destinations outside the euro area
(EUR billions; adjusted for seasonal effects)

Source: Eurosystem.Notes: Net shipments are euro banknotes sent to destinations outside the euro area minus euro banknotes received from outside the euro area. The latest observation is for February 2020.
In 2019 euro banknotes were mainly exported to, and imported from, euro area neighbouring regions
Sales (exports, left panel) and purchases (imports, right panel) of euro banknotes – breakdown by destination
(percentages)

Source: ECB calculations based on data from international banknote wholesalers.Note: The data are for 2019.
3 Statistical annex
See more.
© European Central Bank, 2020
Postal address 60640 Frankfurt am Main, GermanyTelephone +49 69 1344 0Website www.ecb.europa.eu
All rights reserved. Reproduction for educational and non-commercial purposes is permitted provided that the source is acknowledged.
For specific terminology please refer to the ECB glossary (available in English only).
The cut-off date for the statistics included in this report was 21 April 2020.
PDF ISBN 978-92-899-4362-8, ISSN 1725-6593, doi: 10.2866/674321, QB-XN-20-001-EN-NHTML ISBN 978-92-899-4361-1, ISSN 1725-6593, doi: 10.2866/03828, QB-XN-20-001-EN-Q
- [1]See Ilzetzki, E., Reinhart, C. and Rogoff, K., “Why is the euro punching below its weight?” NBER Working Paper, No. 26760, February 2020.
- [2]At current exchange rates, the share of the euro declined by 0.1 percentage point owing to the depreciation of the euro exchange rate against the US dollar in the review period.
- [3]An alternative explanation is that this could reflect central bank purchases of Japanese securities on a hedged basis, for instance from their US dollar reserves. Transactions such as these are common, and potentially profitable, and do not necessarily reflect an attempt to rebalance the composition of foreign exchange reserves towards the Japanese yen.
- [4]See, for instance, Szalay, E., “Currency war fears bolster demand for havens”, Financial Times, 7 August 2019. The SNB held over USD 800 billion worth of foreign exchange reserves at the end of 2019. Press reports further suggest that Swiss foreign exchange market intervention may have slowed down following the addition of Switzerland to the US Department of the Treasury monitoring list of currency practices and macroeconomic policies. See Davies, C.J. and Ostroff, C., “Swiss franc climbs against euro, leaving central bank in bind”, Wall Street Journal, 23 February 2020.
- [5]The latest data available on the currency composition of the foreign exchange reserves of the Central Bank of Russia are for January 2020.
- [6]Moreover, the share of the US dollar in the foreign reserves (including gold) of the Central Bank of Russia increased by 2 percentage points between mid‑2018 and mid‑2019, to 24%, presumably in the form of other highly-rated US issuers or US dollar-denominated deposits, while the share of the euro declined slightly, to around 31%. Excluding gold, the share of the euro was broadly stable in 2019, at about 38%, while that of the US dollar increased by almost 3 percentage points, to around 30%.
- [7]See Chiţu, L., Gomes, J. and Pauli, R., “Trends in central banks’ foreign currency reserves and the case of the ECB”, ECB Economic Bulletin, Issue 7, ECB, Frankfurt am Main, 2019.
- [8]The increase was due to dynamism in transactions in some currency pairs, notably JPY/EUR and CHF/EUR. This notwithstanding, the share of the euro remained below its peak of 39% of global foreign exchange transactions in April 2010.
- [9]As two currencies are involved in each transaction, the sum of the percentage shares of individual currencies totals 200% instead of 100%. The share of transactions against the renminbi remained stable, at around 4%, paralleling developments in the Chinese currency as a global reserve unit.
- [10]See Schrimpf, A. and Sushko, V., “Sizing up global foreign exchange markets”, BIS Quarterly Review, December issue, 2019, pp. 21‑38. See also Eichengreen, B., Lafarguette, R. and Mehl, A., “Cables, sharks and servers: technology and the geography of the foreign exchange market”, NBER Working Paper, No 21884, January, 2016.
- [11]CLS is operated by CLS Bank International, a specialised financial institution providing settlement services to its members in the foreign exchange market. Although not all foreign exchange transactions are settled in CLS, which partly reflects the fact that the foreign exchange market is largely decentralised, it has been estimated that over 26% of all global foreign exchange transactions are settled in CLS. This suggests that data on activity in CLS might be indicative of broader market trends.
- [12]As two currencies are involved in each transaction, the sum of shares in individual currencies totals 200%.
- [13]The discussion here is based on the “narrow” definition of international debt issuance, which focuses on the foreign currency principle. This definition therefore excludes all domestic currency issuance from the standard (also known as “broad”) definition of international debt issuance, which is based on the residence principle. For instance, the narrow definition excludes a euro-denominated bond issued by a German company whether outside the euro area (e.g. in the United States) or inside the euro area (e.g. in France).
- [14]See Maggiori, M., Neiman, B. and Schreger, J., “International currencies and capital allocation”, NBER Working Paper, No 24673, April 2019.
- [15]Issuance in currencies other than the US dollar and the euro increased by 2%,
- [16]The share of other currencies declined marginally to stand at approximately 16% in 2019.
- [17]One noteworthy exception is Russia. Since economic and financial sanctions were imposed on Russia by the international community in 2014, international issuance of both US dollar- and euro-denominated debt securities by Russian borrowers fell significantly and remains well below earlier peaks.
- [18]Media reports suggest that Chinese regulators may have introduced measures in June and July 2019 in order to curb Chinese offshore issuance of US dollar-denominated corporate bonds, which had been increasing rapidly in the first half of 2019.
- [19]For instance, US dollar-denominated issuance by euro area borrowers fell by 12%, to almost USD 230 billion and US dollar-denominated issuance by borrowers in other advanced economies (i.e. excluding the United States, euro area and Japan) declined by approximately 13%, to around USD 340 billion in 2019.
- [20]See, for instance, Szalay, E., “How the euro has become ‘the world’s new carry trade’, Financial Times, 5 December 2019. Unwinding of these positions might have contributed to the strengthening of the euro against the US dollar following the outbreak of the COVID‑19 pandemic amid heightened global risk aversion.
- [21]Issuance of euro-denominated debt securities by emerging markets remained barely more than 10% of the volume of their US dollar-denominated issuance.
- [22]By contrast, amounts outstanding of euro-denominated debt securities grew by less than USD 100 billion. Figures may differ for a number of reasons, including on account of net redemptions and developments in stocks of money market instruments.
- [23]See for example, Di Nino, V., Habib, M. and Schmitz, M., ““Multinational enterprises, financial centres and their implications for external imbalances: a euro area perspective”, Economic Bulletin, Issue 2, ECB, Frankfurt am Main, 2020; Coppola, A., Maggiori, M., Neiman, B., and Schreger, J., “Redrawing the map of global capital flows: the role of cross-border financing and tax havens”, Becker Friedman Institute Working Paper, No 2019‑118, University of Chicago 2020; Galstyan, V., Maqui Lopez, E. and McQuade, P., “International debt and special purpose entities: evidence from Ireland”, ECB Working Paper, No. 2301, ECB, 2019.
- [24]There are different approaches to defining and certifying green bonds. While many are self-labelled or certified according to market standards, some jurisdictions have developed certification frameworks.
- [25]Green Bond European Investor Survey 2019, Climate Bonds Initiative.
- [26]Papaioannou, E. and Portes, R., “Costs and benefits of running an international currency” European Economy, Economic Papers 348, European Commission, November 2008.
- [27]The European Commission launched on 18 October 2019 an International Platform on sustainable finance open to third countries on a voluntary basis. Its aim is to help scale up sustainable finance internationally, share best practices and enhance international coordination, for example by aligning policies.
- [28]See the Recommendation of the European Systemic Risk Board of 21 September 2011 on lending in foreign currencies.
- [29]International loans are defined as loans by banks outside the currency area to borrowers outside the currency area. For instance, international loans in euro correspond to all euro-denominated loans by banks outside the euro area to borrowers outside the euro area.
- [30]See Takáts, E. and Temesvary, J., “The currency dimension of the bank lending channel in international monetary transmission”, Journal of International Economics, forthcoming, and Gräb, J., and Żochowski, D., “The international bank lending channel of unconventional monetary policy”, Working Paper Series, No 2109, ECB, Frankfurt am Main, November 2017.
- [31]See Cetorelli, N. and Goldberg, L.S., “Banking Globalization and Monetary Transmission”, Journal of Finance, Vol. 67(5), 2012, pp. 1811‑1843. As global banks respond to domestic monetary shocks by managing liquidity globally through an internal reallocation of funds between headquarters and foreign branches or subsidiaries, their foreign lending is more affected by domestic shocks (see also Bénétrix, A. and Schmitz, M., “Euro-US dollar exposures in cross-border banking”, The International role of the euro, ECB, Frankfurt am Main, 2019).
- [32]The definition of international deposits is equivalent to the definition of international loans. International deposits are defined as deposits with banks outside the currency area from creditors outside the currency area. For instance, international deposits in euro correspond to all euro-denominated deposits with banks outside the euro area from creditors outside the euro area.
- [33]See Mukhin, D., “An equilibrium model of the international price system," 2018 Meeting Papers 89, Society for Economic Dynamics, 2018, mimeo.
- [34]As noted in last year’s report, the earlier decline may have reflected several factors, including the discontinuation of production and issuance of EUR 500 banknotes, which may have reduced demand for this denomination, although it remains legal tender. It was decided to permanently stop producing the EUR 500 banknote to take into account concerns that the banknote could have facilitated illicit activities. Data on official shipments, which put the stock of euro banknotes in circulation outside the euro area at about EUR 167 billion, only capture observed cross-border flows of banknotes. An indirect estimation method, which attempted to quantify the unobserved cross-border flows of banknotes by combining information on domestic banknote circulation and coin circulation and by making assumptions on potential factors underlying those flows, suggested that the actual circulation of banknotes outside the euro area may be higher still (see the ECB press release entitled “Estimation of euro currency in circulation outside the euro area” published on 6 April 2017).
-
9 June 2020