
Euro money market study 2018
Executive Summary
In 2018, thanks to the granular data gathered via money market statistical reporting (MMSR), the Eurosystem was able to undertake for the first time a complete and thorough assessment of developments in the euro money market. Under MMSR the Eurosystem has been collecting daily data on all transactions conducted by the largest banks in the euro money market since the middle of 2016. Given that these newly available granular data include information on transaction prices, on the counterparties involved and on the collateral used for most segments of the money market, the Eurosystem’s understanding of how money markets evolve has greatly improved.
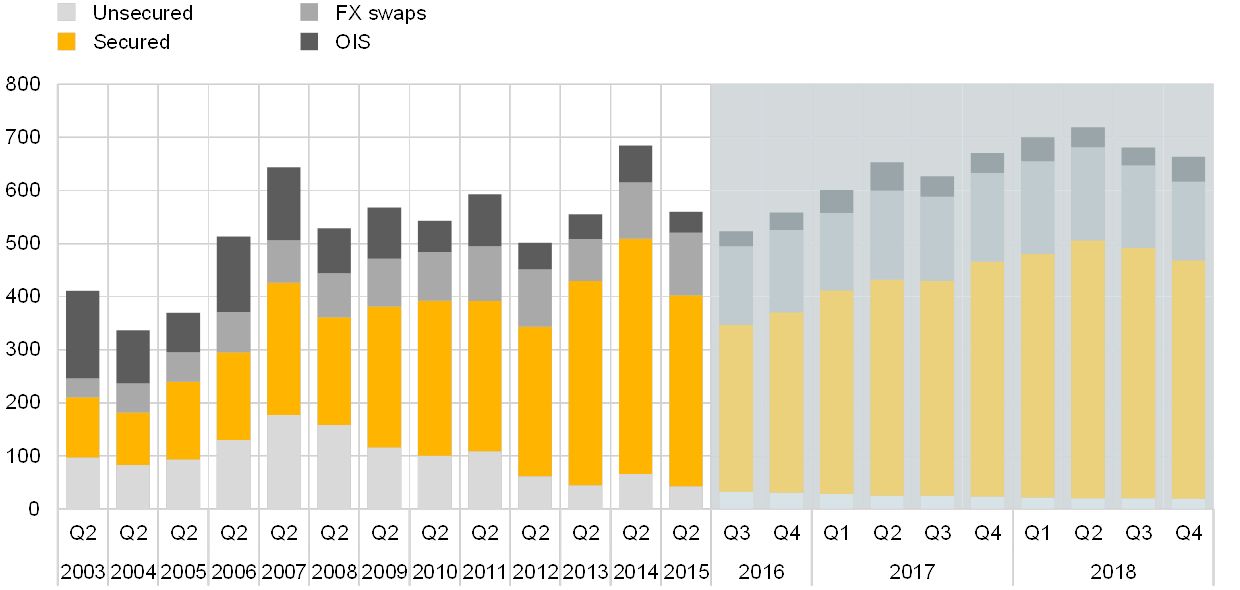
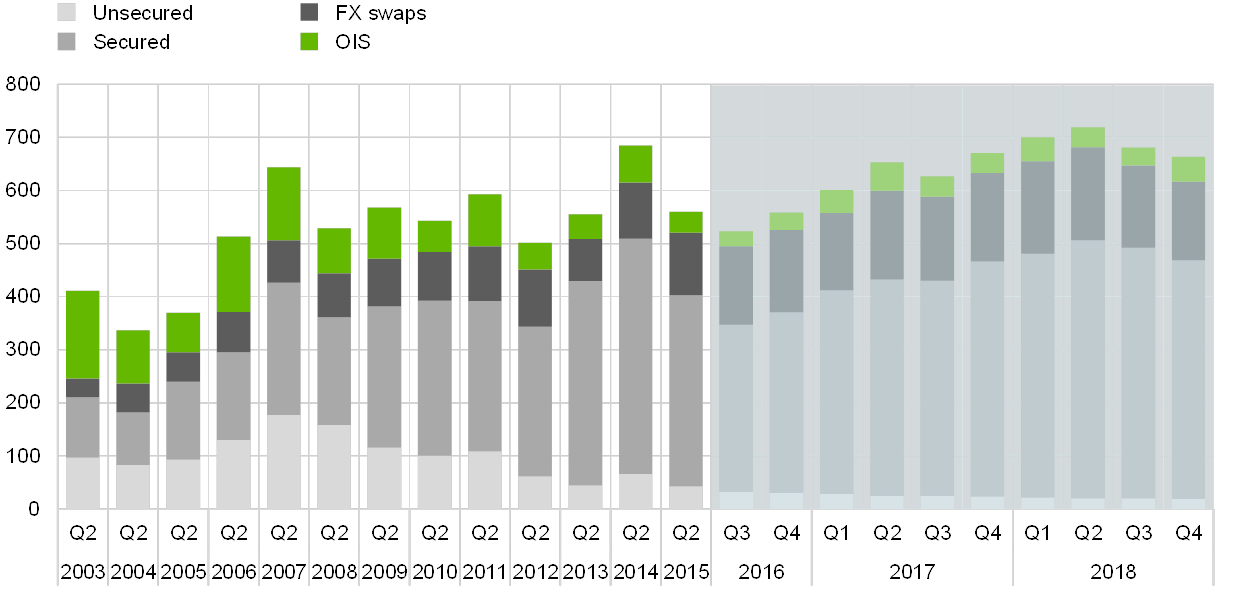
In broad terms, this money market study re-affirms that activity in the euro money market is less diversified among segments than it was before the crisis. Based on a set of 38 large euro area banks which are common to the past survey dataset – the Euro Money Market Survey (EMMS) – and MMSR, it was possible to extract perspectives on historical money market developments. The data confirm that, since the crisis, activity in the secured and foreign exchange (FX) swap segments has continued to grow, while the unsecured, overnight index swap (OIS) and short-term securities (STS) issuance segments have shrunk in size.
Market share of the cumulative volume per quarter per segment
(EUR trillions)
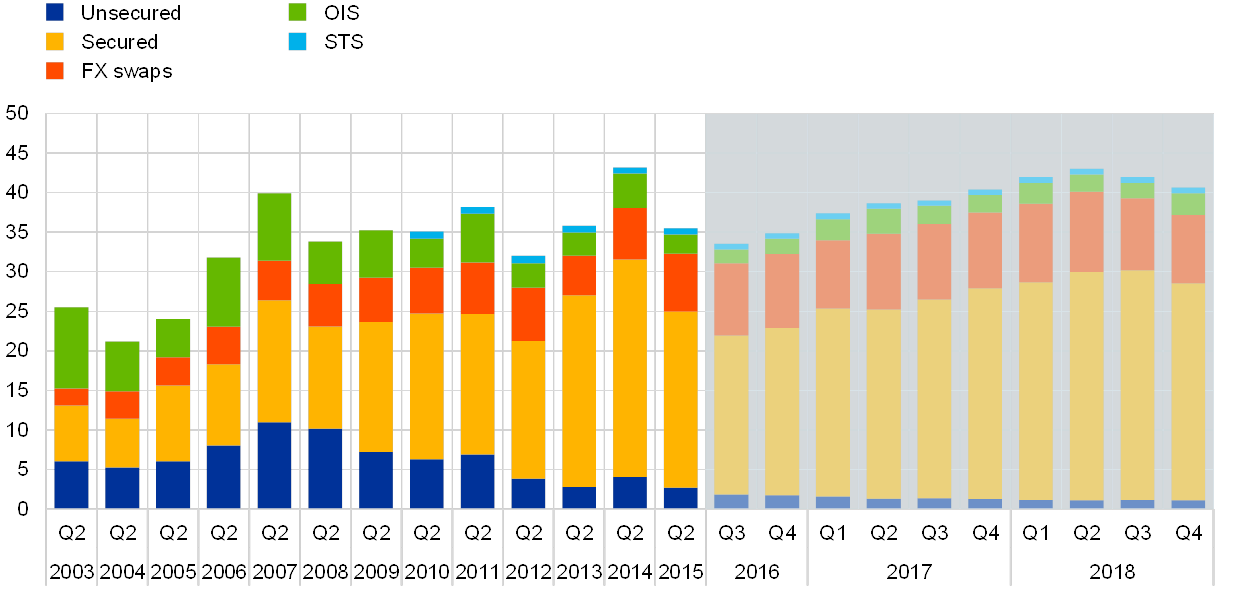
Sources: ECB and Dealogic.Notes: Unsecured, secured, FX swap and OIS market data are based on the EMMS until 2015 and MMSR from mid-2016 onwards. STS data are based on data from Dealogic. Short-term securities include STEP, NEU CP, NEU MTN and certificates of deposit outstanding amount on a quarterly basis. The period under review is indicated by a light blue background.
The bulk of the unsecured market activity, in a context of decreasing turnover, is concentrated outside the interbank sector, especially for the overnight tenors, and the secured segment has continued to gain in importance. The former is partly explained by the fact that having access to the deposit facility has implications for transaction costs and liquidity flow dynamics. Regarding the latter, turnover in the secured market has steadily increased, mainly driven by collateral rather than funding considerations, given the context of excess liquidity provided by the Eurosystem.
Developments in the various segments of the money markets relate to factors that are both exogenous and endogenous to the Eurosystem. The former include the regulatory environment as shaped by years of increased focus on enhancing macroprudential stability, capital cost concerns, incentives/disincentives for bank balance sheet adjustments and geographical segmentation; the latter include the money market implications of the ECB’s non-conventional policy measures, such as excess liquidity at all-time highs, asset purchases covering a broad range of securities for monetary policy purposes and policy rates at negative levels for a protracted period of time.
As this money market study shows, since 2016 some money market rates have moved below the Eurosystem’s deposit facility rate (DFR), sometimes by a substantial margin, especially in secured markets. The Eurosystem’s policy framework provides an effective floor for the euro overnight index average (EONIA). Since 2015 the increase in excess liquidity caused by non-standard measures has pushed the EONIA fixing close to the lower bound of the monetary policy corridor, reducing significantly its sensitivity to changes in liquidity conditions. In addition, transactions with non-banks were often priced at rates below the DFR, as those entities do not have direct access to the facilities of the Eurosystem.
Moreover, purchases of government bonds by the Eurosystem under the public sector purchase programme (PSPP) reduced the availability of high-quality collateral, thereby increasing the “specialness premium” on core assets, especially German bonds. This, together with increasing demand for high-quality securities from non-bank financial institutions (as can be seen in MMSR data), triggered a decline in core repurchase agreement (repo) rates to well below the DFR. Nevertheless, in 2017 the decline in core special repo and general collateral rates stabilised due to improved availability of core collateral. This was partly linked to the acceptance by the Eurosystem of cash collateral under the securities lending programme and possibly also to greater room for manoeuvre for dealers to carry out repo activity once a satisfactory leverage ratio was reached.
In addition, this study found evidence that the evolution of core repo rates mainly depends on the supply/demand dynamics of core assets. These dynamics are affected by the scarcity premium and the demand for core securities among non-banks. Some of these divergences are temporary and have no broader implications for monetary policy. Accounting window dressing for regulatory purposes causes repo rates to decline on balance sheet reporting dates, but they swiftly return to normal levels, as evident in MMSR data. This becomes even more discernible at year-ends. Other divergences, however, have been more lasting and seem to correlate with the evolution of excess liquidity levels. Many of the sellers of the securities purchased under the Eurosystem’s asset purchase programme (APP) are either non-banks – typically, asset managers, pension funds, insurance companies or corporate treasurers – or banks located outside the euro area. And, although these purchases replace one safe asset with another – government bonds with central bank liquidity – differences in who prefers to hold these assets may result in persistent price effects. In other words, while the DFR provides a hard floor for direct monetary policy counterparties (i.e. euro area banks), other financial market participants must look elsewhere for safe and liquid investments. Although banks are willing to accept cash inflows from the latter and deposit them at the central bank, this service is not without cost, as banks’ balance sheet capacity has become expensive. This means that, in an environment in which the supply of safe assets is shrinking, due to limited issuance and central bank asset purchases, and demand is increasing, due to regulatory changes, safe and liquid short-term assets other than central bank reserves are becoming scarce.
Introduction
The 2018 Money Market Study analyses the functioning of the euro money market since the middle of 2016. The euro money market is an important part of the financial system. It represents the wholesale market for short-term funds denominated in euro, in which lending and borrowing of funds varies from overnight to one year. Participants in this market include banks (deposit-taking institutions), investment firms (financial corporations), companies (non-financial corporations – NFCs) and central banks. Money markets play a central role in monetary policy transmission in the euro area.
The study covers five segments of the money markets. They are: (i) unsecured lending/deposit transactions; (ii) secured transactions (repos and reverse repos); (iii) foreign exchange swaps (FX swaps); (iv) overnight index swaps (OISs); and (v) short-term securities issuances.
The current study is based – for the first time – on granular information on daily executed transactions. The previous study – published in 2015 – was based on limited information (mainly referring to volumes) collected through a survey of a sample of banks. To have more detailed and timely information, the ECB started collecting daily transaction-by-transaction data on the euro money market in 2016. These money market statistical reporting (MMSR) data are based on actual money market transactions reported to the Eurosystem by the 50 largest credit institutions located in the euro area, including their branches in the EU and the European Free Trade Association (EFTA). The MMSR data cover four segments of the euro-denominated money market: unsecured transactions, secured transactions, FX swaps, and OISs. Given that the MMSR data do not fully cover the short-term securities issuance segment, the information on that segment is complemented with statistics on Short-Term European Paper (STEP) and French Negotiable European Commercial Paper (NEU CP) as well as data from Dealogic.
The analysis focuses on developments occurring between the middle of 2016 (the start of the MMSR data collection) and the end of 2018.
1 The unsecured segment
Since July 2016 activity in the unsecured segment of the money market has remained subdued in an environment characterised by a high level of excess liquidity, negative policy rates – with the Eurosystem’s deposit facility rate (DFR) at -0.40% – and a regulatory environment that is making unsecured funding less attractive.
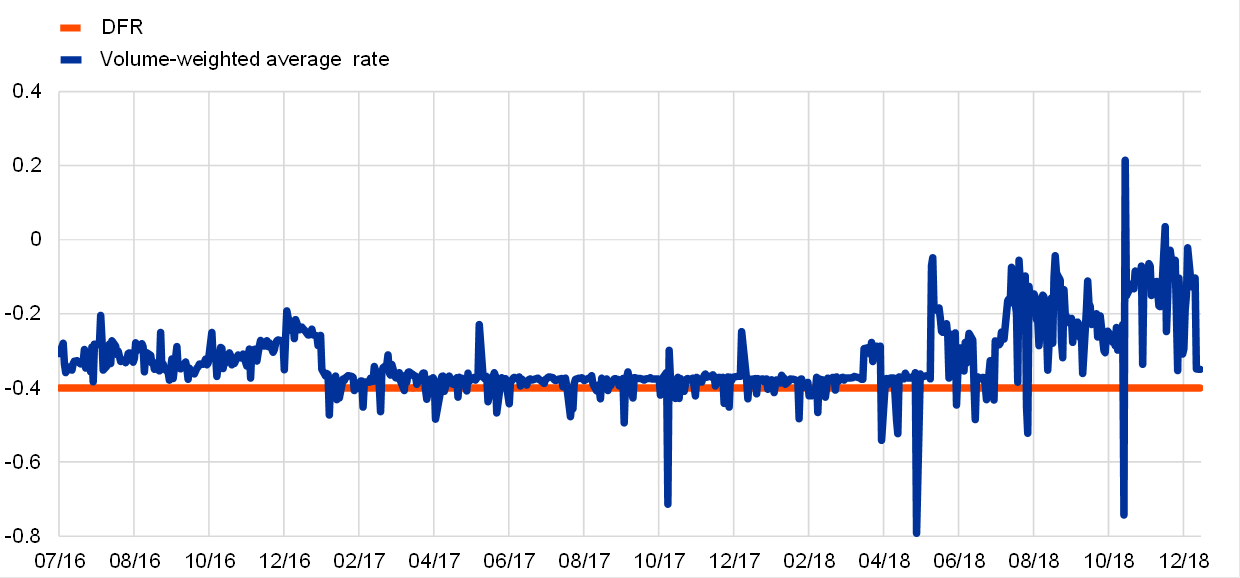
Owing to the very high level of excess liquidity and the forward guidance of the ECB, unsecured market rates remained close to the DFR in the shorter tenors of the money market curve, with activity concentrated mainly in the overnight tenor. In contrast to previous years, money market rates recently moved below the DFR, sometimes by a substantial margin.
The largest share of the unsecured market is made up by borrowing transactions with other financial corporations and foreign banks. Given the very abundant liquidity conditions provided by the Eurosystem through the asset purchase programme (APP), those institutions are seeking cash investment opportunities, including deposits with the euro area banking system with access to the Eurosystem’s deposit facility. Accordingly, MMSR banks most frequently engaged in borrowing activity. They mainly accepted deposits from other financial corporations whose headquarters are domiciled in the United Kingdom, Luxembourg, Germany and the Netherlands, as well as from foreign banks in the United States and Japan and international banks based in Poland. Transactions with non-euro area banks were often priced at rates below the DFR, as those entities do not have direct access to the facilities of the Eurosystem and euro area banks need to take into account the regulatory costs associated with the acceptance of callable deposits from financial institutions.
Interbank activity within the euro area represented just 15% of total activity in the wholesale unsecured money market. Interbank transactions within the euro area were still, on average, at or slightly above the DFR, with some exceptions for borrowing activity. Borrowing activity in the interbank market is very limited and deal prices below the DFR may possibly result from transactions in non-operational deposits. In contrast to retail deposits, non-operational deposits are considered to be volatile and are therefore subject to higher regulatory buffer requirements to cover their higher liquidity risk.
1.1 Volumes
Since the start of the financial crisis in 2008, trading volumes in the unsecured market have followed a declining trend (see Chart 2). Three factors could be identified as the main drivers of this continued decline in volume: (a) aversion to counterparty credit risk; (b) ample liquidity provided by the Eurosystem; and (c) the need to comply with new regulatory requirements coming from the Basel III regulatory framework. First, the financial crisis triggered doubts about the creditworthiness of borrowers, and since then most participants have adopted a prudent attitude towards counterparty credit risk, leading to rating differentiation among euro area countries. Second, the monetary policy response to the crisis by the Eurosystem included the provision of ample liquidity, which has resulted in a very high level of excess liquidity since the implementation of the APP in 2015. Third, in 2016 the Basel Committee on Banking Supervision introduced two new requirements to mitigate systemic liquidity risk: the net stable funding ratio (NSFR) and the liquidity coverage ratio (LCR). The NSFR limits banks’ reliance on short-term funding, while the LCR requires banks to hold a buffer of liquid assets sufficient to meet potential outflows of funds in a stressed environment. Regulation made deposit-taking activity very costly in regulatory terms, especially for cash callable or repayable within 30 days and placed in non-operational accounts.
Market shares of the daily average volume per quarter – unsecured, secured, FX swap and OIS segments
(EUR billions)
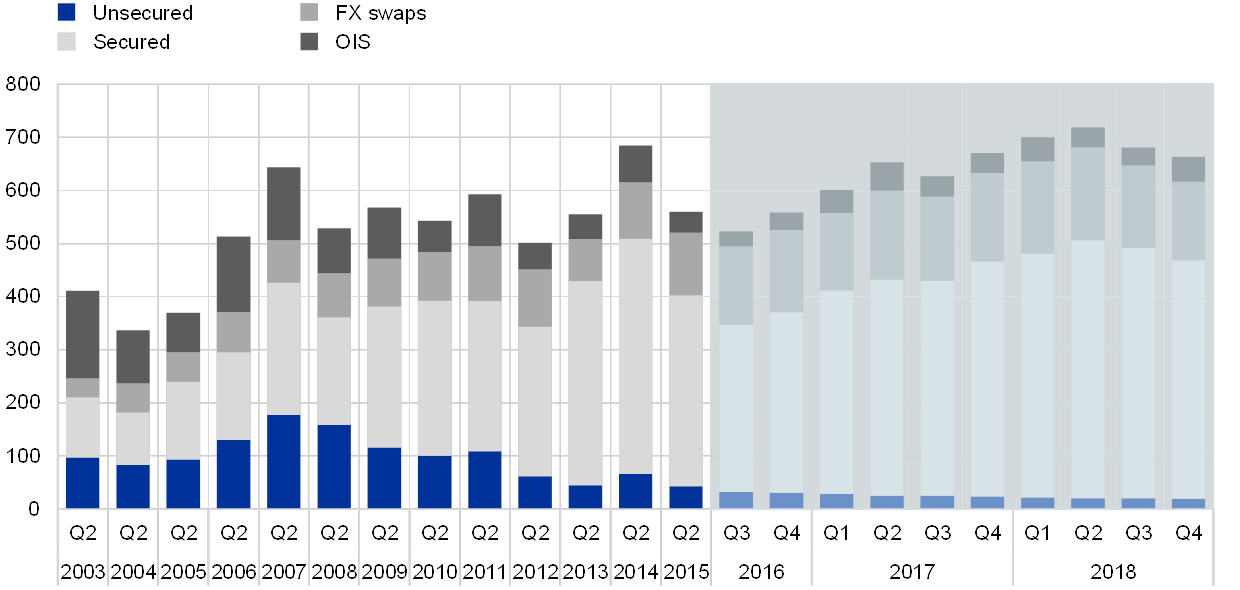
Source: ECB.Notes: Data are from the EMMS until 2015 and MMSR from mid-2016 onwards (indicated by a light blue background). An overlapping sample of 38 banks was used.
From the middle of 2016 to the end of 2018 the declining trend of activity in the unsecured market showed signs of stabilisation (see Chart 3). While part of the activity in the unsecured segment shifted to the secured segment between 2008 and the end of 2015, since then the downward trend in the unsecured segment has moderated.
Turnover in unsecured and secured segments
(index: Q2 2003 = 100)
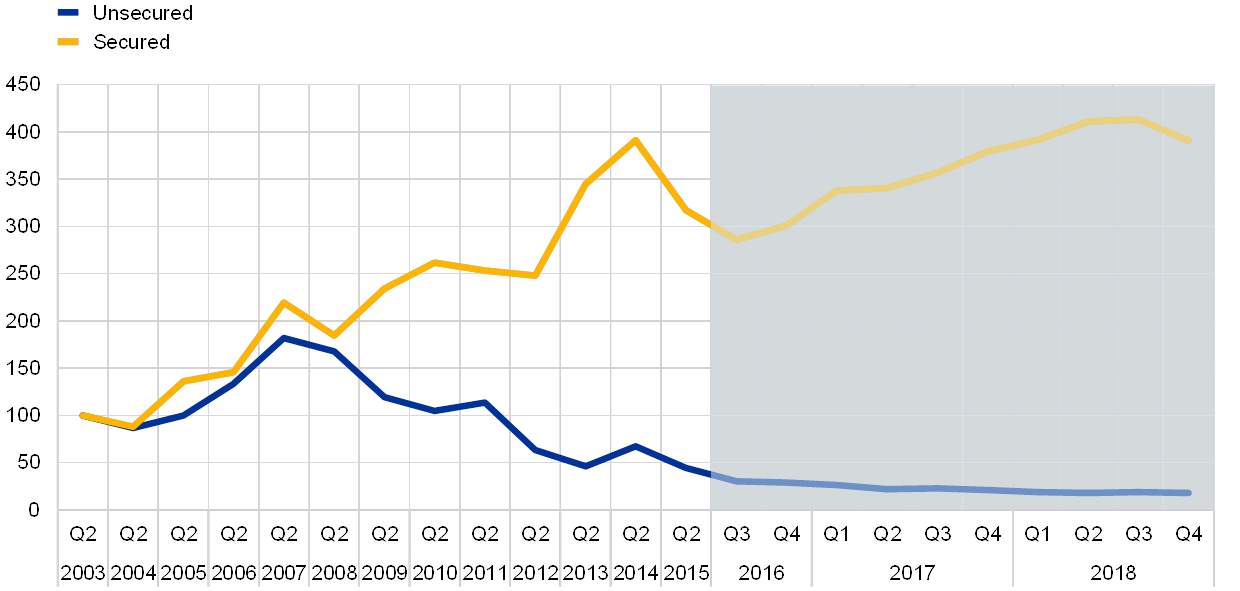
Source: ECB.Notes: Data are from the EMMS until 2015 and MMSR from mid-2016 onwards (indicated by a light blue background). An overlapping sample of 38 banks was used.
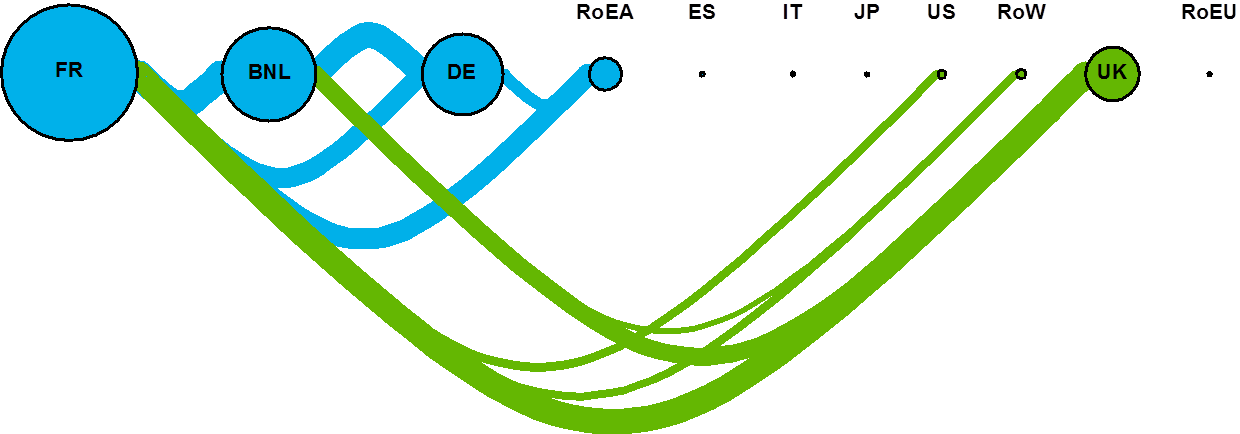
A significant part of the remaining activity in the unsecured market seems to result from the need to channel excess liquidity to counterparties with access to the Eurosystem’s standing facilities (see Chart 4). Since the implementation of the APP, the liquidity surplus has increased to about €1.8 trillion. The euro area liquidity surplus is mainly concentrated in France, the Netherlands, Germany and Belgium. The uneven distribution, which is reflected in the TARGET2 balances in the Eurosystem, is mainly related to the settlement of outright APP purchases from non-euro area residents or purchases of non-euro-denominated assets by residents when the transactions are settled via depository banks based in the middle of the euro area. The liquidity received by entities is returned to the euro area banking system partly via unsecured transactions in the money market, as only banks located in the euro area can access the Eurosystem’s deposit facility. At the end of each day, euro area banks redeposit these funds in their current accounts with national central banks (NCBs) or at the Eurosystem’s deposit facility.
Total overnight flows between jurisdictions
(connections: flows; nodes: total volumes)
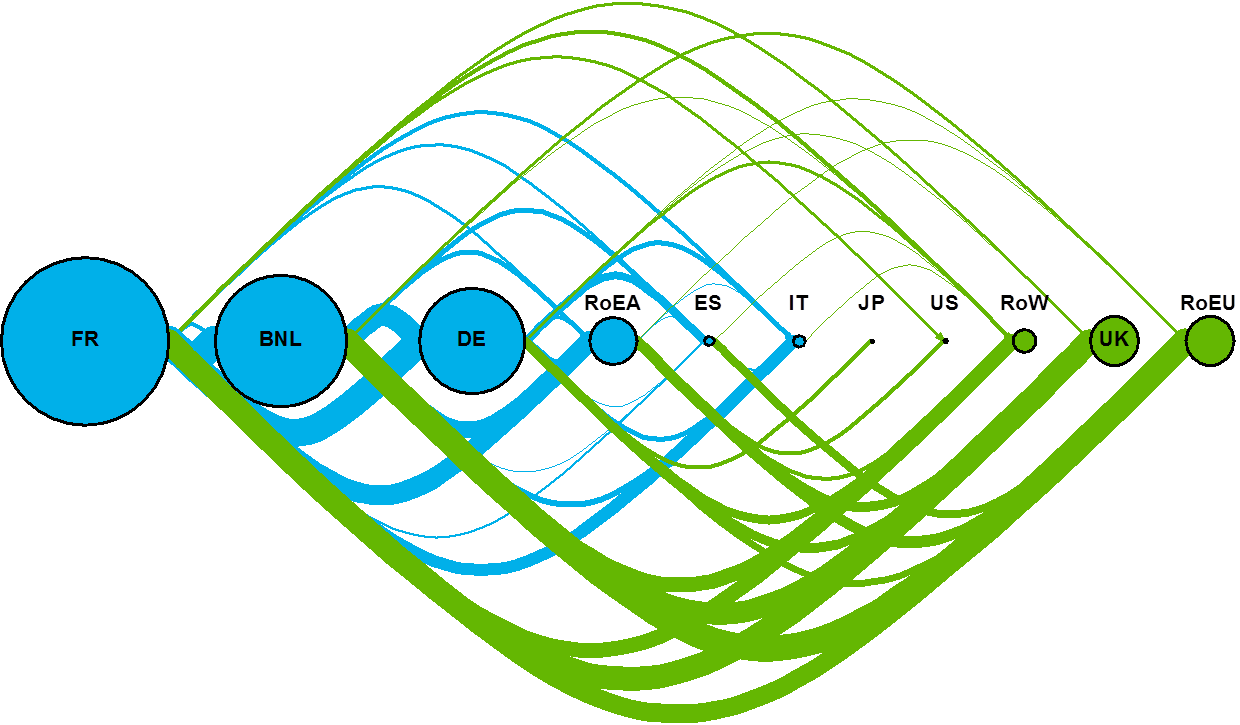
Sources: ECB (MMSR) and ECB calculations.Notes: The chart shows borrowing and lending transactions (both wholesale total and interbank) with overnight maturity. The connections indicate flows (upper flows: left to right; lower flows: right to left), and the thickness reflects the relative volumes. The node size reflects the total volume (inflows plus outflows) for each country or group of countries. The node colour indicates whether the country or group of countries is in the euro area (blue) or not (green). Only data points compliant with the applicable statistical confidentiality rules are displayed.
1.2 Prices
In a context of excess liquidity, the spread between the euro overnight index average (EONIA) and the DFR has generally narrowed (see Chart 5). Between the start of the crisis in 2007 and the middle of 2016 unsecured rates remained anchored within the standing facility corridor. When central bank reserves are in limited supply – i.e. they are just sufficient to satisfy the demand for banknotes and other autonomous factors – access to central bank facilities by credit institutions has in the past ensured that very short-term interest rates were closely aligned with the interest rate at which the central bank provides reserves. This relationship did not fundamentally change with the emergence of the financial crisis. However, when the ECB granted unlimited liquidity to euro area banks against sound collateral, and when it subsequently started purchasing assets, the environment of excess reserves caused unsecured money market rates to converge towards the DFR. Whenever there is a large amount of excess liquidity, the spread between the EONIA and the DFR narrows. This is because the DFR is the rate that determines the marginal cost of interbank lending when there is excess supply of central bank reserves. As a result, the Eurosystem policy framework was able to provide a hard floor for the EONIA.
Key ECB interest rates, market reference rates and excess liquidity
(left-hand scale: percentages; right-hand scale: EUR billions)

Source: ECB.Notes: MLF – marginal lending facility; MRO – main refinancing operations; Pre-€STR – preliminary version of the euro short-term rate (€STR). The period under review is indicated by a light blue background.
Also, from the middle of 2016 a significant part of unsecured transactions were conducted below the DFR, as a significant share of financial institutions with a liquidity surplus did not have access to the Eurosystem’s standing facilities. TARGET balance data show that the APP gave rise to substantial cross-border flows in the money market. This is because many sellers of the securities purchased under the APP are either non-banks – typically, asset managers, pension funds, insurance companies or mutual funds – or banks located outside the euro area.[1] While the DFR provides an effective floor for counterparties with access to the facility, neither non-banks nor banks located outside the euro area have such access and must therefore look elsewhere for safe and liquid investments. Although euro area banks are willing to accept cash from the latter and deposit it at the central bank, this service is not provided free of charge, as banks’ balance sheet capacity has become costly because of regulatory requirements. In particular, banks accepting short-term deposits are required to monitor the impact on their LCR, as reliance on short-term deposits creates buffer requirements for additional liquid assets.[2] Hence, banks are only willing to accept liquidity below 30 days at rates below the DFR to compensate for the higher regulatory costs.
Nonetheless, the DFR generally remained a floor for interbank transactions within the euro area, as all euro area banks have access to the Eurosystem’s standing facilities. Transaction volumes between euro area banks are very limited. There are two main reasons for this: (i) in a context of excess liquidity and easy access to central bank funds, there is little demand for funding via market borrowing, as banks’ liquidity needs are already covered; and (ii) given their general access to the deposit facility, there is no economic rationale for transferring deposits between euro area banks with the sole purpose of accessing the deposit facility. As a result, prices on the majority of interbank transactions within the euro area are on average at or above the DFR. The weighted average interest rate on the total overnight activity in the period from June 2016 to December 2018 was -0.34%.
However, around 30% of these interbank transactions, almost entirely on the borrowing side, are priced below the DFR (see Charts 6 and 7). In an environment of excess liquidity, banks’ cash needs are generally low. However, in a banking system which also has many small credit institutions there is still room for liquidity redistribution activities, with larger institutions providing lending services for liquidity balancing purposes. Hence, while the number of transactions in the interbank market is limited, lending by MMSR banks is still larger than their borrowing. Nearly all lending activity between euro area banks took place at rates above the DFR, albeit with increasing volatility towards the second half of 2018 in a context of very low daily turnover of about €1 billion. Nevertheless, when looking at the borrowing side, it is worth noting that, although most of the interbank borrowing activity in 2016 was priced above the DFR, this feature moderated in 2017 and reversed in 2018, as around 80% of the borrowing activity took place below the DFR in a large part of 2018. According to anecdotal evidence from market participants, this borrowing activity below the DFR in the interbank market could be related to non-operational deposits received from managers executing client orders. Non-operational deposits have a higher LCR cost for the bank accepting the liquidity, as they are less sticky and more risk-sensitive. Hence, banks are only ready to accept them at rates that compensate for the regulatory costs associated with such deposits.
Interbank overnight lending transactions within the euro area
(percentages)
Source: ECB (MMSR).Notes: The chart shows the volume-weighted average rate for lending transactions with overnight maturity. The chart considers only deposit-taking corporations located in the euro area taking fixed rate deposits.
Interbank overnight borrowing transactions within the euro area
(left-hand scale: percentages; right-hand scale: percentage shares)
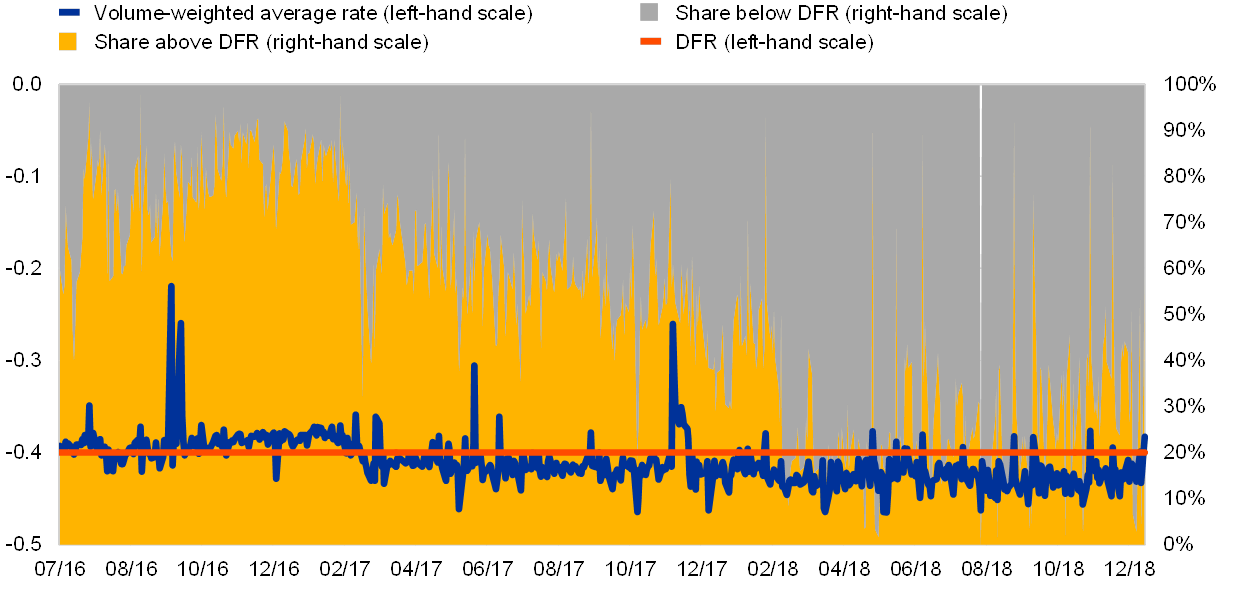
Source: ECB (MMSR).Notes: The chart shows the volume-weighted average rate for borrowing transactions with overnight maturity. The chart considers only deposit-taking corporations located in the euro area taking fixed rate deposits. Trades between credit institutions and central counterparties (CCPs) and all trades with a positive rate reported by other credit institutions are excluded from the computation of the rate and the volume share to ensure data representativeness.
Transactions with NFCs are still priced well above the DFR (see Chart 8). Transactions with NFCs have always been executed at higher rates. While prices of transactions with NFCs have significantly declined in parallel with the growing excess liquidity, they continue to be priced well above the DFR.
Total transaction prices by counterparty sector
(left-hand scale: percentages; right-hand scale: EUR billions)
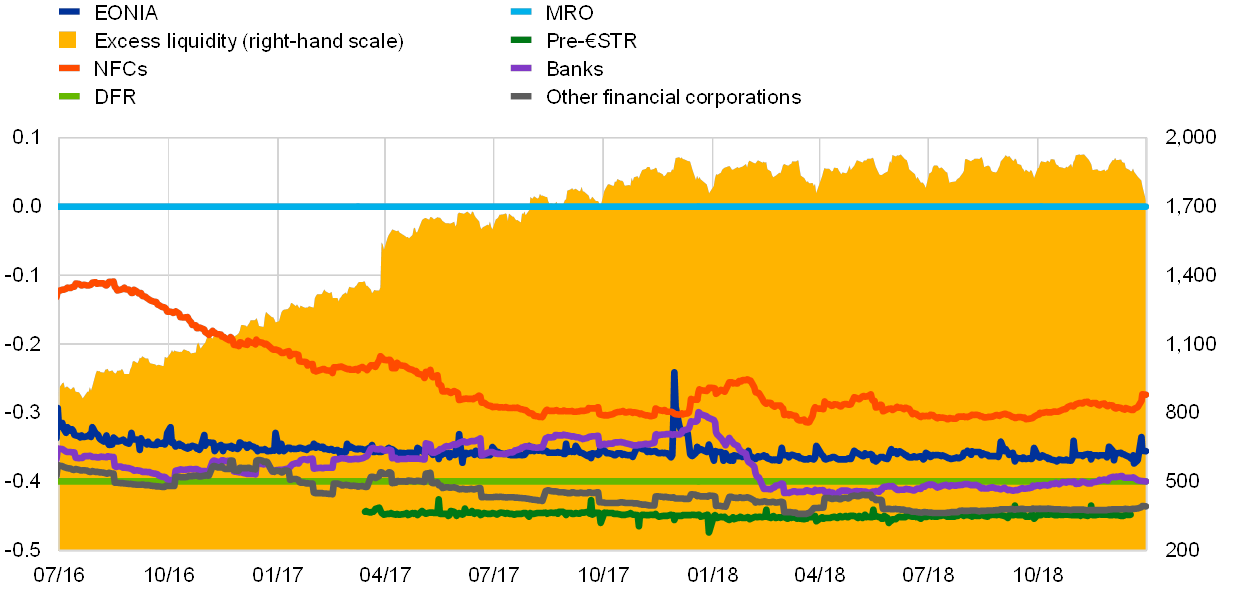
Source: ECB (MMSR).Note: Lending (to banks) and borrowing (from banks, NFCs and other financial corporations) transactions are computed using a 45-day moving average method.
1.3 Counterparties
While the interbank share of activity has been declining and represents just 15% of total activity in the unsecured money market, the share of transactions with other financial corporations has been growing steadily, reaching around 40% of the total in 2018 (see Chart 9). Other relevant counterparties include NFCs, which represent around 20% of total transactions, and, to a lesser extent, central banks, with a 16% share connected to the management of their euro reserves. Transactions with governments account for less than 10% of the activity in the unsecured segment.
Activity in the unsecured market by institutional sector
(EUR billions)
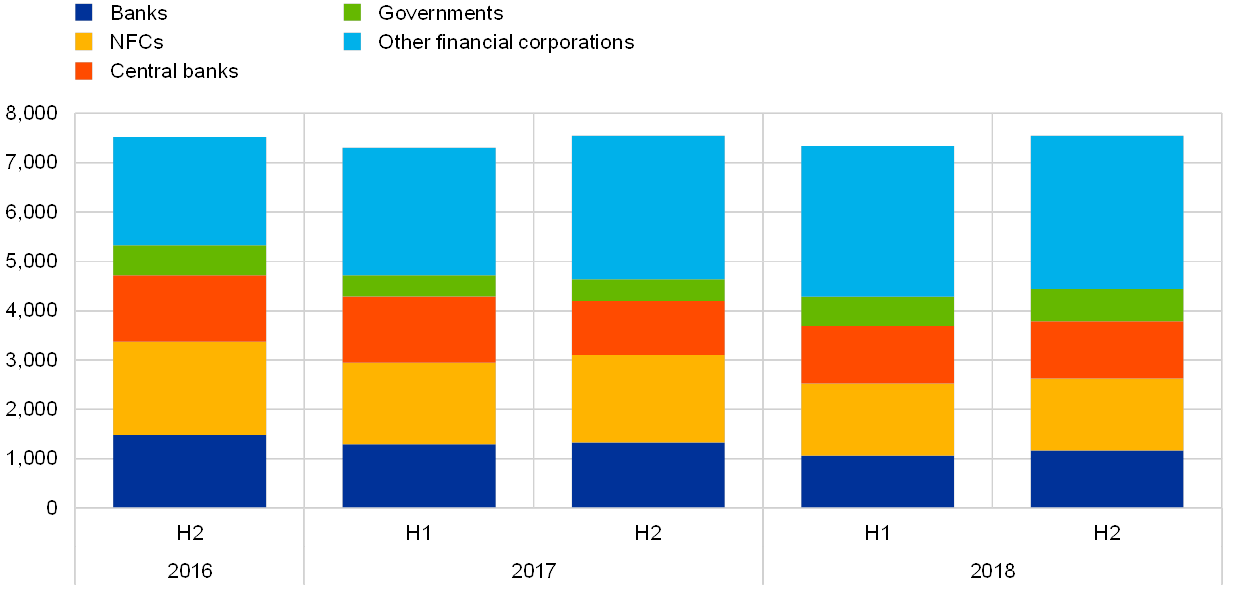
Source: ECB (MMSR).
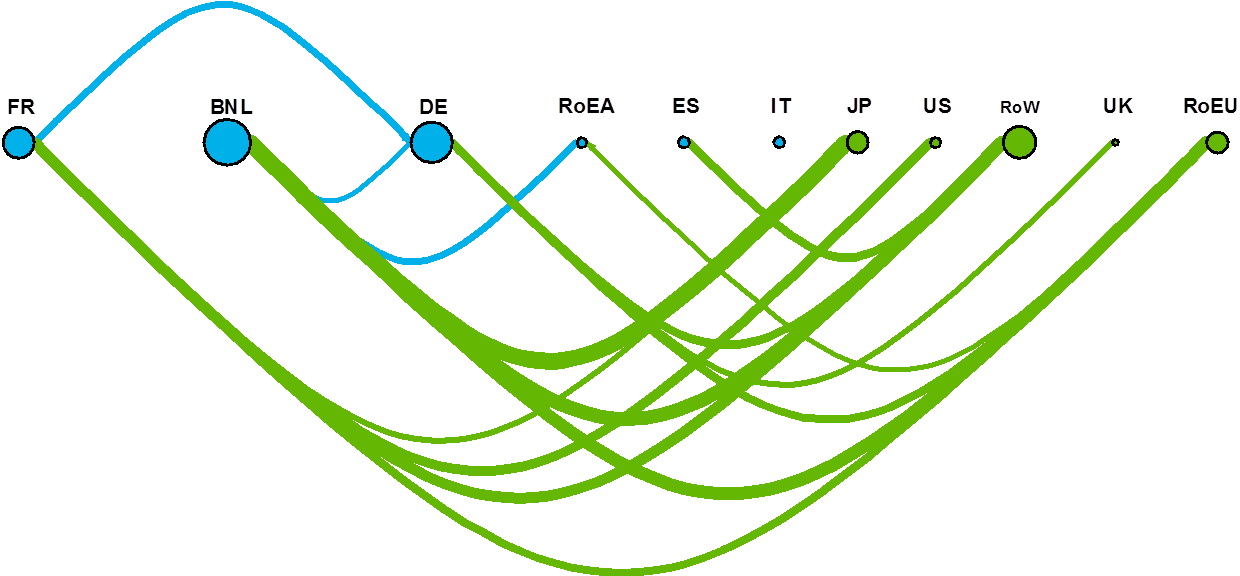
Over time, excess liquidity has tended to accumulate in specific banks in five euro area countries (see Charts 10, 11 and 12). The APP did not lead to a proportional increase in excess liquidity in the jurisdictions of the securities issuers. While the geographical distribution of purchases closely reflected NCBs’ shares in the ECB’s capital key, more than 50% of purchases occurred with counterparties belonging to banking groups whose head institution is located outside the euro area. In addition, within the euro area the management of euro-denominated liquidity is concentrated in specific locations. For example, custodians and clearing institutions that process Eurosystem asset purchases are typically located in Germany, France or Belgium. The APP liquidity placed in cash accounts with these custodians and clearing institutions may circulate further, as the owners also use it for other purposes, while unused balances are likely to be swept into TARGET2 accounts at the end of the business day.[3] As a result, excess liquidity has tended to accumulate in specific euro area countries and banks over time, seemingly independently of how the liquidity is provided by the Eurosystem. Unsecured inflows into the euro area come either from entities operating in financial centres in Luxembourg, Germany, the United Kingdom and Ireland or from foreign banks in the United States and Japan and international banks based in Poland. The main recipients of the liquidity are MMSR reporting banks in France, Benelux and Germany.
Location of other financial corporations depositing liquidity with euro area banks
(connections: flows; nodes: total volumes)
Source: ECB (MMSR) and ECB calculations.Notes: The chart shows flows between euro area banks and other financial corporations. The flows reflect borrowing and lending transactions with overnight maturity. The connections indicate flows (upper flows: left to right; lower flows: right to left), and the thickness reflects the relative volumes (only shown if over €50 billion). The node size reflects the total volume (inflows plus outflows) for each country or group of countries. The node colour indicates whether the country or group of countries is in the euro area (blue) or not (green). Only data points compliant with the applicable statistical confidentiality rules are displayed.
Location of NFCs sending liquidity to euro area banks
(connections: flows; nodes: total volumes)
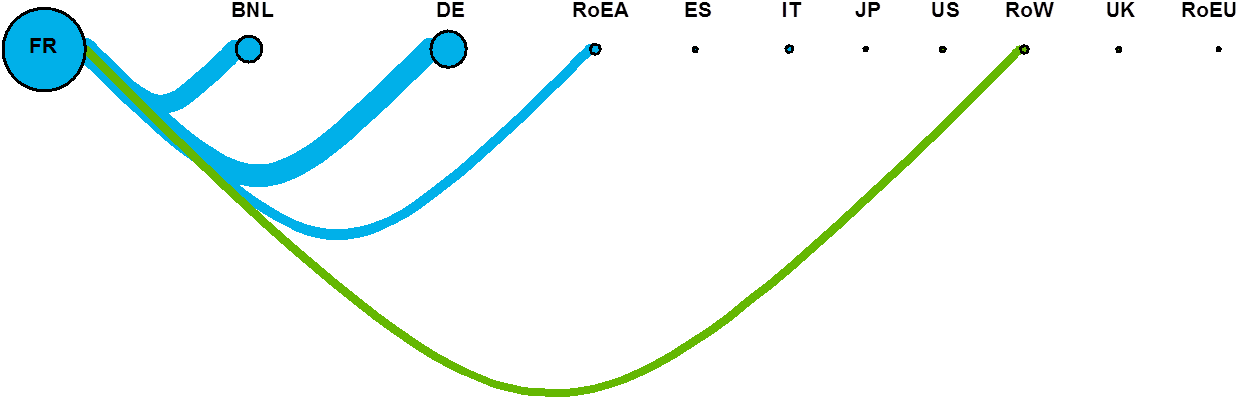
Source: ECB (MMSR) and ECB calculations.Notes: The chart shows sectoral flows between euro area banks and NFCs. The flows reflect borrowing and lending transactions with overnight maturity. The connections indicate flows (upper flows: left to right; lower flows: right to left), and the thickness reflects the relative volumes (only shown if over €50 billion). The node size reflects the total volume (inflows plus outflows) for each country or group of countries. The node colour indicates whether the country or group of countries is in the euro area (blue) or not (green). Only data points compliant with the applicable statistical confidentiality rules are displayed.
Location of banks sending liquidity to euro area banks
(connections: flows; nodes: total volumes)
Source: ECB (MMSR) and ECB calculations.Notes: The chart shows interbank flows. The flows reflect borrowing and lending transactions with overnight maturity. The connections indicate flows (upper flows: left to right; lower flows: right to left), and the thickness reflects the relative volumes (only shown if over €50 billion). The node size reflects the total volume (inflows plus outflows) for each country or group of countries. The node colour indicates whether the country or group of countries is in the euro area (blue) or not (green). Only data points compliant with the applicable statistical confidentiality rules are displayed.
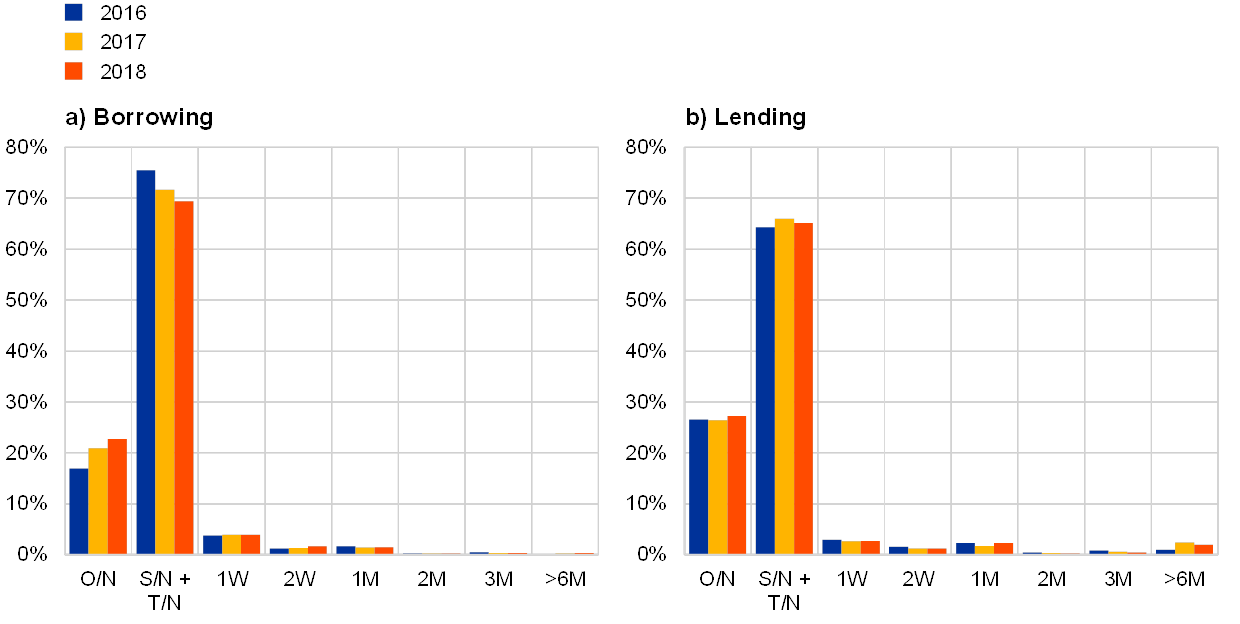
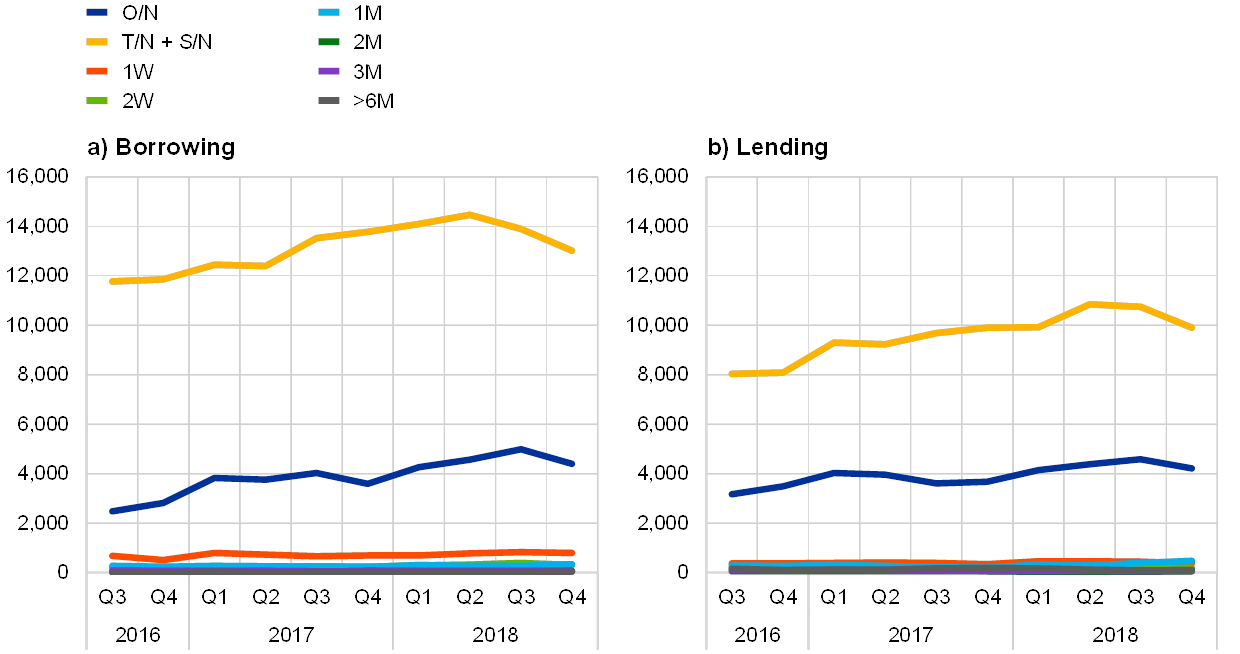
1.4 Maturities
A majority of unsecured transactions are conducted overnight (see Chart 13). On the borrowing side, between July 2016 and December 2018 the overnight tenor represented more than 50% of total turnover. These are not only deposits, but also call account/call money transactions representing money loaned by banks that must be repaid on demand. Overnight call account transactions represented 31% of total turnover. Excluding call accounts, the overnight tenor accounts for more than 72% of the total borrowing volume. On the lending side, turnover is generally smaller and transactions are even more concentrated in shorter maturities. Of the total lending turnover, the overnight maturity bucket accounted for 74%, of which around three quarters was call accounts.
Volume per maturity bucket
(EUR billions)
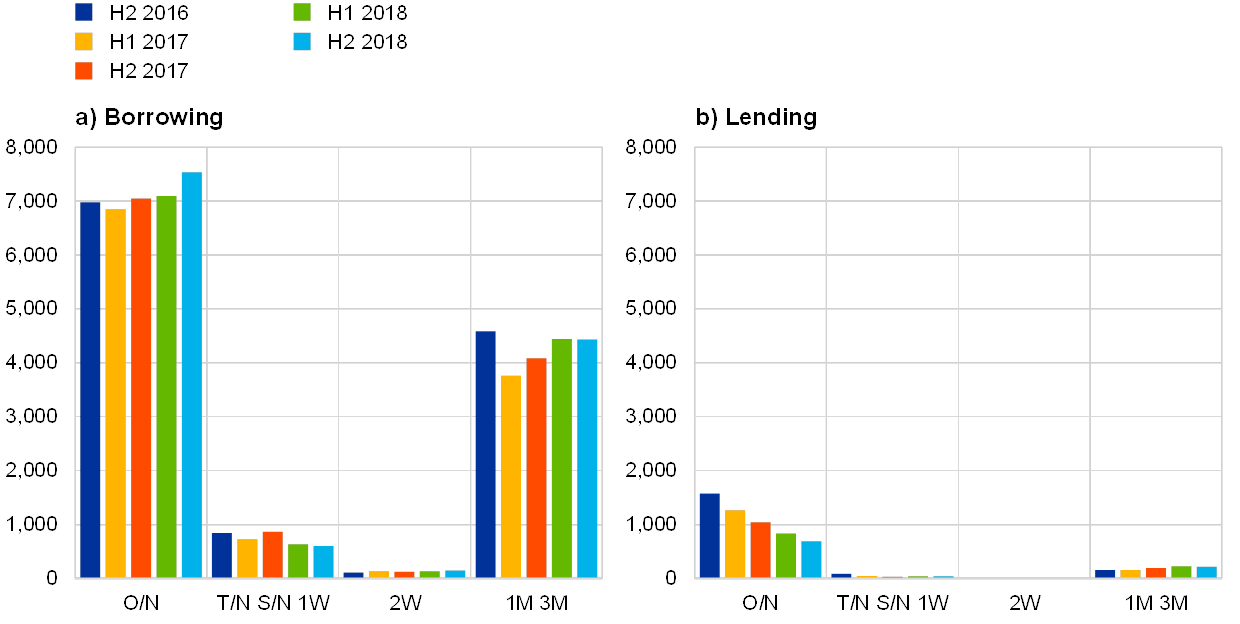
Source: ECB (MMSR).Note: O/N – overnight; T/N – tomorrow/next; S/N – spot/next.
From the middle of 2016 to the end of 2018 the unsecured yield curve moved downwards (see Charts 14 and 15). For most maturity buckets, rates declined over the period under review due to the very accommodative ECB monetary policy stance, which led to both an increase in excess liquidity and an easing of banks’ funding conditions. This was also the case for the overnight market, which is where most of the volume is concentrated. The unsecured yield curve has a classical positive sloping shape, although the rates in the longer maturity buckets do not have much informational value, as their volume is rather low. For interbank transactions, only unsecured rates for less than two days were priced below the DFR, while transactions with other financial corporations were priced below the DFR for transactions of up to one month. Prices for transactions with NFCs usually stood above the DFR for all maturities. The large presence of NFCs in the one-week maturity bucket has prevented this bucket following the same general downward trend observed in other maturity buckets since the middle of 2016.
Unsecured yield curve and volume evolution
(left-hand scale: yield, percentages; right-hand scale: volume, EUR billions)

Source: ECB (MMSR).Note: The lines show yields (left-hand scale) and the bars show volumes (right-hand scale).
Unsecured yield curve and volume per counterparty sector in the second half of 2018
(left-hand scale: yield, percentages; right-hand scale: volume, EUR billions)
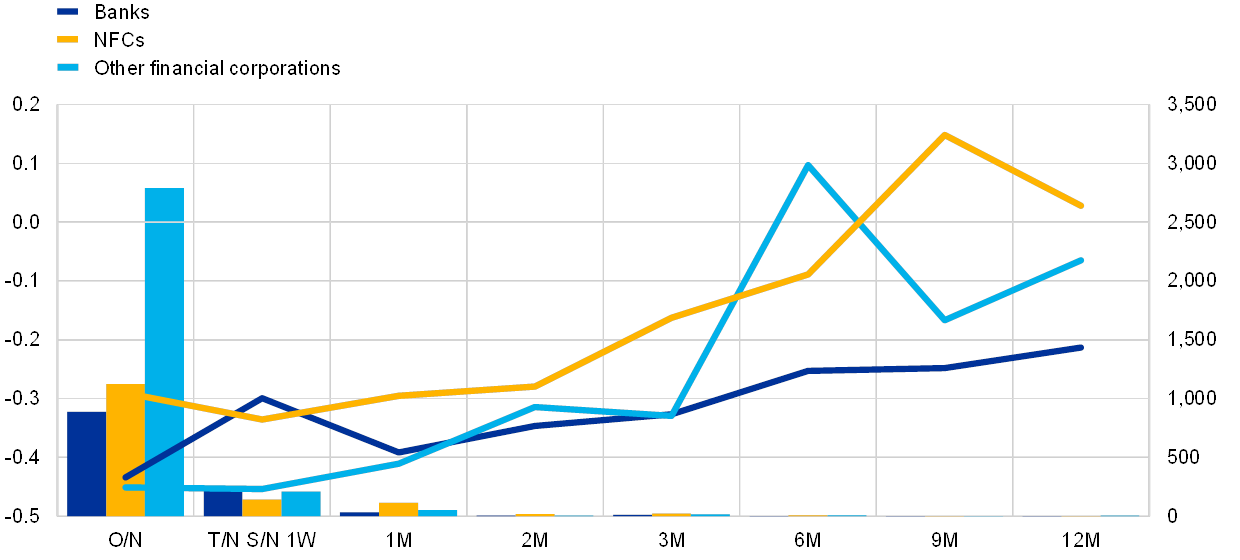
Source: ECB (MMSR).Note: The lines show yields (left-hand scale) and the bars show volumes (right-hand scale).
2 The secured segment
The secured segment is the largest segment of the euro money market, representing two-thirds of total money market turnover.
Overall, secured transactions have been on an expanding path since the financial crisis, driven by improved risk management and regulatory requirements incentivising participation in the secured market. In the current market environment of excess liquidity, the repo market has largely become a platform for collateral exchange rather than cash management, reinforced by regulatory measures under which high-quality and liquid securities are required for regulatory purposes and for covering margin calls at CCPs. At reporting dates, particularly at year-ends, turnover decreases, as banks usually aim to have a smaller balance sheet that eases the fulfilment of regulatory ratios and reduces contributions to banking levies.
Around 85% of the securities posted as collateral were government bonds, mainly comprising sovereign bonds issued in six countries: Germany, Italy, France, Spain, Belgium and the Netherlands. While government bonds from Germany and France are used by euro area banks in all locations, government bonds from other euro area jurisdictions are mostly used in their home countries.
Interest rates were typically below the DFR, sometimes by a substantial margin, depending on the collateral involved in the transaction. A strong divergence in prices is largely explained by differences in the sovereign ratings of the government bonds.
A significant part of transactions in the secured segment are repurchase agreements (repos and reverse repos) cleared through CCPs, reaching about 70% of total turnover by the end of 2018. In particular, CCPs facilitate transactions across borders. Repo transactions also exhibited price segmentation depending on the type of counterparty, reflecting different trading motives. Interbank overnight repo rates were on average at or slightly above the DFR, while transactions with non-banks, including CCPs, were always priced at rates below the DFR.
The secured market is dominated by transactions with very short maturities. Most trading contracts were concluded with a maturity of one day (overnight, tomorrow/next and spot/next). This is because open repo transactions have to be reported daily for as long as they continue to be rolled over. Transactions with a maturity of one week are the most numerous in the spectrum of longer maturities.
2.1 Volumes
The secured segment is the largest segment of the euro money market, representing two-thirds of total money market turnover, and is an important contributor to the overall resilience and efficiency of financial markets (see Chart 16). Several factors have been affecting volumes in the secured segment since the financial crisis: first and most important, the demand for high-quality liquid securities for regulatory purposes, for covering margin calls at CCPs and as a protection against counterparty risk has increased, while the Eurosystem’s non-standard measures have effectively reduced the supply of collateral available to the market and boosted the supply of excess liquidity.
Market share of the daily average volume per quarter – secured segment
(EUR billions)
Source: ECB.Notes: Data are from the EMMS until 2015 and MMSR from mid-2016 onwards (indicated by a light blue background). An overlapping sample of 38 banks was used.
Volumes have increased significantly since the third quarter of 2016, as the repo market has largely become a platform for collateral exchange. Excess liquidity and regulation have led to a change in repo usage, which is now driven by collateral management rather than cash management. This can be seen from the fact that specific collateral volumes are much higher than general collateral volumes. This demand for securities is largely fuelled by the requirements of the European Market Infrastructure Regulation (EMIR)[4], the need for collateral to cover margin calls in order to trade over-the-counter (OTC) interest rate derivatives via CCPs, the need to cover short investors, and the supporting role of securities financing transactions for fixed income desks. Regulation, and in particular the leverage ratio, is also behind the increasing share of transactions conducted with CCPs, which allows banks to efficiently net the impact of repos on their exposure against their reverse repo activity, thereby avoiding an expansion of their balance sheet. For MMSR reporting banks, cash borrowing against securities (repos) and cash lending against securities (reverse repos) have risen by 32% and 30% respectively in the last two and a half years, excluding year-ends effects.[5]
During the entire period, MMSR banks were more active in borrowing transactions than in lending transactions (see Chart 17). The overall share of repo borrowing transactions remained higher than reverse repo lending transactions for MMSR banks (55% compared to 45%, respectively). A significant part of the borrowing resulted from cross-border and international transactions (i.e. where excess liquidity held by non-banks is channelled to MMSR banks with access to the Eurosystem’s standing facilities), while lending activity is dominated by domestic transactions. The dominance of borrowing transactions may be related to the fact that the 50 MMSR reporting banks tend to be larger and more internationally connected than other euro area banks.
At year-ends turnover fell significantly, as banks usually aim to have a smaller balance sheet at reporting dates (see Chart 17). A smaller balance sheet facilitates the fulfilment of regulatory ratios[6] and reduces contributions to banking levies. Banks therefore planned their repo positions long before the year-end, and conducted repos with maturities longer than usual. According to market participants, this resulted in a slightly softer repo market squeeze at the end of 2017 than at the end of 2016. Other seasonal effects with significantly lower turnover can be also observed in April 2017 and 2018 (Easter), July 2017 (summer) and December 2017. Total turnover in December 2018 was 25% lower than the yearly average.
Breakdown of secured market turnover by month
(EUR trillions)
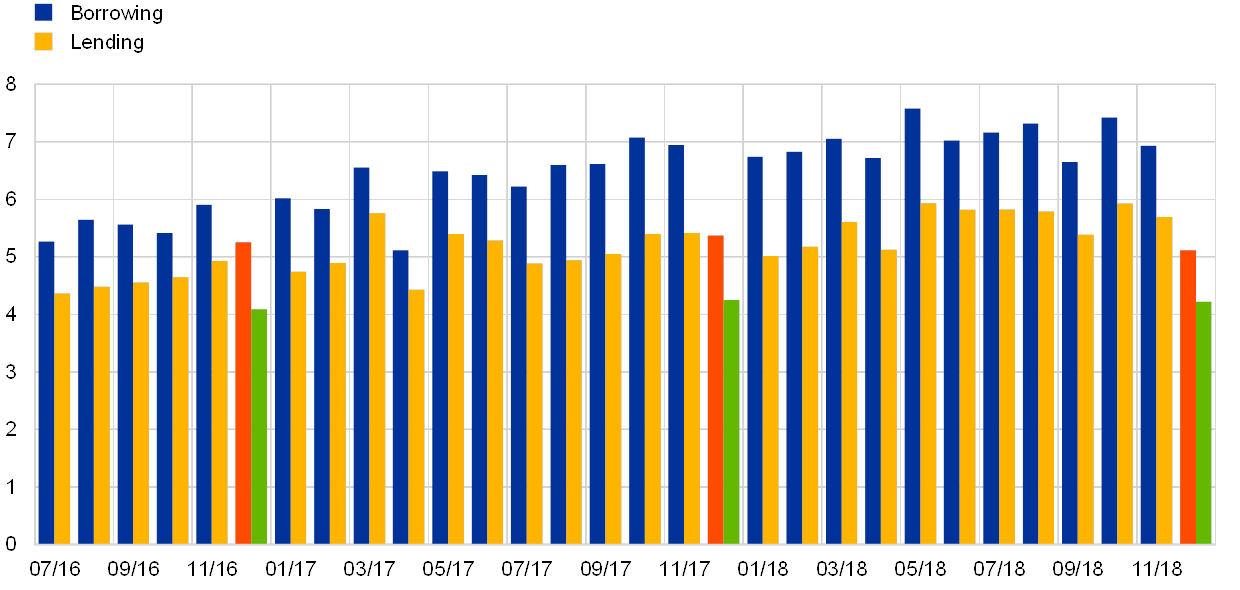
Source: ECB (MMSR).Note: The orange and green bars represent the month of December on the borrowing and lending sides respectively.
2.2 Collateral
Collateral used in secured transactions was mainly issued in Germany, Italy, France, Spain, Belgium and the Netherlands (see Chart 18). For borrowing transactions, these six countries accounted on average for 84% of the collateral used. The share of these six countries in the total amount of collateral has steadily increased from slightly below 80% in the summer of 2016 to more than 85% since the middle of 2017. This was mainly due to an increase in the use of French and Italian collateral, while the use of collateral from the other countries remained more or less constant. For lending transactions, the share of collateral from the six largest euro area countries was even higher, 88% on average. As in borrowing transactions, German collateral is also the most used in lending transactions. However, in the case of lending, the share of Italian collateral is closer to the German share. In contrast to borrowing, in lending the combined share of these six countries was stable at around 88% throughout the reporting period, with the use of French collateral increasing and the use of Italian and Spanish collateral decreasing.
Collateral used in secured transactions by issuer location
(percentages)
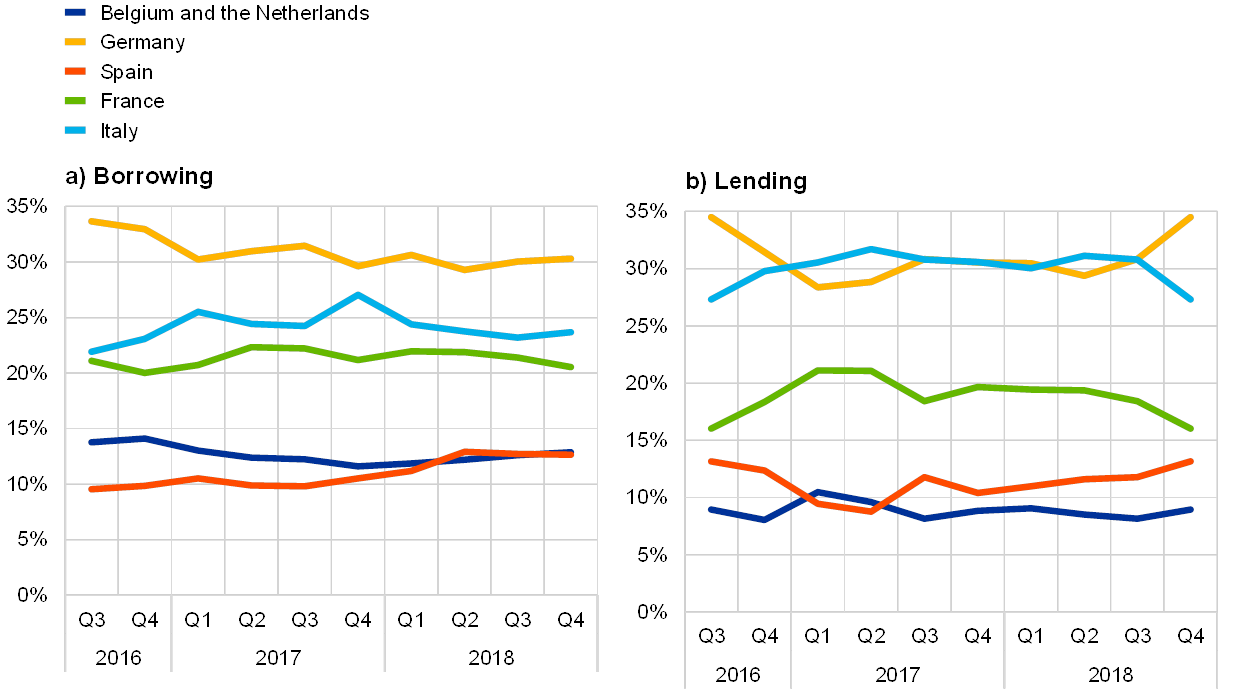
Source: ECB (MMSR).Note: The chart shows percentages of the total for the countries shown only.
As a result, collateral used by MMSR banks is often non-domestic (see Chart 19).The country distribution of the share of domestic collateral in the euro area is centred around a median of 49%, and ranges between a 25th percentile of 22% and 75th percentile of 63%. In France and Germany, the use of domestic collateral is about 30% and 50% respectively.
Origin of collateral by location of reporting agent
(percentages)
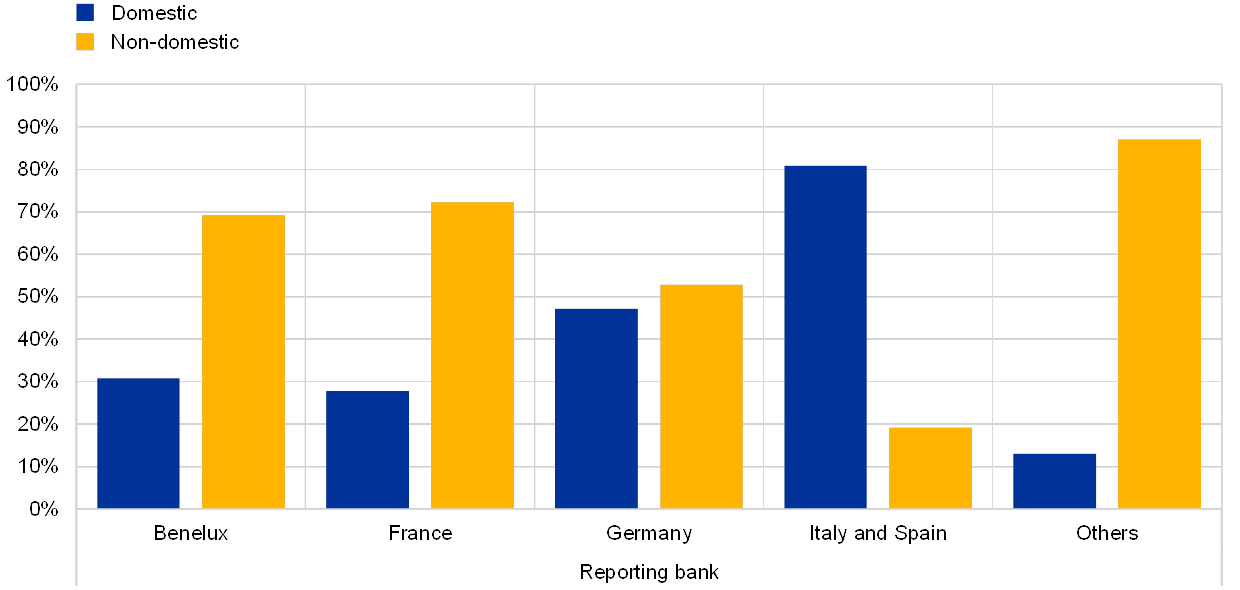
Source: ECB (MMSR).
The use of private collateral has become marginal (see Chart 20). The share of collateral issued by financial corporations decreased from 17% to 13%. One explanation could be that the APP has provided significant liquidity to financial corporations, reducing their need to tap the market for funding.
Collateral used in secured transactions by issuer sector
(percentages)
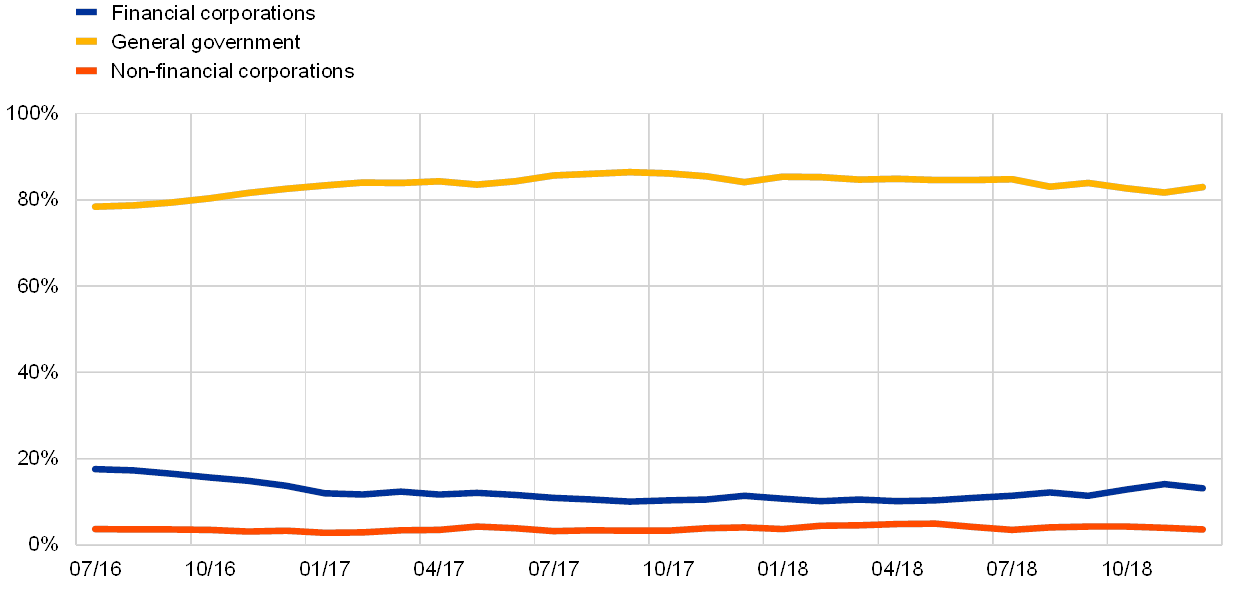
Source: ECB (MMSR).
2.3 Prices
Prices moved below the DFR (see Chart 21). The evolution of prices in the last two and a half years highlights how the repo market has largely become a platform for collateral. Excess liquidity and regulation have led to a change in repo usage, which is now driven by collateral management rather than cash management. For many securities the demand has become so strong (against a backdrop of more limited supply) that counterparties seeking that security agree on a repo rate that is less favourable than the central bank’s deposit rate.
Short-term repo rate and excess liquidity conditions
(left-hand scale: percentages; right-hand scale: EUR billions)
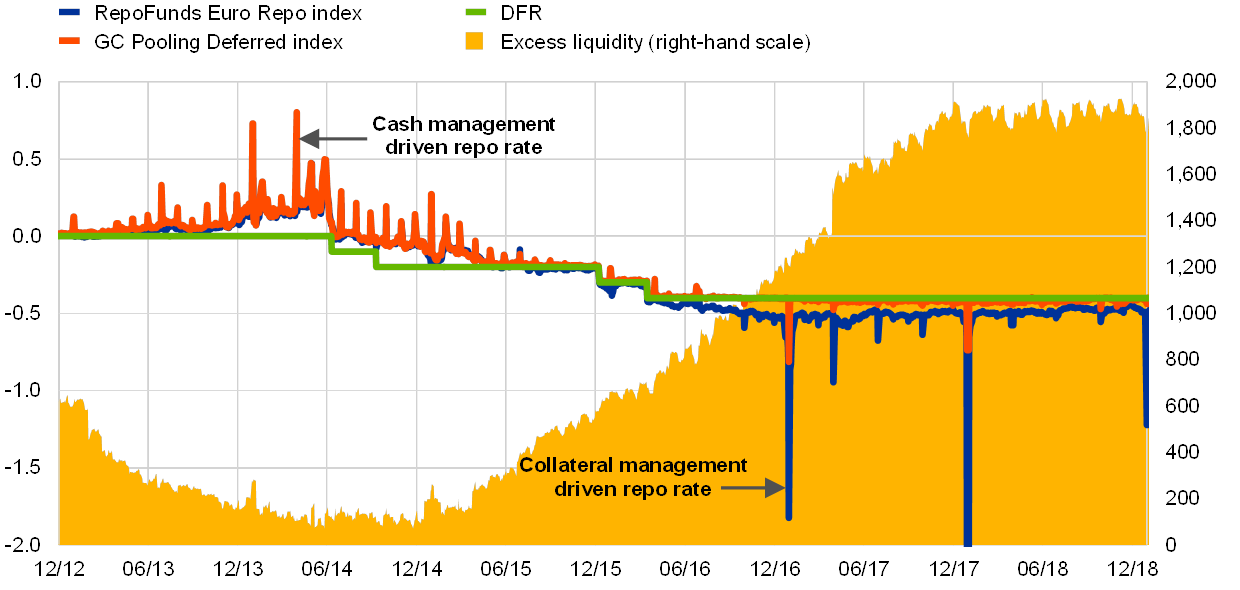
Sources: BrokerTec, MTS, Bloomberg and ECB calculations.
Prices exhibited segmentation by collateral issuer, especially for the highest quality and most liquid assets (see Chart 22). In the overnight segment, repo rates backed by German and Dutch bonds generally traded below repo rates based on collateral from the other four main countries, based on rating and the market perception of the quality of the respective collateral. Between regulatory reporting dates and without differentiating between general collateral (GC) and specific repo rates, the average transaction prices varied between -0.76% for borrowing against German government bonds and -0.48% for borrowing against Italian or Spanish sovereign bonds in the overnight, tomorrow/next and spot/next maturity buckets. The price of German sovereign collateral is fuelled by the strong demand for high-quality liquid assets (HQLA) and the impact of the APP on collateral supply.
Weighted average one-day (overnight, spot/next, tomorrow/next) borrowing rates by location of collateral issuer
(percentages)

Source: ECB (MMSR).
While at reporting dates price divergence is exacerbated, the year-end effect was less pronounced in December 2018 than in December 2016 or December 2017. Close to the year-end, repo rates on the securities with higher ratings dip further down to levels significantly below the DFR. When the overnight bucket is analysed in isolation on the basis of daily rates, the year-end effect is very prominent, but some quarter-end effect can also be seen. Regulation led to increased demand for specific bonds and consequently increased the share of higher priced bonds that were trading, especially ahead of reporting dates. Moreover, banks face constraints on engaging in activities that expand the balance sheet towards the year-end, as a smaller balance sheet facilitates the fulfilment of regulatory ratios and reduces contributions to banking levies. In December 2016, in order to support the smooth implementation of the public sector purchase programme (PSPP) as well as the liquidity and functioning of the euro area repo market, the Eurosystem introduced the possibility of borrowing securities against cash collateral. This technical amendment was one of the contributing factors in the subsequent improvement in repo market conditions. In 2018, tensions in the repo market ahead of quarter-ends and futures delivery dates were generally lower.
Prices also exhibited segmentation on the basis of trading counterparties (see Chart 23). The chart shows a breakdown of rates for repo transactions by counterparty type, distinguishing between interbank activity, financial corporations and CCPs. Interbank overnight repo rates were just below the DFR, while transactions with non-banks were always priced at rates well below the DFR.
Prices by institutional sector (all maturity buckets)
(percentages)
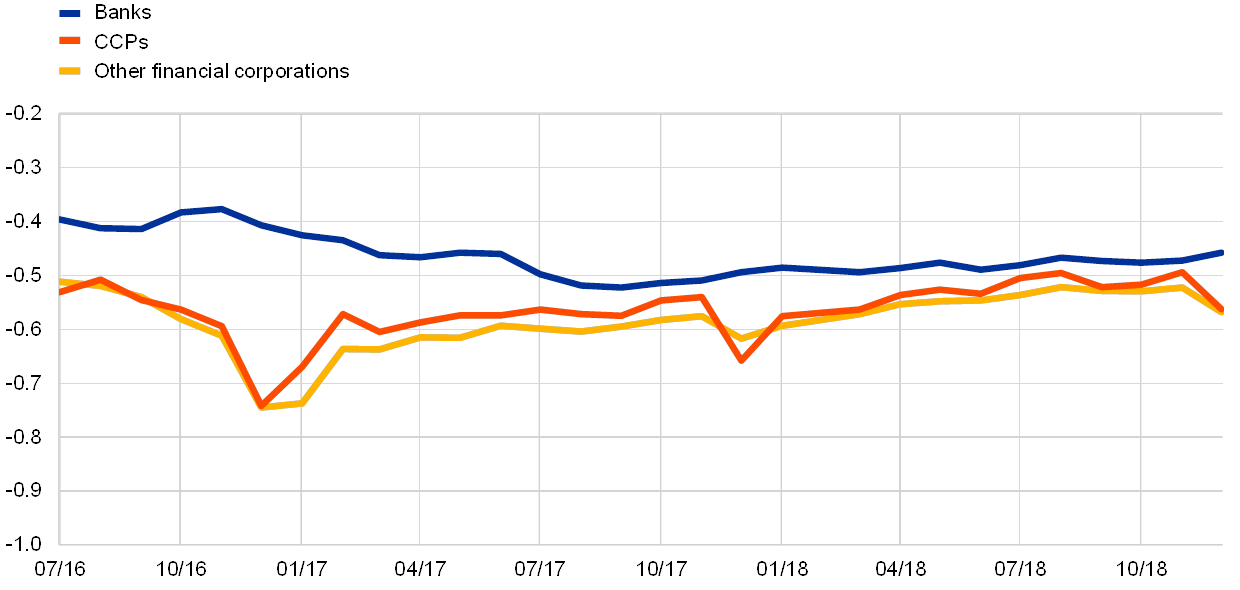
Source: ECB (MMSR).Note: The price per institutional sector is computed as a weighted average.
2.4 Counterparties
In the secured segment, CCPs are the main counterparties of MMSR reporting agents (see Chart 24). CCPs account for more than two-thirds of the turnover, with the remainder divided between other financial corporations and deposit-taking institutions.
Monthly volume by institutional sector (all maturity buckets)
(EUR billions)

Source: ECB (MMSR).
The share of transactions with CCPs increased between July 2016 and December 2017 and remained stable in 2018 (see Chart 25). On average, only about 30% of transactions were arranged bilaterally or via brokers, while 70% were cleared via CCPs (ranging from 56% to 94% in individual countries). The share of transactions with CCPs was slightly higher for borrowing than for lending in 2018 (70% for borrowing versus 68% for lending).
Share of CCP-cleared transactions over time
(percentages)

Source: ECB (MMSR).
Half of the counterparties in borrowing transactions are located outside of the euro area, while lending is more focused on euro area customers (see Chart 26). The dominance of borrowing transactions with foreign counterparties may be related to the fact that the 50 MMSR banks tend to be relatively large and may, for structural reasons, do more international business.
Share of domestic, cross-border (euro area) and international transactions (including CCPs) in the secured segment
(percentages)

Source: ECB (MMSR).
2.5 Maturities
A majority of secured transactions are concentrated in the “one-day maturity” and “up to one week” buckets (see Chart 27).[7] The share of these short-term buckets in overall secured lending and borrowing remains very high (96% in 2018). Among transactions with one-day maturity, the decline in tomorrow/next lending and borrowing was offset by a growing share of mainly spot/next and, to a lesser extent, overnight transactions. This largely reflects the increasing importance of collateral-driven (specific) secured transactions which are typically executed at the spot/next tenor. Tomorrow/next transactions instead traditionally entail liquidity-driven – or GC – trades, and the decline in turnover mirrors lower liquidity needs in the context of abundant excess liquidity.
Share of total secured activity by maturity bucket
Source: ECB (MMSR).Note: O/N – overnight; T/N – tomorrow/next; SN – spot/next.
Maturities of one month or longer are somewhat more popular in lending than in borrowing (see Chart 28). Most of the counterparties to whom the reporting banks lend for one, three, six or twelve months are either banks or other financial corporations. Most of the transactions with maturities above six months were reported by banks in Germany (in particular for lending) and France. In Germany, the focus on long tenors is primarily due to the redistribution of liquidity from larger to smaller banks.
Volumes by maturity bucket over time
(EUR billions)
Source: ECB (MMSR).Note: O/N – overnight; T/N – tomorrow/next; SN – spot/next.
The term structure of the weighted average repo rates has an upward slope and borrowing rates are lower than lending rates (see Chart 29).
Weighted average rate by maturity bucket
(percentages)

Source: ECB (MMSR).Note: O/N – overnight; T/N – tomorrow/next; SN – spot/next.
3 The foreign exchange swap segment
FX swap volumes in MMSR have been on the rise over the past few years, in line with the growth that this market has exhibited on a global scale. The US dollar is by far the most commonly traded foreign currency against the euro in the FX swap segment, capturing some 80% of volumes reported in MMSR statistics. This dominance of the US dollar in swap volumes is linked to the increasing demand for US dollars for hedging purposes and as a result of the US money market fund reform.
The US dollar has traded at a growing premium for most of the review period, especially in the three-month maturity bucket. The evolution of the premium paid for US dollar funding in the FX swap market by euro area banks has primarily been driven by the divergent monetary policy stances of the Federal Reserve System and the ECB in this period.
Although the data suggest a high degree of volume concentration on reporting agents located in certain jurisdictions, geographical location does not appear to play a major role in the pricing of FX swaps, suggesting that the FX swap market is highly efficient. As to the maturities, most of the FX swap activity is concentrated at short-end maturities, partly to serve cash management purposes.
A salient feature of the FX swap funding is that high US dollar funding costs and regulatory constraints around reporting dates incentivise banks to make occasional recourse to the Eurosystem’s US dollar tenders. Large European banks started embarking on US dollar pre-funding activities in anticipation of reporting dates, which led to considerably lower market funding premia on such occasions. MMSR data reveal that the 50 largest euro area banks have consistently been net providers of US dollars since the middle of 2017, which does not support the notion that occasional funding cost tensions might be related to systemic US dollar shortages, inefficient distribution or market access issues.
3.1 Volumes
FX swap volumes in MMSR have been on the rise over the past few years, in line with the growth this market has exhibited on a global scale (see Chart 30). FX swaps are highly liquid and heavily traded financial instruments. The most recent Triennial Central Bank Survey of foreign exchange and OTC derivatives markets conducted by the Bank for International Settlements (BIS) in 2016 found that, on average, daily global FX volumes were over USD 5 trillion, with FX swaps and forwards making up 60% of this total (the rest is largely options).[8] MMSR data provide a uniquely detailed insight into this large global market, even if they capture only a relatively small sample of it. After having continued on the growth trend observed since 2014, average daily volumes of reported FX swap deals in MMSR were just over €149 billion in 2017. The overall volume of reported FX swap activity continued to rise each quarter from the first quarter of 2017 to the second quarter of 2018 (by 15% in total), followed by a small moderation in volumes thereafter.
There are various reasons to trade in FX swaps, either structural or of an ad hoc nature. One structural reason was that, in anticipation of the US money market fund reform[9] in the autumn of 2016, banks sold holdings of US money market funds and bought government securities, thereby creating additional US dollar needs for international banks, which the FX swap market catered for. An example of ad hoc usage of the FX swap market is the practices of long-term investors, like pension funds, which use their long positions in one currency to fund US dollar assets via the FX swap market as opposed to doing so via the FX spot market. This practice enables them to hedge against the FX risk that building an outright FX position would carry, while obtaining US dollars on terms agreed upfront.
Market share of the daily average volume per quarter – FX swap segment
(EUR billions)

Source: ECB.Notes: Data are from the EMMS until 2015 and MMSR from mid-2016 onwards (indicated by a light blue background). An overlapping sample of 38 banks was used.
The bulk of FX swap activity in the euro area takes place against the US dollar (see Chart 31). As the chart shows, 81% of all FX swap activity in MMSR was reported against the US dollar. The volumes reported in MMSR could be inclined towards the use of US dollars in the FX swap market owing to banks’ FX trading strategies and associated market liquidity patterns, whereby the US dollar is the most systematically used currency (and thus the most liquid), as further detailed below. The pound sterling is the next most actively traded currency at 7%, with all other global currencies, including the Swiss franc and the Japanese yen, making up 12%. The overall currency split was quite stable between the third quarter of 2016 and the fourth quarter of 2018.
Anecdotal evidence suggests that the dominance of the US dollar in swap volumes is partly linked to the way some euro area banks run their FX swap books internally. When executing FX transactions including the euro (e.g. an EUR/AUD transaction), banks can split the deal into two parts. Rather than doing this trade directly in the currency pair concerned, they can enter into a EUR/USD and a USD/AUD trade in order to execute it, with opposing directionality in the USD portion of each split (neutralising the US dollar component of the combined deal).
As MMSR reporting banks only report transactions involving the euro, the above trading practice means that one of the two linked swaps goes unreported. In the above example, this would be the USD/AUD leg. This trading practice also leads to an over-representation of the US dollar’s role in the market, as splitting the deal into two parts has a cancelling effect on the USD portion.
Currency breakdown of FX swaps against the euro
(percentages; July 2016 to December 2018)
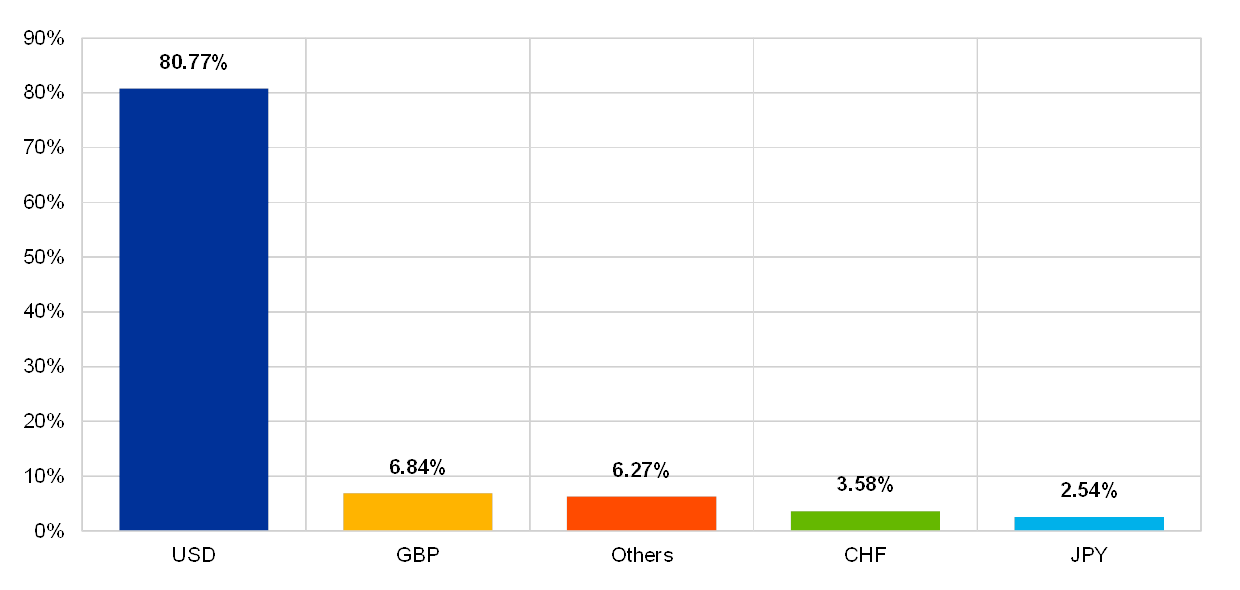
Source: ECB (MMSR).
3.2 Prices – developments in EUR/USD relative costs
Analysis of the FX swap market shows that the US dollar traded at an incremental premium for most of the review period (see Chart 32). As can be seen from the chart, the EUR/USD forward points[10] – i.e. the premium embedded in forward exchange rates when compared to spot exchange rates, as determined by the interest rate differential for the currencies and transaction length involved – rose considerably between July 2016 and the end of 2018. MMSR data show that the rise in forward points was particularly pronounced prior to the 2016, 2017 and 2018 year-ends, with a fairly cyclical pattern ahead of and after the respective year-end.[11]
Evolution of EUR/USD forward points
(left-hand scale: forward points; right-hand scale: forward points)
Source: ECB (MMSR).Note: The dark grey vertical lines indicate the year-end.
The rising cost in FX swap pricing for EUR/USD can largely be explained by the divergent monetary policy paths taken by the ECB and the Federal Reserve over the period (see Chart 33). Between July 2016 and December 2018, the Federal Reserve hiked interest rates eight times, raising the federal funds rate from 0.50% to 2.50%. Meanwhile, the ECB left its policy rates unchanged. The spread widening between these two key rates can be seen in the chart, which shows the impact these interest rate decisions had on the three-month US dollar London interbank offered rate (LIBOR, the rate at which banks lend US dollars to each other) and the three-month euro interbank offered rate (EURIBOR, the rate at which banks lend euro to each other) over the review period. The rising level of the US dollar LIBOR has led to an increase in US dollar borrowing costs, while EURIBOR levels have remained almost unchanged. This substantially increasing spread between the two rates explains most of the increase in EUR/USD forward points over the period.
EUR/USD three-month unsecured rates and EUR/USD cross-currency basis
(left-hand scale: percentages; right-hand scale: basis points (bps))
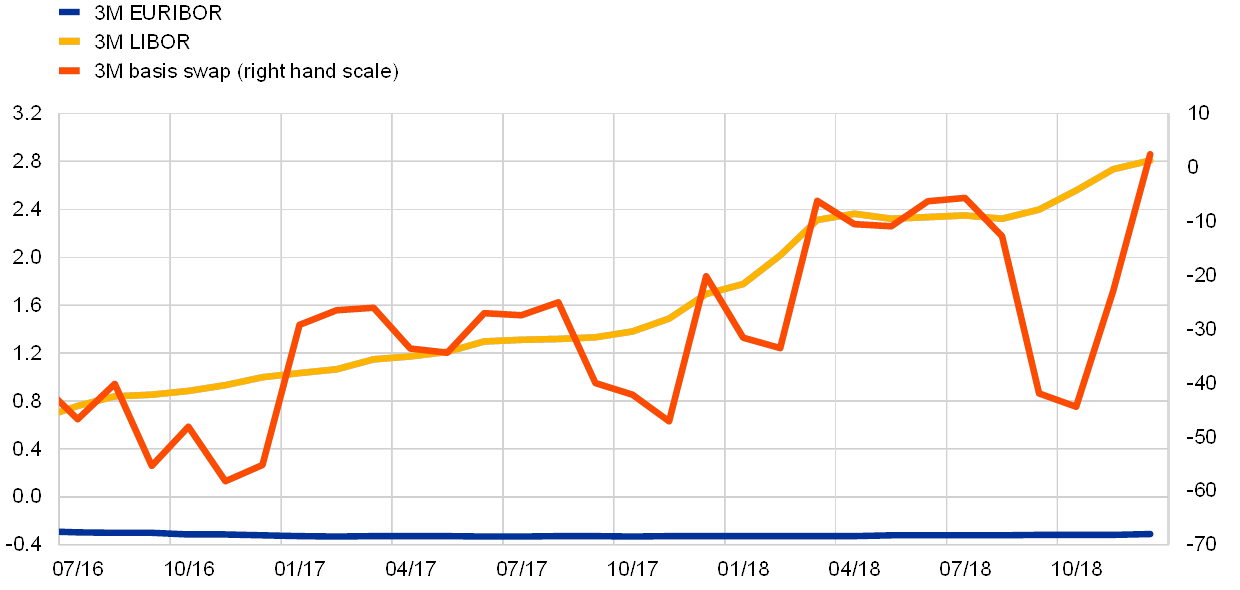
Source: Bloomberg.
There is a residual component reflected in FX swap market pricing which cannot be explained by interest rate differentials alone (see Chart 33). This component can be traced in the cross-currency basis swap market. The EUR/USD basis swap represents the additional premium/discount, beyond the interest rate differential, that an investor must factor in to swap euro for US dollars for three months, e.g. reflecting funding premia/discounts specific to the cross-currency swap market that might relate to funding currency availability/tightness. A negative basis swap means that the rate at which US dollars are sourced in the cross-currency swap market in exchange for euro is more expensive than the interest rate charged to obtain US dollar funding directly in the US market (the basis swap would be zero in a situation where there is covered interest parity)[12]. As can be seen from the chart, US dollars were always at a premium to the euro in the cross-currency basis swap market over the period examined, which added further to the cost of borrowing US dollars through FX swaps. This basis swap can be volatile, but at all times over the review period, US dollars traded at a premium to the euro, apart from the end of 2018, when US dollar oversupply in the cross-currency market temporarily led to a euro premium/US dollar discount basis. The high proportion of FX swaps involving US dollar conducted in the euro area highlights the importance of the cross-currency basis swap market for euro area participants.
3.3 Counterparties
While different degrees of concentration can be observed in the FX swap market for reporting agents and transacting counterparties, geographical location does not appear to play a major role in the pricing of FX swaps. Looking at the relevant MMSR data, France and Germany are the main countries in which reporting agents active in the FX swap market operate, with more than two-thirds of all FX swap activity generated in these two countries, while the location of financial corporations entering into such transactions with MMSR reporting agents can be quite diverse, as shown in Chart 34. The implied rate for FX swap transactions in EUR/USD is fairly homogeneous, regardless of the jurisdiction in which different MMSR reporting agents operate, suggesting that the FX swap market is highly efficient.
From a participation perspective, the interbank market still makes up by far the largest share of the FX swap market by volume. Overall, the participants in this market are overwhelmingly deposit-taking corporations (approximately 75%), with financial intermediaries (excluding pension funds and insurance corporations) and NFCs coming in at below 10% each.
Geographical breakdown of FX swap activity by jurisdiction of financial corporations transacting with MMSR reporting agents
(percentages; July 2016 to December 2018)
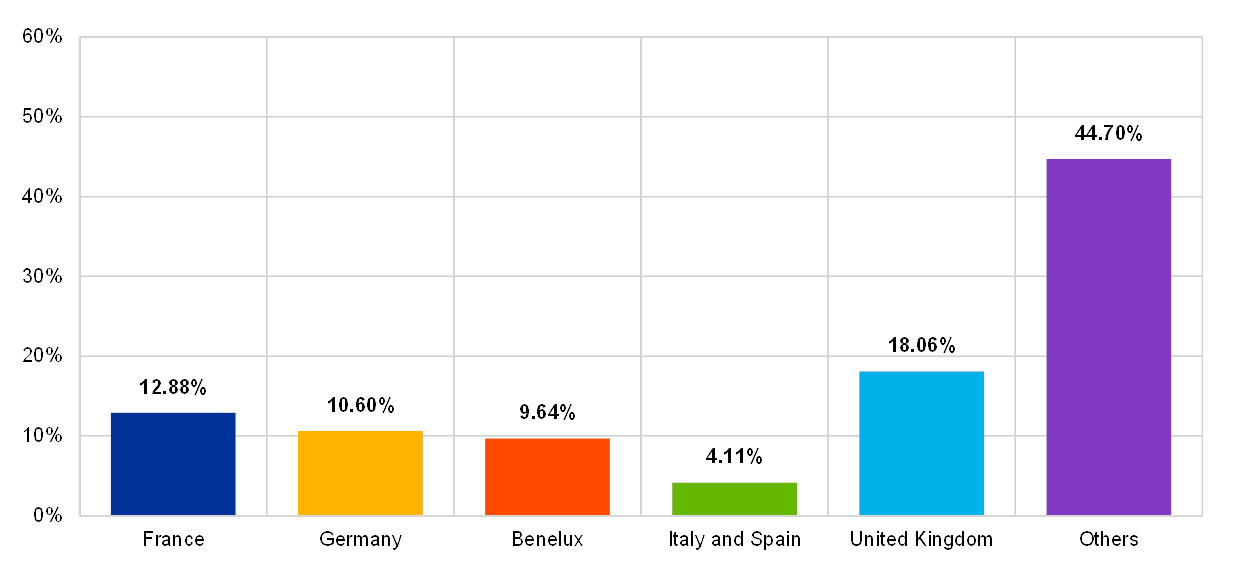
Source: ECB (MMSR).
3.4 Maturities
The FX swap market remains highly concentrated at the shorter end, while 27% of transactions have a non-standard, customised tenor (see Chart 35). Forward point curves increased and steepened during the period under review. As can be seen in the chart, the duration of FX swaps remains highly concentrated at the shorter end of the market with over 50% of all FX swaps conducted over a period of one week or less. Based on market intelligence, the high concentration of short-dated swaps is likely to indicate the growing use of these instruments as a cash management tool, with banks hedging short-dated FX exposures as FX swaps rather than booking deposits and loans. The high use of these swaps is also indicative of a lack of “stickiness” in corporate deposits, which are being placed with financial institutions on a callable basis of one or two days, leading to many deposits being constantly rolled over as FX swaps on a very short-term basis. It is worth noting that 26.5% of all FX swaps do not fit into any of the usual duration tenors. This suggests that many FX swaps are constructed as bespoke over-the-counter (OTC) transactions between two counterparties to cover very specific dates. The maturity split remained fairly stable in the period between the third quarter of 2016 and the fourth quarter of 2018.
Average maturity horizon of FX swaps
(percentages; July 2016 to December 2018)
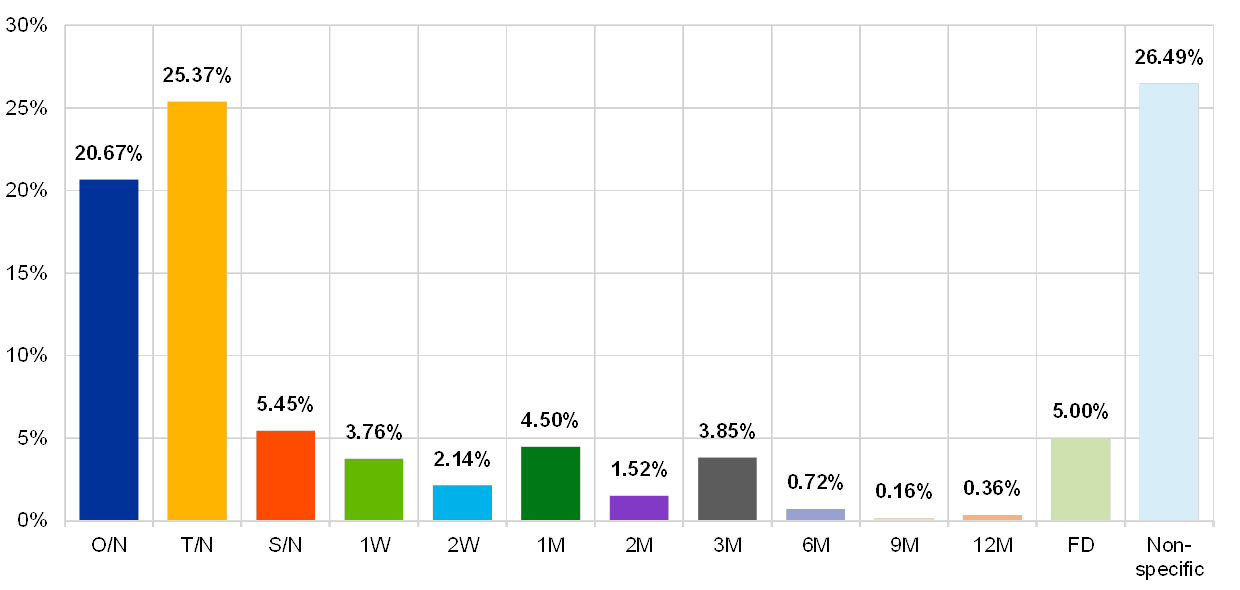
Source: ECB (MMSR).Note: O/N – overnight; T/N – tomorrow/next; SN – spot/next; FD – forward date.
3.5 The relationship between FX swap market rates and participation in the Eurosystem’s US dollar tenders
Since 2007 the Eurosystem has offered US dollar operations to its counterparties to address elevated pressures in the short-term US dollar funding market during and after the financial crisis. The US dollar liquidity swap lines were introduced as a temporary measure in December 2007 to address elevated pressure in the offshore US dollar short-term funding markets and to improve US dollar liquidity conditions in global financial markets. Since then the Eurosystem’s US dollar operations have been priced at a premium over the almost risk-free US dollar OIS rate at equivalent maturity. This price level was set at a premium to OISs to reflect the fact that the operation is to be used only as a prudent liquidity backstop facility, given the introduction of uncapped arrangements.
Participation in the Eurosystem’s one-week US dollar operations is generally limited, but with seasonal increases that can be considerable (see Chart 36). The chart indicates that participation in the Eurosystem’s (currently one-week) US dollar tenders often exhibits a quarterly pattern. The pricing of the operation is usually more expensive than equivalent market funding costs, except at quarter-ends, when the operation is “in the money”. In other words, the operation becomes economically appealing almost exclusively at quarter-ends, when the cost of US dollar funding on the FX swap market rises considerably above the operation’s pricing. Outside of quarter-ends, participation in weekly operations is fairly limited with normally only a few banks bidding for around USD 50-100 million in total.[13]
Eurosystem US dollar tender interest rate versus implied FX swap rate
(left-hand scale: percentages; right-hand scale: EUR billions)
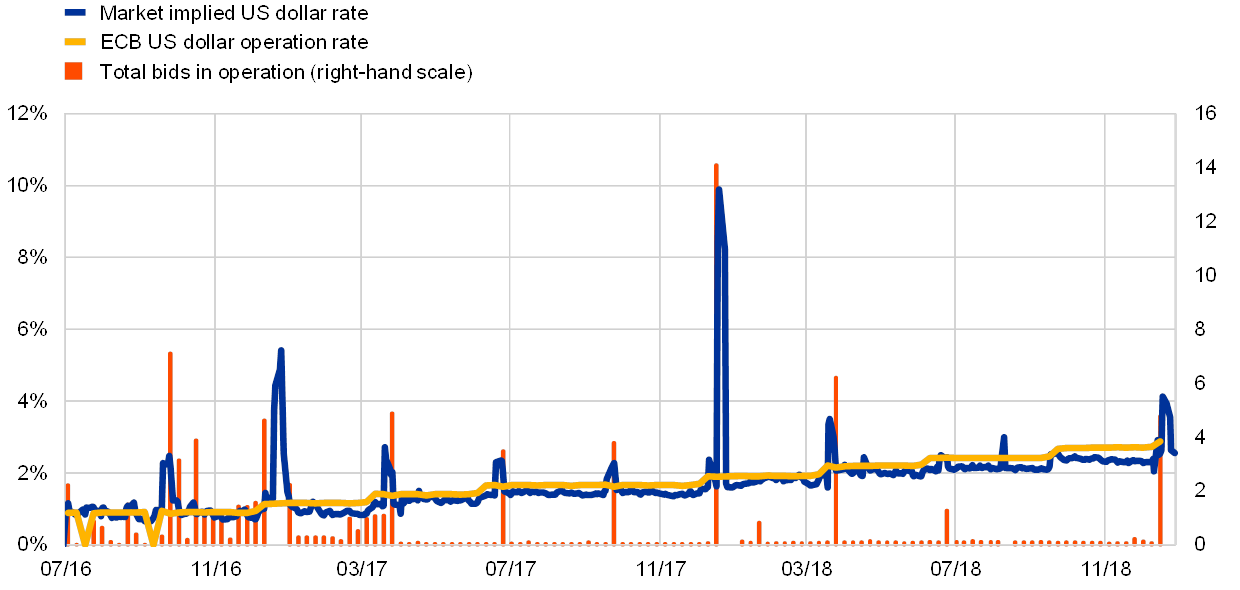
Sources: Bloomberg and ECB.
MMSR data show that pre-funding activities to cover reporting dates have helped ease US dollar funding premia, while their dynamics exhibit fluctuations over time (see Chart 37). Based on anecdotal feedback (which is backed by MMSR data), up until the 2016 year-end banks largely engaged in US dollar funding activities ahead of reporting dates in the last few days preceding such reporting dates. With regulatory provisions causing financial implications for banks with large balance sheets, dealers tend to manage their balance sheets very tightly ahead of reporting dates. However, typically around 70-80% of banks’ US dollar funding activities in the FX swap market was still left to the last week ahead of a reporting date. In 2016 banks that secured their funding during the last days of the year incurred a very significant year-end premium, as the chart shows. MMSR data indicate that, following that year-end, banks began prefunding part of their US dollar needs early (up to six to eight months in advance of reporting dates), which has sometimes led to US dollar funding premia peaking considerably earlier in the cycle, before easing nearer to reporting dates. As counterparties adjust to these market dynamics, premia will remain susceptible to funding activities under conditions of reduced market depth. An example is the 2017 year-end which, while broadly illustrative of the prefunding pattern mentioned above, is also indicative of how a few large transactions can have an immediate impact on the US dollar premium, leading to significant spikes and sharp repricing in the FX swap market.
US dollar pre-funding activities by MMSR banks to cover selected quarters – relative volumes and implied rates
(percentages)
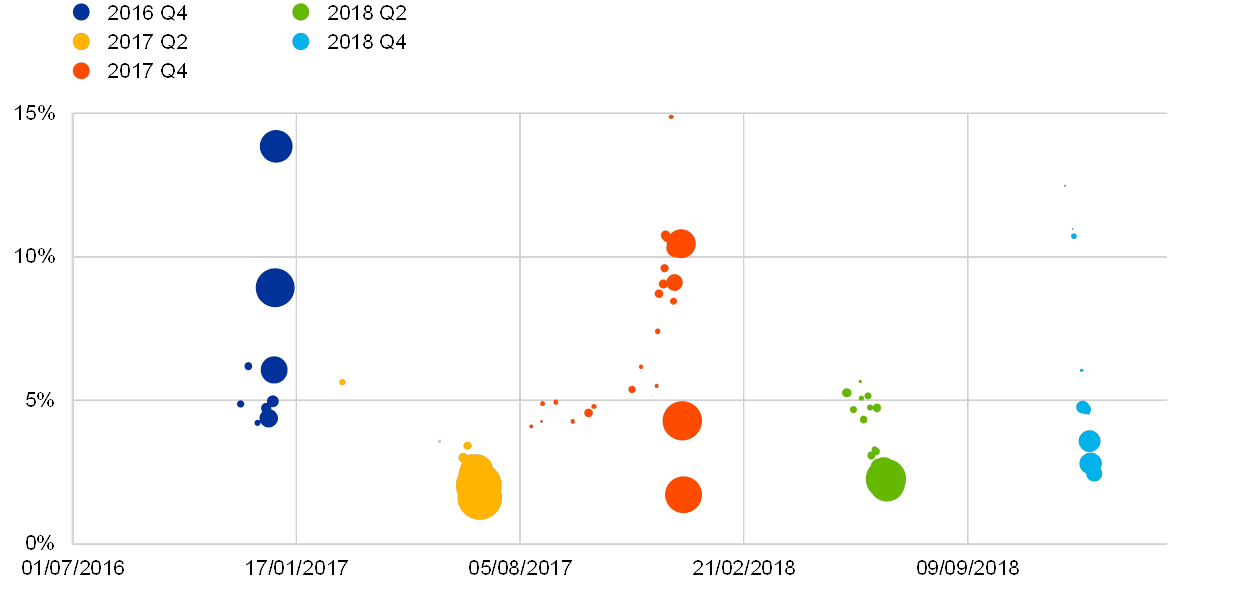
Source: ECB (MMSR).Notes: The bubbles show the weighted average implied interest rate and the volume of transactions (bubble size) for each trading day, based on the US dollar buying side and comparable across time. Data cover trades that settle up to one week before the quarter-end and mature up to one week after the quarter-end. Only data points compliant with the applicable statistical confidentiality rules are displayed.
Despite the varied funding premia patterns observed, MMSR data suggest that reporting banks’ US dollar funding management does not indicate that they have a foreign currency shortage (see Chart 38). MMSR data show that the net position of MMSR banks vis-à-vis their counterparties has been on the net US dollar lending side since the middle of 2017. This relationship is in contrast to their net position in the aftermath of the 2016 money market fund (MMF) reform, when MMSR banks borrowed US dollars in excess of what they lent. This suggests that the US dollar management exhibited by the largest euro area banks since the middle of 2017 does not offer clear evidence to support the notion that occasional funding cost tensions (as shown in Charts 32 and 37) might be related to systemic US dollar shortages or market access issues. Instead, anecdotal feedback suggests that occasional or seasonal US dollar funding tensions might be traced back to temporarily fluid pricing equilibria or temporarily reduced market depth.
Net US dollar position of FX swap market participants in MMSR data
(left-hand scale: EUR trillions; right-hand scale: EUR billions)
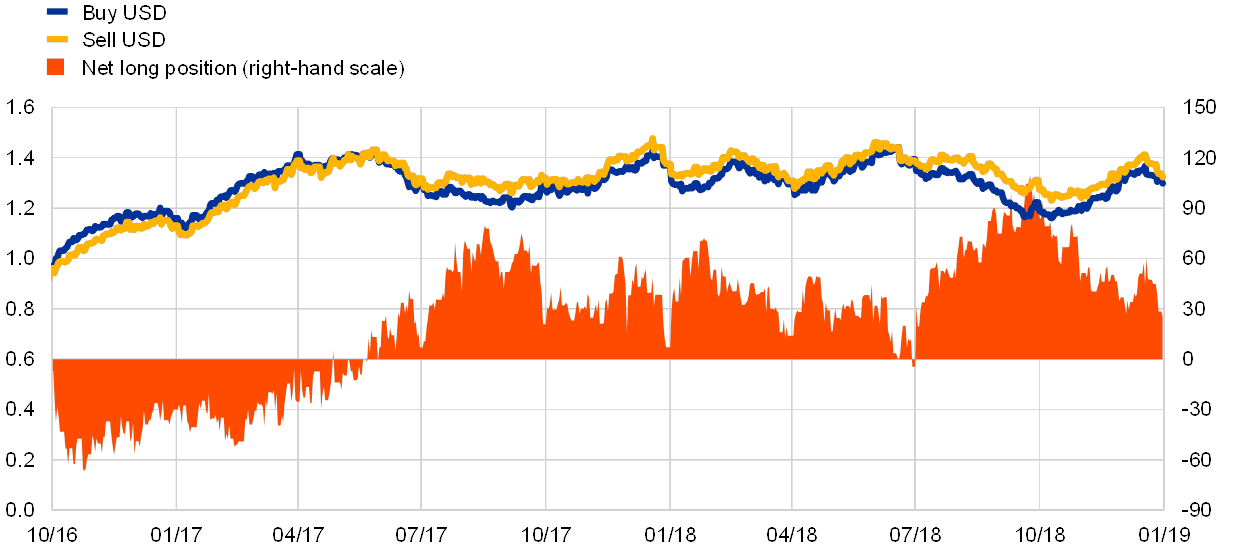
Source: ECB (MMSR).
4 Overnight index swaps
Volumes in the OIS segment are recovering slowly and fitfully from the all-time lows recorded in 2016, but still remain considerably lower than in pre-crisis times. The OIS market features a fairly even split between spot and forward transactions and shows balanced liquidity conditions on both trading sides (receiving and paying), while specific events of relevance to monetary policy seem to stimulate activity in this market.
An analysis of pricing features in OIS transactions shows a rather narrow spread between spot and forward settlement transactions. Both spot and forward transactions in MMSR data have very good proximity to market OIS quotes. Hence, transactions in the OIS segment in MMSR are as valuable a source for deriving indications of monetary policy rate expectations as the market quotes traditionally used for such purposes.
Looking at the composition of participants in the OIS segment, MMSR data show a strong concentration. From a geographical perspective, counterparties located in Germany and France account for more than 80% of the activity in the OIS market. The major market makers are investment banks, while at present the vast majority of transactions are conducted via CCPs. Participants access the OIS market for hedging, portfolio rebalancing and positioning for possible central bank rate movements.
From a maturity perspective, the three-month OIS maturity bucket generates the highest level of activity in terms of volume and number of transactions, while the average ticket size decreases as maturities increase.
4.1 Volumes
Volumes in the OIS market tend to be considerably lower than in pre-crisis times, while intermittent spikes can be observed (see Chart 39). The size of the OIS market has fallen in cumulative volume terms since the Eurosystem responded to the financial crisis with non-standard measures that led to an increase in excess liquidity, forward guidance and the setting of policy rates at unprecedentedly low levels, as can be seen in the chart. This may reflect the fact that the Eurosystem’s measures anchored rate expectations at low or lower levels for a prolonged period of time, rendering market needs for interest rate hedging less relevant. During the period under consideration, OIS volumes have periodically showed signs of upward volatility since the market reached all-time lows in 2016.
Market share of the daily average volume per quarter – OIS segment
(EUR billions)
Source: ECB.Notes: Data are from the EMMS until 2015 and MMSR from mid-2016 onwards (indicated by a light blue background). An overlapping sample of 38 banks was used.
OIS transaction volumes suggest a stable long-term average daily volume, with occasional upward deviations (see Chart 40). The monthly cumulative volumes presented in the chart suggest that OIS market transactions in MMSR data have a daily average turnover of around €40-50 billion, as a minimum, over the review period.
Monthly cumulative volume of transactions in the OIS market
(EUR billions)
Sources: ECB (MMSR) and ECB calculations.Note: Data cover the period between the third quarter of 2016 and the fourth quarter of 2018.
MMSR data show that the volumes recorded in normal circumstances are broadly equally split between spot and forward transactions (see Chart 41). According to feedback from market participants, OIS transactions with spot settlement and transactions that are forward-dated are used by different market actors. OIS contracts with immediate settlement are mostly used by asset and liability managers aiming to hedge their portfolios, while forward-dated OIS contracts are used more to take an active position on central bank interest rates. Overall, while in broad terms spot and forward volumes were equally split on regular trading days (see “All days” in Chart 41), forward volumes were more volatile than spot market volumes over the review period.
It is also worth pointing out, however, that there are periodic events where OIS activity peaks in tandem with a rise in forward-dated transactions, such as quarter-ends or events of relevance to monetary policy (see Chart 41). Regarding the pattern of daily trades, MMSR data show that volumes in the OIS market are higher than average on days when there is a particular focus on monetary policy expectations and large market reactions. The chart shows that OIS volumes are generally higher on days of heightened market interest, when compared to their daily averages since July 2016. These are often – but not exclusively – dates of ECB press conferences, and mainly affect forward-dated contracts, although spot contracts may also exhibit reactions to such events. On the occasion of the communication delivered at the Sintra Forum in June 2017[14], the release of the December 2017 Monetary Policy Accounts (in January 2018[15]) and a speech by ECB Executive Board member Peter Praet in June 2018[16], all of which were interpreted as bearing more hawkish monetary policy messages than expected, and hence led to some repositioning, volumes were particularly high for forward-dated contracts (e.g. maintenance period and other custom-made contracts).
Average volumes for immediate settlement and forward-dated OIS contracts
(EUR billions)
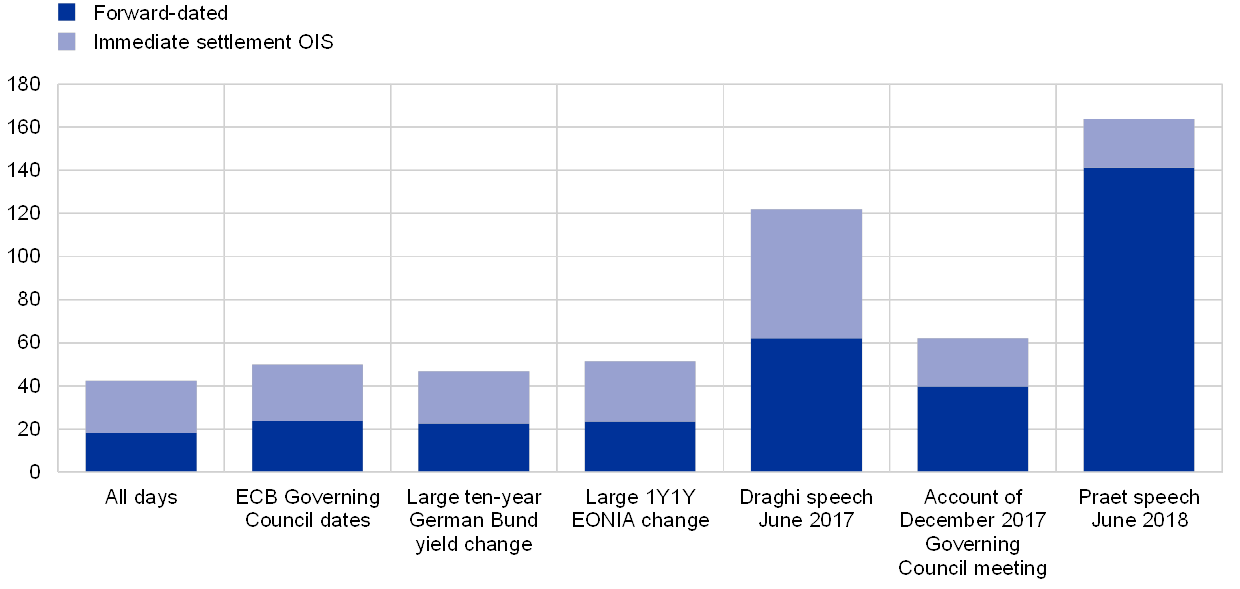
Sources: ECB (MMSR) and ECB calculations.Notes: Refers to average daily volumes. For total averages the horizon is from 1 July 2016 to the end of 2018. Specific dates are selected according to events. For the largest interest rate moves, the largest decile since July 2016 is chosen.
The OIS market is characterised by balanced liquidity conditions on both trading sides (see Chart 42). Daily OIS traded volumes (for any maturity) in the MMSR dataset corroborate the view broadly reported by market makers that liquidity in the OIS market is good and two-sided, as illustrated in the chart by the narrow spread in terms of volume and number of transactions between transactions receiving the fixed rate and transactions paying the fixed rate. This indicates that MMSR market participants are active in a balanced way on both sides of the market, from both a transaction and a volume perspective.
Spread in number of transactions and traded volume between OIS contracts paying and receiving the fixed rate
(left-hand scale: EUR billions; right-hand scale: units)
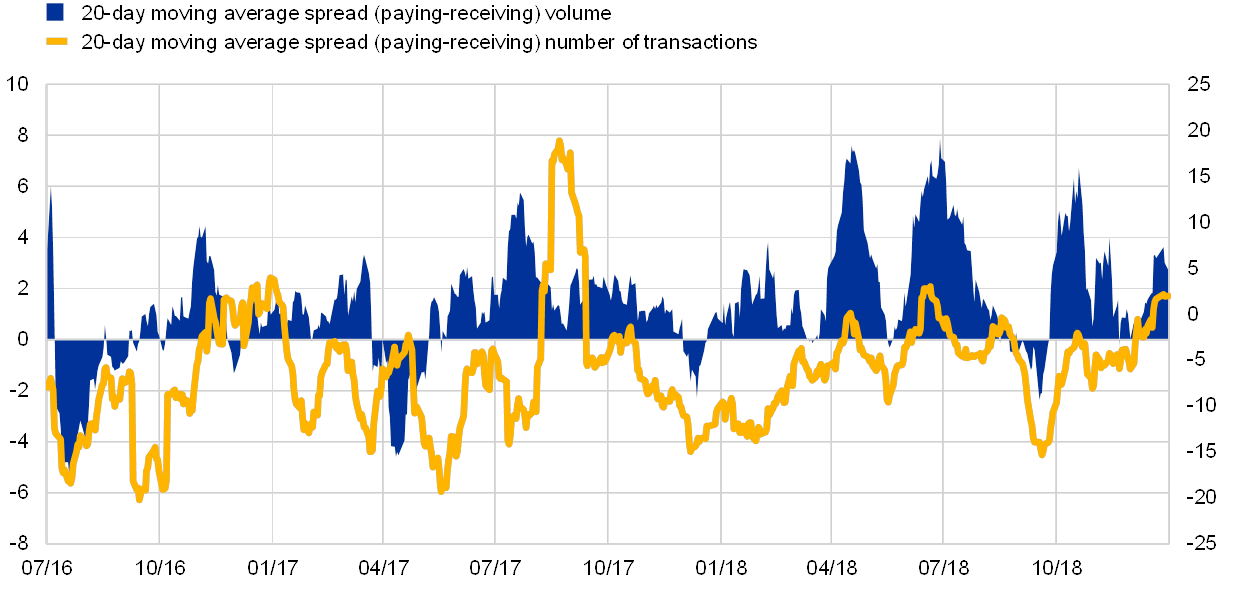
Sources: ECB (MMSR) and ECB calculations.Note: Refers to daily traded volumes, based on trade dates.
4.2 Prices: OIS levels and relevance for rate expectations
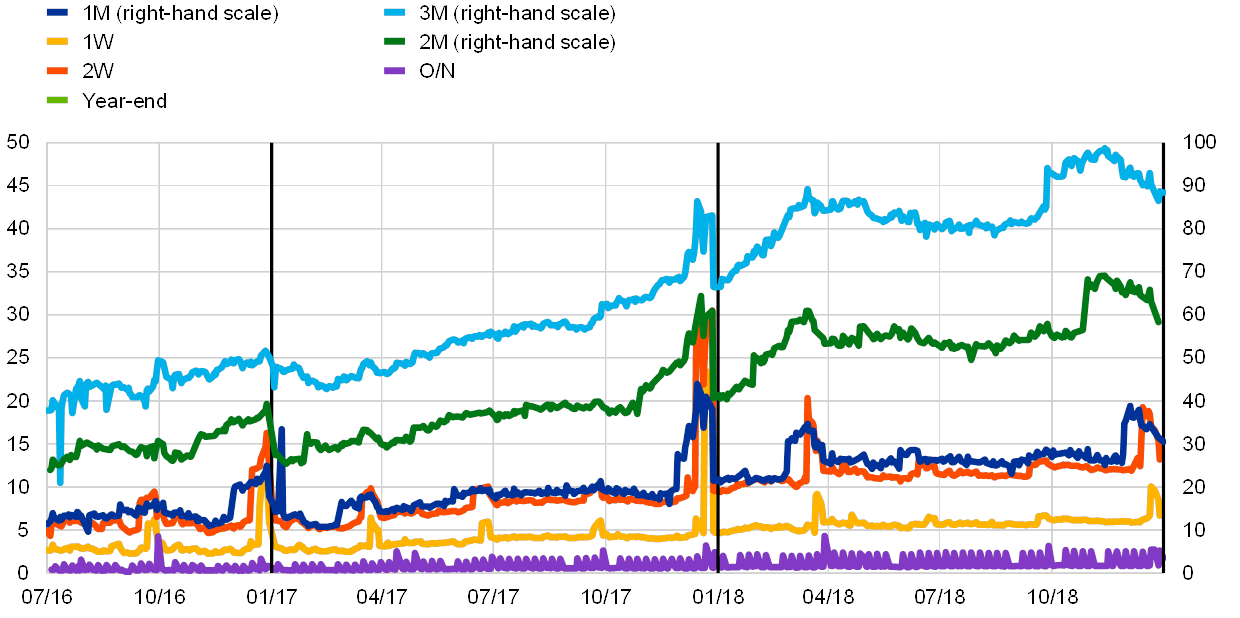
Transaction-level MMSR OIS data show a rather narrow spread between the two sides of the OIS market across maturities (see Chart 43). The chart shows the volume-weighted average pricing in outstanding OIS contracts paying or receiving the fixed rate across maturities on a daily basis. The curves are upward sloping; i.e. the pricing of OIS contracts increases moving into the future. This largely reflects the pricing of longer-term contracts which takes into account the positive rate outlook, as reflected in market expectations. It is clear from the chart that the pricing is very closely aligned for OIS contracts paying or receiving the fixed rate for any maturity up to the end of 2019. This suggests that the forward guidance delivered by the Governing Council at its meeting on 14 June 2018 on the future path of interest rates[17] has been priced into market expectations. However, a small spread of up to a few basis points starts emerging for contracts maturing as of early 2020. Qualitative and quantitative market indicators as at the fourth quarter of 2018 suggest the Eurosystem could raise the DFR (for the first time since July 2011) in early/mid-2020, which could be a driver for this spread.
Volume-weighted pricing in OIS contracts paying/receiving the fixed rate across maturities
(y-axis: left-hand scale: percentages; right-hand scale: basis points)
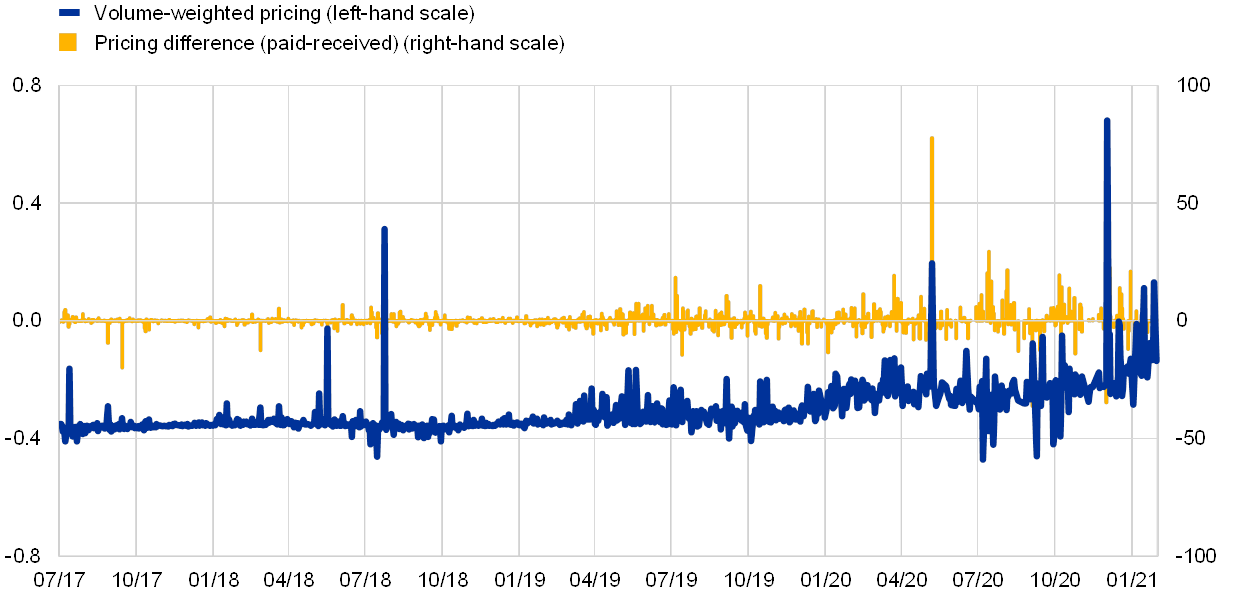
Sources: ECB (MMSR) and ECB calculations.
Transaction data based on OIS trades broadly match market quotes, regardless of whether the data concern transactions paid or received. MMSR data confirm that individual transaction data on OIS contracts with either immediate or forward-dated settlement are closely aligned with commercially available market quotes, on both the receiving and the paying side. This implies that the explanatory power of MMSR pricing data on OIS contracts is broadly similar to that of commercially available data regarding monetary policy expectations.
4.3 Counterparties
Market feedback implies that participation in the OIS market is largely dominated by investment banks and commercial banks (some of which act as market makers), hedge funds, pension funds and issuers of securities. MMSR data cannot confirm this range of counterparties, as the bulk of transactions listed involve CCPs. According to counterparty feedback, motivations for entering into transactions in the OIS market include hedging and portfolio rebalancing, as well as taking positions regarding the future path of central bank rates, but there are also differences between the different types of counterparty. The feedback suggests that investment banks and commercial banks trade in the market on their own account or on behalf of their customers, while the activities of hedge funds and pension funds are usually aimed at adjusting portfolio positions in response to changes in future central bank rate expectations or unexpected OIS spikes related to the market positioning of other actors.
In recent years the share of centrally cleared transactions has been increasing, largely due to regulation (see Charts 44 and 45). Structural developments over the past five years have shifted activity from bilateral trading and clearing to CCPs. The main reason for the shift to CCP clearing is regulation, as banks are obliged under EMIR to trade interest rate swaps via CCPs. The obligation to have CCP clearing for OIS contracts denominated in the G4 currencies entered into force progressively over the period under review, beginning on 21 December 2016 for financial counterparties above a certain threshold.[18] Anecdotal feedback suggests that banks see the market liquidity provided by CCPs as quite beneficial. Consequently, the share of OIS transactions in which CCPs are the counterparty, including lending and borrowing, and spot and forward transactions, has increased progressively over the period under review, now accounting on average for more than four in five transactions in the OIS market.
Evolution of centrally cleared transactions
(percentages)

Sources: ECB (MMSR) and ECB calculations.Note: Refers to average daily volumes.
Counterparties as a percentage of total volumes (paid and received)
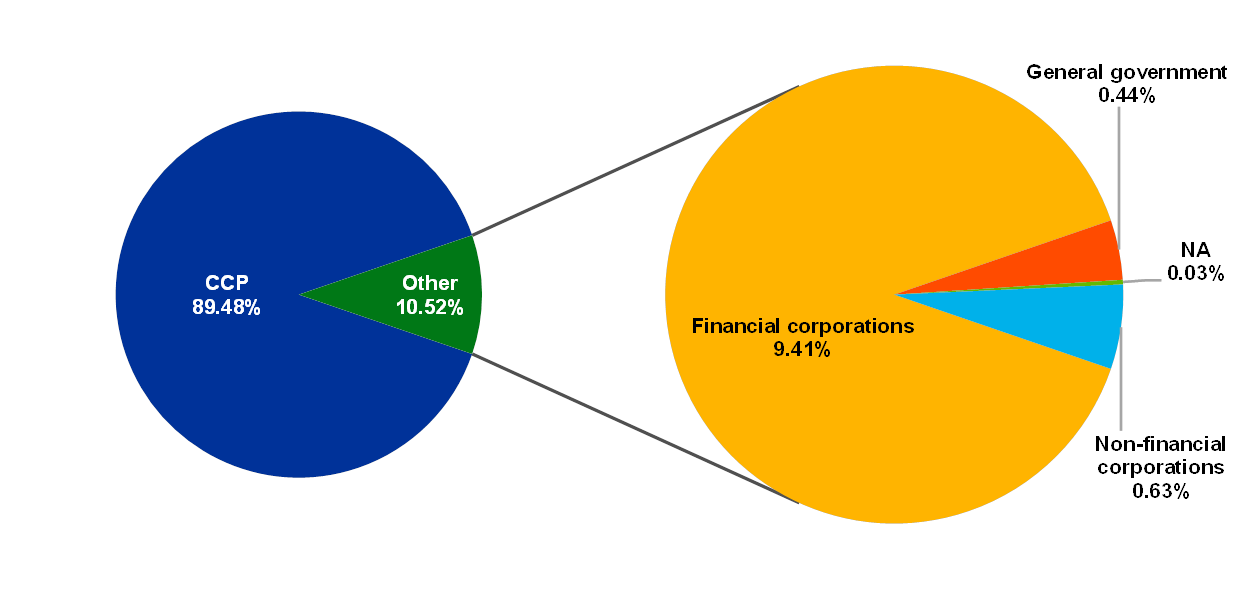
Sources: MMSR and ECB calculations.Note: Data cover the period between Q3 2016 and Q4 2018.
MMSR data indicate a strong concentration in terms of counterparties as well as countries out of which participating banks operate (see Chart 46). When considering the reporting agents’ countries of origin, France accounted for 62% of all MMSR reported volumes, followed by Germany with 20%. The data also provide information on the counterparty concentration of the market. When considering the concentration of the OIS market, it is found that the ten most active banks represent more than 75% of market turnover. These findings are in line with market feedback, which points to a small number of big players in the OIS segment.
Share of transactions by country of origin of the reporting agents
(percentages; July 2016 to December 2018)
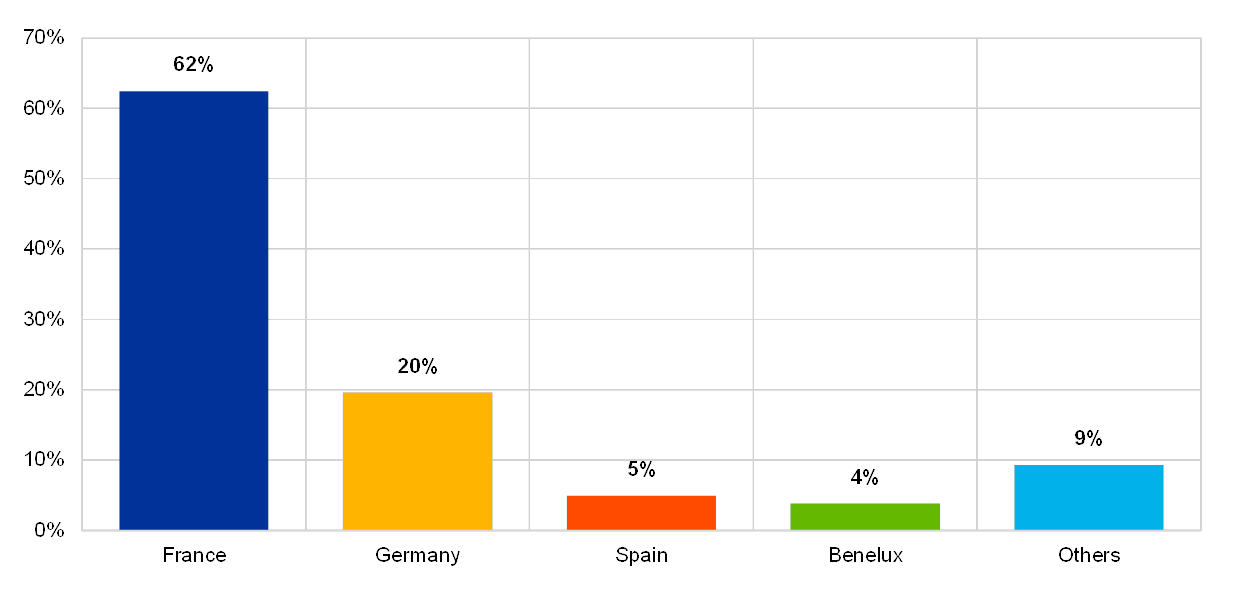
Sources: ECB (MMSR) and ECB calculations.Notes: All trades covered (both paying and receiving the fixed rate). In some countries, the representativeness of the MMSR database is debatable (for example, Austria has only one reporting agent, and some countries have no reporting agents at all).
4.4 Transaction maturities
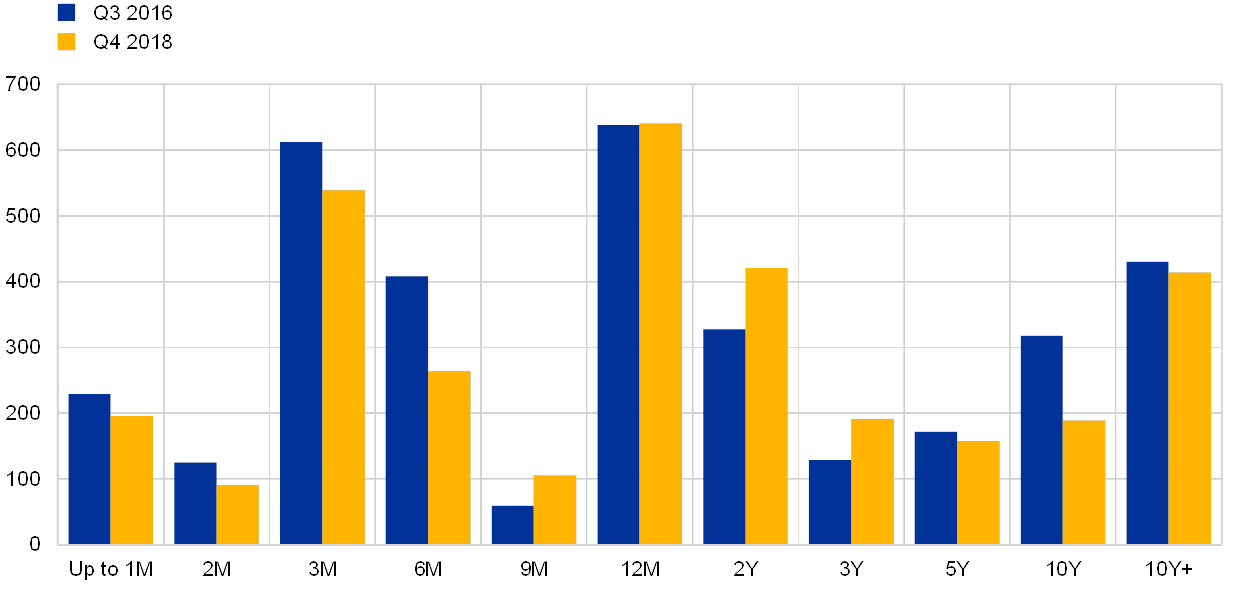
MMSR data show that the three-month OIS bucket is the one with the most activity in terms of volume and number of transactions (see Charts 47 and 48). Looking at transactions where the reporting agent paid or received the fixed leg in the spot market, the highest volume can be found in the three-month maturity bucket, followed by up to one-month, twelve-month and six-month buckets. While volumes in several buckets increased between the middle of 2016 and 2018, it is the three-month bucket that experienced the largest increase (35%). Looking at the most active segments in terms of number of transactions, these are the three-month, six-month, twelve-month and beyond ten-year buckets, with the three-month maturity being on the rise since MMSR data started being collected, while the others were either stable or declined. It may also be noted that the number of transactions remains relatively high for some longer maturities, while volumes are relatively low, which suggests that the average ticket size decreases for longer maturities beyond one year.
Volume traded by maturity bucket
(EUR billions)

Sources: ECB (MMSR) and ECB calculations.Note: All trades covered (both paying and receiving the fixed rate).
Number of transactions by maturity bucket
(units)
Sources: ECB (MMSR) and ECB calculations.Note: All trades covered (both paying and receiving the fixed rate).
5 Short-term securities
In the euro area, there are two major labels for short-term paper: the Short-Term European Paper (STEP) and the French Negotiable European Commercial Paper (NEU CP).
The STEP market saw relatively stable volumes during the whole financial crisis, while the NEU CP market experienced a steep decline. Focusing on the last two and a half years, statistics show a mild recovery in the NEU CP market. At the end of 2018, about €400 billion of short-term securities with the STEP label and €325 billion with the French label were outstanding. A number of NEU CP securities also carry the STEP label, hence both statistics overlap considerably. While the market for commercial paper (CP) is still about ten times larger than that for certificates of deposit (CDs), the latter has been gaining importance since 2016.
Yields on short-term paper dropped sharply during the financial crisis, followed by a mild recovery and then a further drop after the sovereign debt crisis, reaching negative territory in June 2014 after the introduction of negative interest rates on the Eurosystem’s deposit facility. STEP paper with a tenor of 0-7 days also frequently shows yields below the overnight benchmark rate, EONIA.
Monetary financial institutions (MFIs) form the most important group of issuers of short-term paper and about 70% of STEP paper is denominated in euro, while most other paper is denominated in US dollars or pounds sterling. On the demand side, money market funds (MMFs) have traditionally been responsible for a large part of the take-up of short-term paper. MMF holdings decreased significantly during the financial crisis, as well as during the European sovereign debt crisis. This decrease continued under the post-crisis conditions of excess liquidity, but reversed in 2014 when the negative DFR was introduced. In the negative interest rate environment, investors may have turned to MMFs as an alternative to regular bank deposits, as the interest rates on these deposits can be well below the DFR for customers that do not have access to the deposit facility. Increased MMF holdings resulted in increased demand for CP and CDs over the period observed, with the exception of the second quarter of 2018.
5.1 Volumes
In the euro area, there are two major labels for short-term paper: STEP and the French NEU CP. While government treasury bills are also short-term tradable securities, the “short-term securities market” only refers to securities with a maturity of up to two years issued by non-sovereigns (banks, corporations and local authorities). This includes CDs and CP as the most common types of short-term securities. Other short-term securities, such as floating rate notes and asset-backed CPs have significantly lower volumes. The French NEU CP (formerly TCN) market,[19] which includes CDs, CPs and medium-term notes (MTNs), used to be the most important short-term securities market in the euro area. The depth and liquidity of the French market is based on its high level of transparency and openness to international issuers, especially since the reform conducted in 2016. The STEP initiative has also helped promote the integration of the short-term debt securities markets. Since 2006, the STEP label, which only covers paper with a tenor of up to one year, has been a sign of compliance with a set of high standards and practices, including the provision of accurate and complete data in prospectuses. French NEU CP paper often also carries the STEP label. By the end of 2018, 45% of STEP paper outstanding consisted of NEU CP paper.
From an historical perspective, STEP volumes have remained relatively stable over time, while the French NEU CP (formerly TCN) market saw a steep decline in the period 2013-2016 (see Charts 49 and 50). The outstanding amount of STEP paper has remained relatively stable at around €400 billion over the last decade. The stable levels of outstanding STEP paper do not necessary indicate stable issuance of short-term paper, as other statistics tend to confirm that fewer securities were issued but that an increasing share of them had the STEP label. Outstanding amounts of French short-term paper reached a record high in February 2009, at €600 billion, but then decreased to its lowest level, close to €300 billion, in the third quarter of 2016. The decline in the TCN market was primarily driven by the decrease in issuance by banks, while corporate (non-bank) and public issuers showed relatively stable outstanding amounts. This decrease is likely to relate to the excess liquidity conditions. In the third quarter of 2016, a new regulation was implemented in France. The 2016 reform opened up the former TCN market to non-French issuers by providing efficient post-market infrastructures and opening up the list of credit rating agencies accepted to include all of the agencies registered with the European Securities and Markets Authority (ESMA). After the implementation of the reform, the outstanding amount grew slightly from €300 billion in June 2016 to around €325 billion at the end of the second quarter of 2018. However, in the second half of 2018, the volume fell back towards €300 billion.
STEP outstanding amount
(EUR billions; all currencies – tenors up to one year)
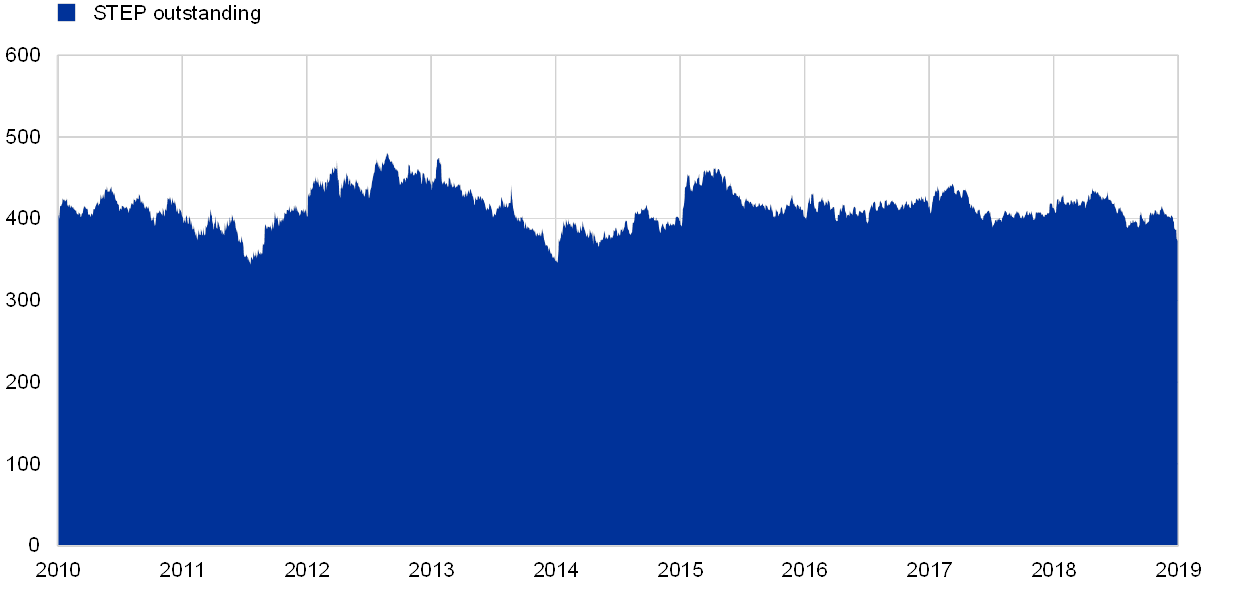
Source: ECB (STEP database).
NEU CP and NEU MTN (formerly TCN) outstanding amount
(EUR billions; all currencies – tenors up to two years)

Source: Banque de France.
The outstanding amount of commercial paper showed a downward trend until the first quarter of 2013, after which it stabilised and subsequently made a moderate recovery (see Chart 51). Dealogic data, which exclude the French NEU CP and Negotiable European Medium-Term Note (NEU MTN) markets, seem to confirm that the relatively stable levels of outstanding STEP paper shown in Chart 56 are more likely due to the hypothesis that, despite the overall issuance of CP declining during the crisis, an increasing share of it was issued with the STEP label.
Commercial paper outstanding amount
(EUR billions, monthly data)
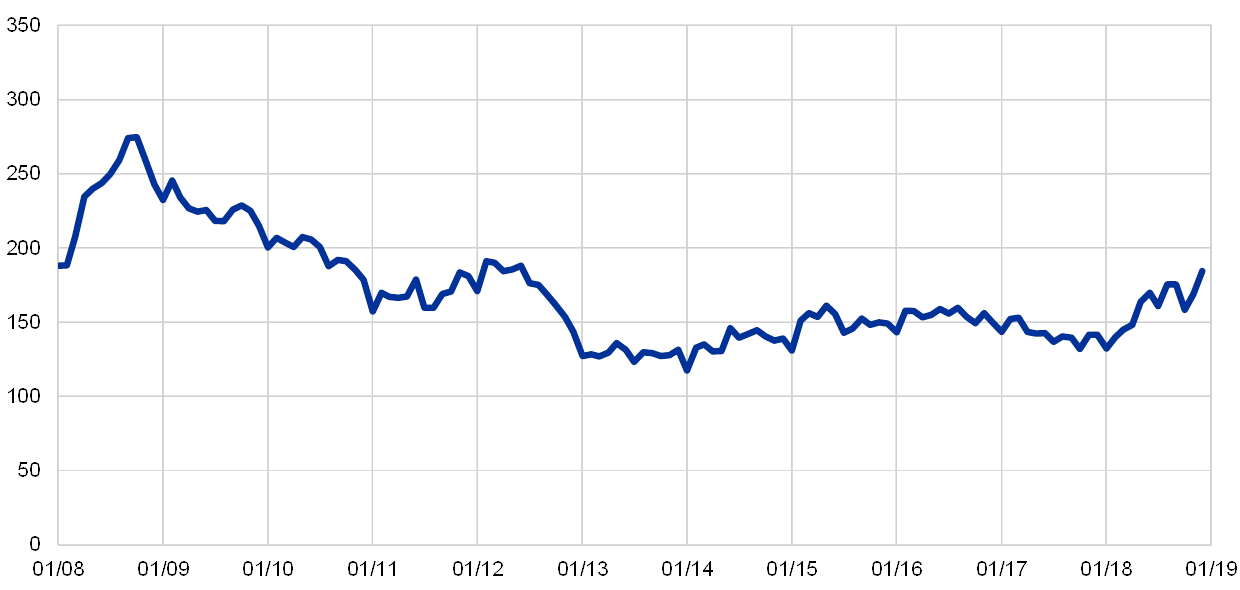
Source: Dealogic.
While the market for commercial paper is still about ten times larger than the market for certificates of deposit, the latter has been gaining in importance since 2016 (see Chart 52). Dealogic data show a faster recovery for CDs since 2016. The outstanding amount of CDs grew from around €25 billion at the start of the third quarter of 2016 to around €35 billion in mid-2018. More recently, the upward trend has been interrupted, with the outstanding amount declining to €30 billion at the end of 2018.
Certificates of deposit outstanding amount
(EUR billions, monthly data)
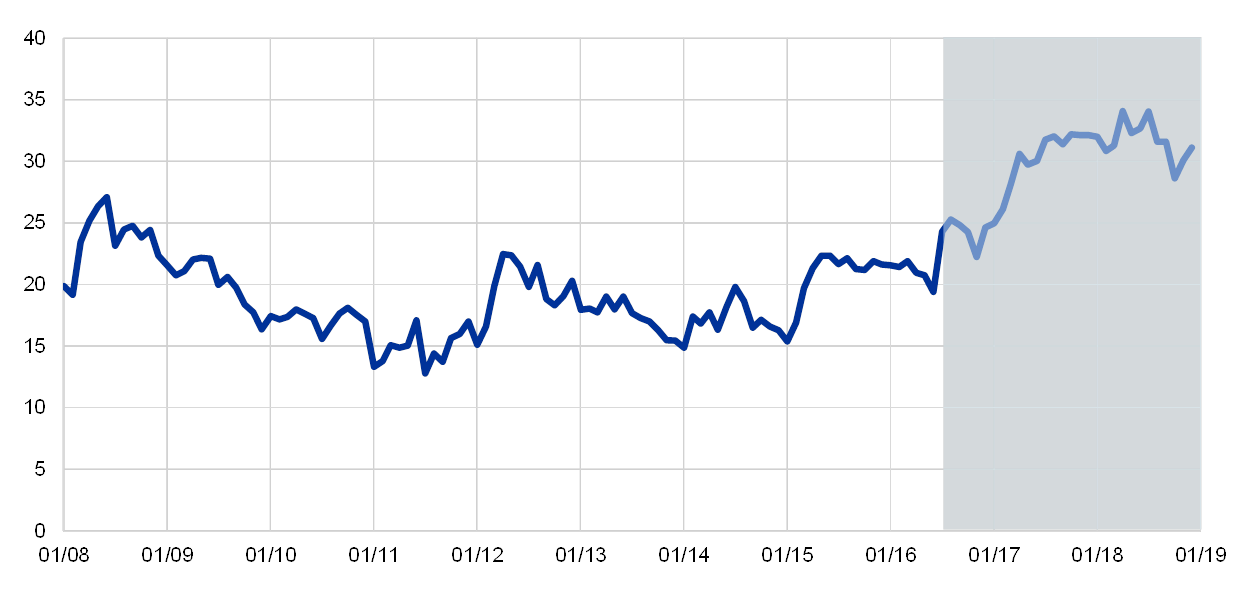
Source: Dealogic.Note: The period under review is indicated by a light blue background.
5.2 Prices
Yields in the primary market
Yields on short-term securities dropped sharply during the financial crisis, which was followed by a mild recovery, but since mid-2016 they have experienced a further decline (see Charts 53 and 54). CP is sold at a discount relative to its face value, and the pricing of CP depends on the rating of the issuer. STEP statistics are available for different credit ratings and tenors. Yields reached negative territory in June 2014 after the introduction of negative interest rates on the deposit facility. STEP paper with a tenor of 0-7 days also frequently shows yields below the overnight benchmark rate, EONIA, which has been the case consistently since October 2016.
STEP yield on zero-coupon paper
(percentages)
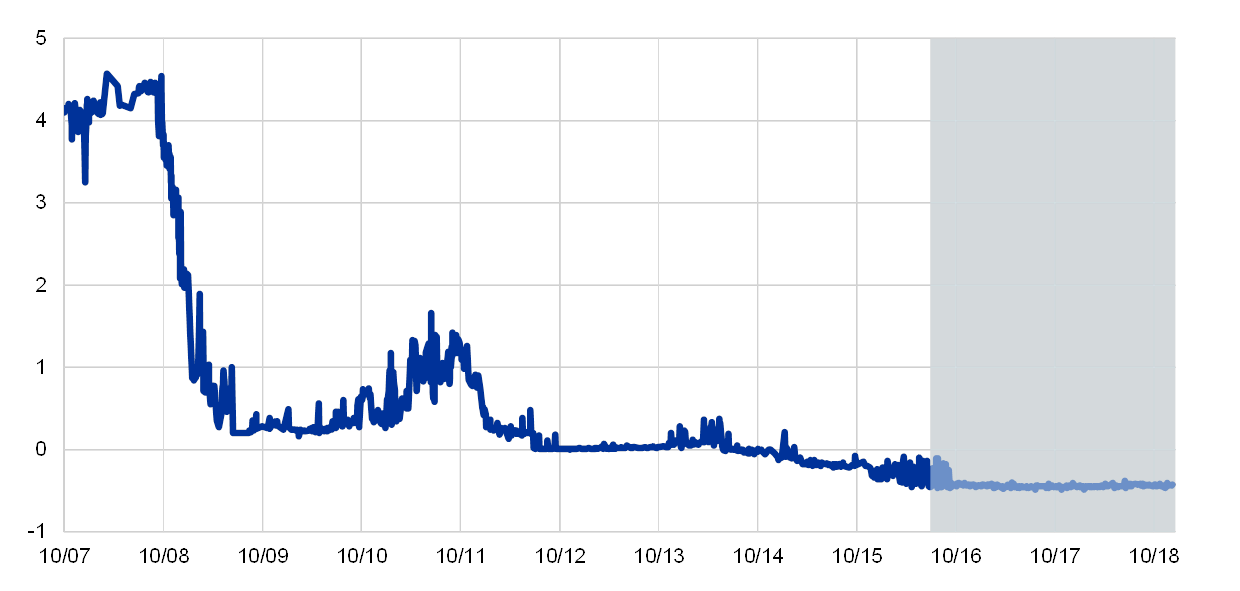
Sources: ECB (STEP database) and ECB analysis.Notes: Average yield on zero-coupon STEP paper with a tenor of 0-7 days and the highest credit rating. The period under review is indicated by a light blue background.
STEP yield and volume: total vs. MFI issuance
(x-axis: tenor, days; y-axis: left-hand scale: percentages; right-hand scale: gross issuance, EUR billions)
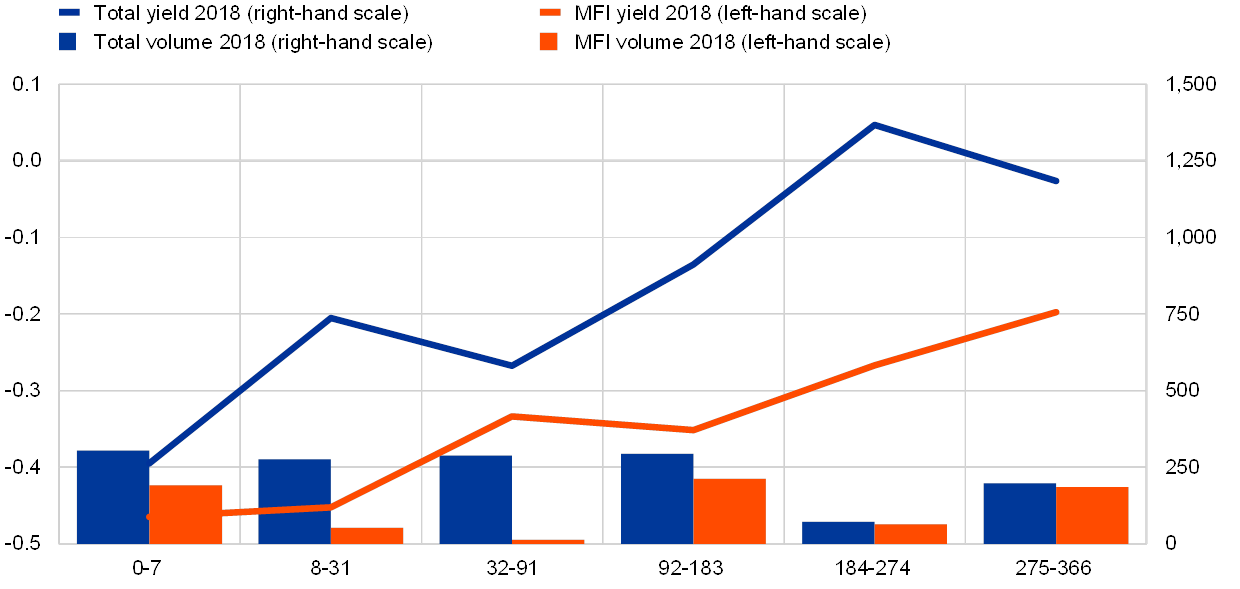
Source: ECB (STEP database) and ECB analysis.
5.3 Counterparties – investors and issuers
Traditionally, money market funds (MMFs) are significant investors in short-term securities, providing a stable demand for issuers (see Chart 55). MMF holdings decreased significantly during the financial crisis, as well as during the European sovereign debt crisis. This decrease continued in the post-crisis conditions of excess liquidity, but reversed in 2014, when the negative DFR was introduced. In the negative interest rate environment, investors may have turned to MMFs as an alternative to regular bank deposits, as the interest rates on these deposits can be well below the DFR for customers that do not have access to this facility. Increased MMF holdings resulted in increased demand for CP and CDs (euro area MMF holdings increased from €526 billion in June 2016 to €552 billion in December 2018).
European MMF holdings (euro-denominated)
(EUR billions)
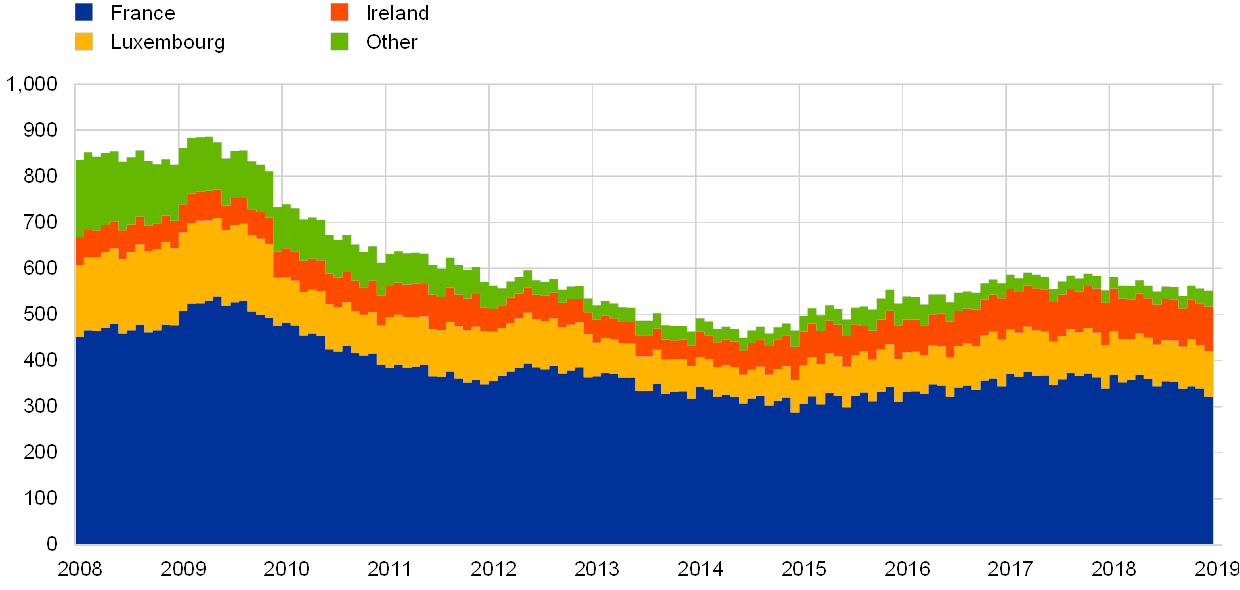
Source: ECB.
The take-up of CP by UK investors and other financial corporations increased significantly (see Chart 56). MMSR data show an increase in the take-up by UK counterparties from 30% in the third quarter of 2016 to 37% in the fourth quarter of 2018. The MMSR database uniquely allows analysis of the counterparties who take up paper in the primary market for maturities of up to one year.
CP take-up by investor location
(EUR billions; all tenors, per quarter)
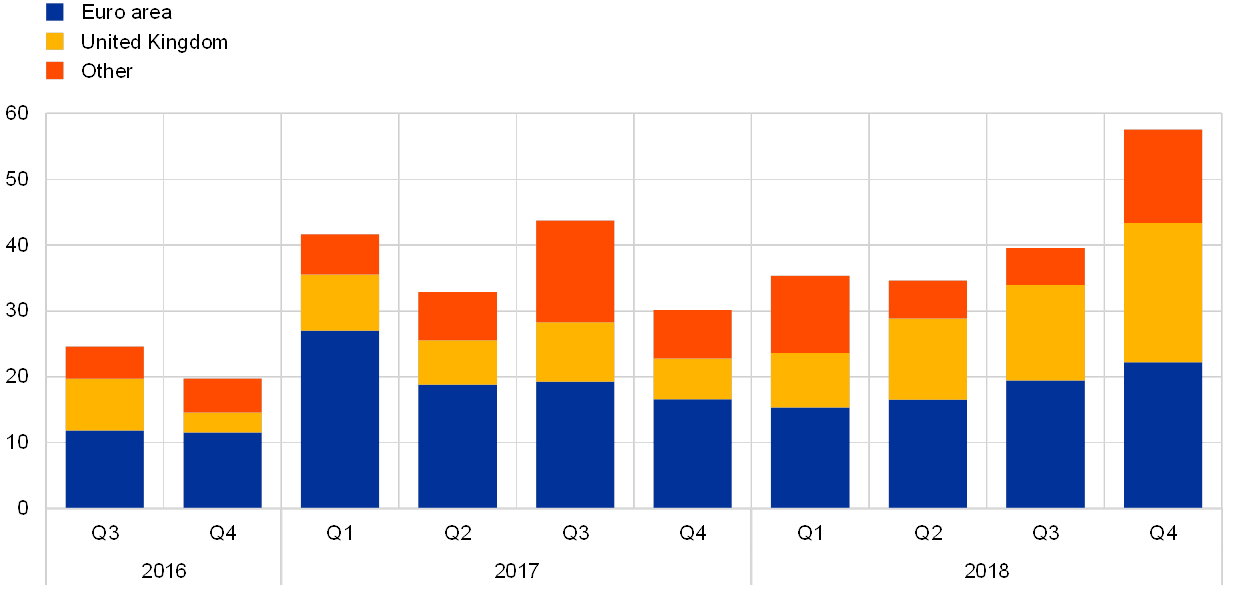
Sources: ECB (MMSR) and ECB analysis.
The main issuing sector for both STEP and NEU CP paper is the MFI sector, with a share of between 60% and 75% of total outstanding amounts (see Charts 57 and 58). Public issuers account for most of the remaining outstanding amounts of STEP paper, while corporates dominate the remaining outstanding amounts for NEU CP paper.
STEP outstanding amount by sector
(EUR billions, average per quarter)
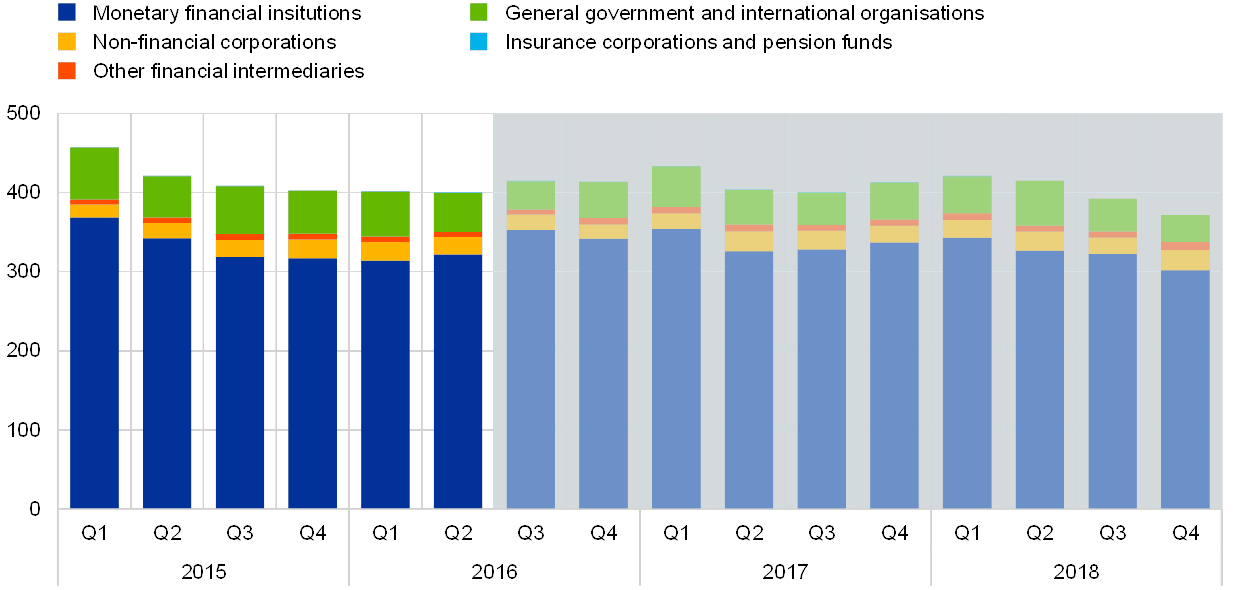
Source: ECB.Note: The period under review is indicated by a light blue background.
NEU CP outstanding amount by sector
(EUR billions, average per quarter)
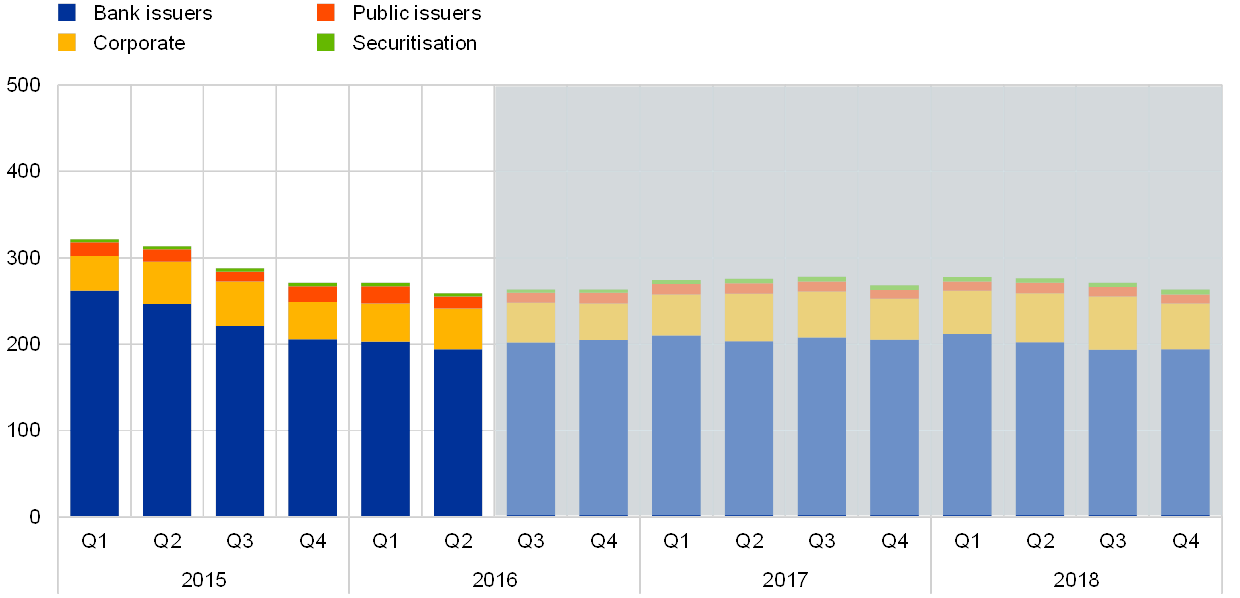
Source: ECB.Note: The period under review is indicated by a light blue background.
About 70% of STEP paper is denominated in euro, while most other paper is denominated in US dollars or pounds sterling (see Chart 59).
STEP outstanding amount by currency
(EUR billions, average per quarter)
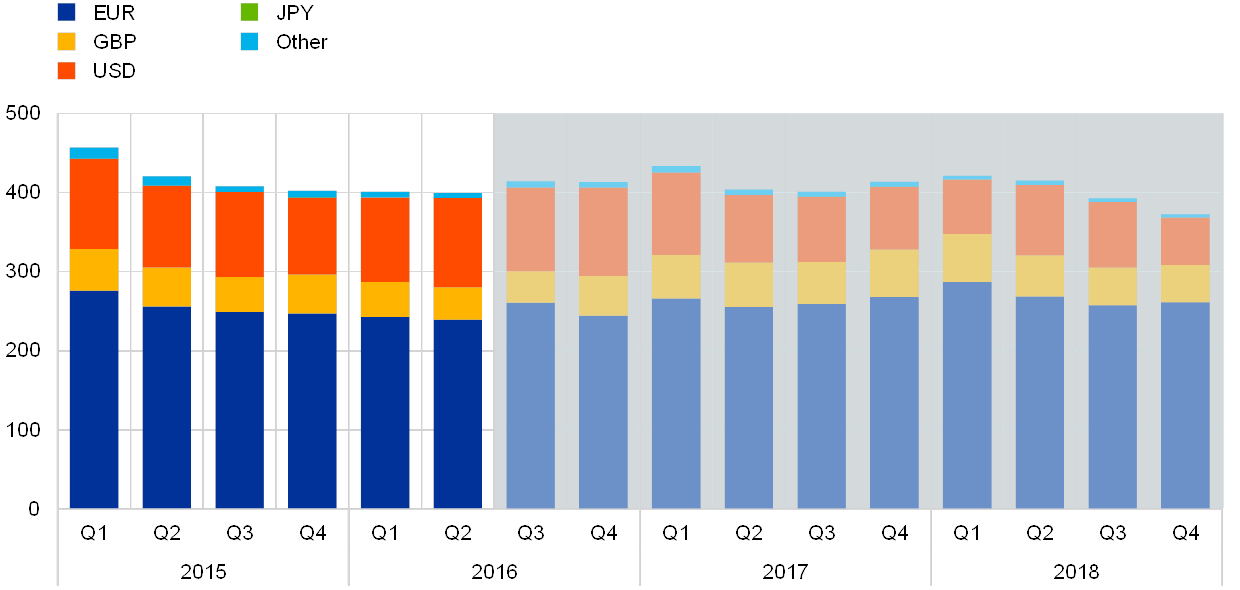
Source: ECB.Note: The period under review is indicated by a light blue background.
5.4 Maturities
Issuance of STEP paper has been relatively stable over the different tenor buckets (see Chart 60). The distribution of issuances over the different tenor buckets also remained relatively stable, with the exception of the first quarter of 2017, when there was an increased issuance of STEP paper with short maturities (0-7 days).
STEP issuance by tenor
(EUR billions, per quarter)
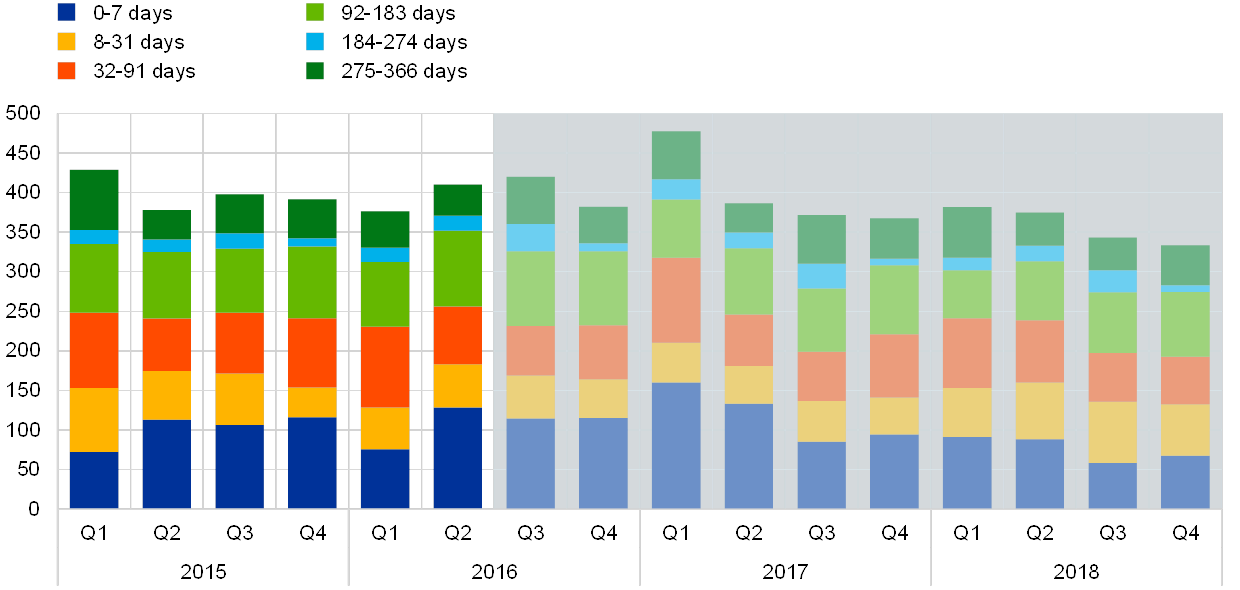
Source: ECB.Note: The period under review is indicated by a light blue background.
From 2016 to 2018 the STEP yield curve moved upwards (see Chart 61). The yield curve has a classical positive slope. For most maturity buckets, rates increased over the period under review, except for the 0-7 day bucket where this is less pronounced.
STEP yield curve and volume by tenor
(x-axis: tenor, days; y-axis: left-hand scale: percentages; right-hand scale: EUR billions, per quarter)
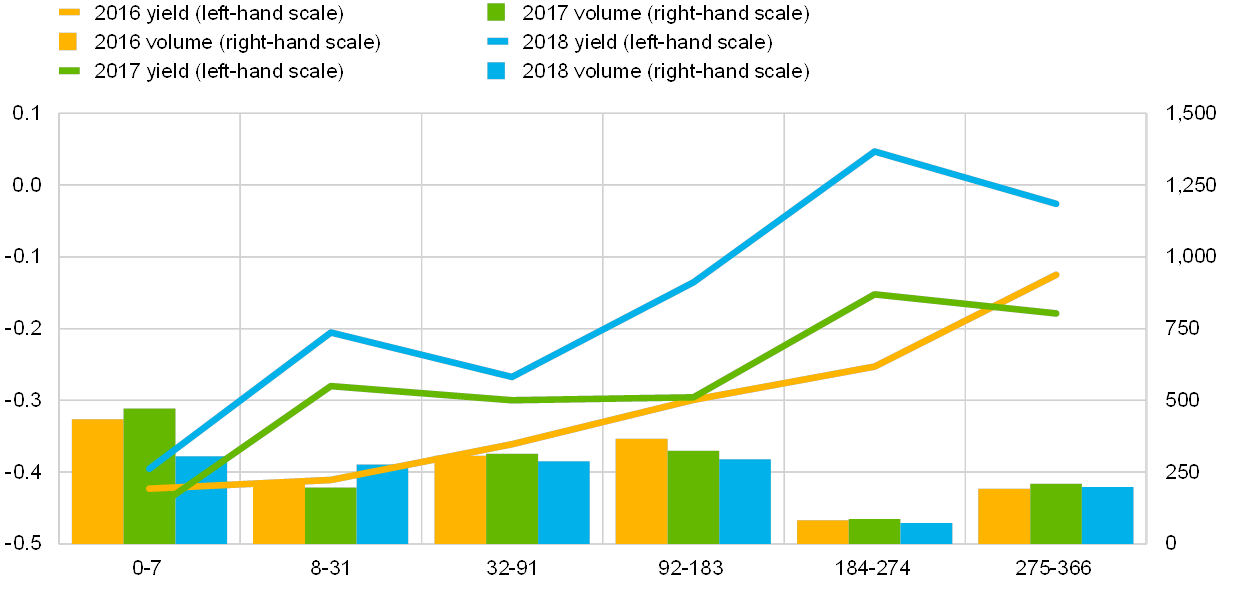
Source: ECB.
Appendix
Money market statistical reporting
MMSR collects daily data on transactions conducted by the largest banks in the euro money market. The data are aimed at (i) achieving a better understanding of how money markets work and evolve; (ii) providing relevant and timely information on the monetary policy transmission mechanism, as well as information on market expectations about the future trajectory of policy rates; and (iii) providing more information to market participants on the functioning of the money markets. For this reason, MMSR data have daily frequency and contain transaction-by-transaction information. Data collection takes place on the basis of the MMSR Regulation.[20] Regular data collection is conducted by the ECB with the support of several NCBs. Data are required to be reported to the ECB every day by 07:00. Daily data collection started on 1 July 2016, following a three-month interim period. The 50[21] largest[22] credit institutions in the euro area (which are resident in a total of ten euro area countries) participate in the data collection. The names and countries of residence of the banks contributing to MMSR data are shown in Figure A.1.[23]
MMSR data cover four segments of the euro money market: unsecured transactions, secured transactions, foreign exchange swaps (FX swaps) and overnight index swaps (OIS). The common characteristic of the transactions reported for the different segments is that they all have a maturity of less than one year.[24] Both incoming and outgoing transactions are reported, which means both lending and borrowing transactions for the secured and unsecured segments, both selling and buying of foreign currency for the FX swaps segment and both paying and receiving of fixed interest rates for the OIS segment. Transactions are reported for trades conducted with selected non-retail counterparties, such as MFIs and a range of other financial and non-financial institutions, including governments.[25] Each segment covers a number of instruments and has its own reporting features. Table A.1 lists the main characteristics of the transactions reported for each segment.
In addition to being a collection of timely and granular information, MMSR data also contain quite a lot of detail on the transactions reported. For each transaction, banks are required to provide details such as the trade date, the maturity structure (settlement date, maturity date), the turnover (the amount involved in the transaction) and the valuation (the interest rate for the secured and unsecured segments, the fixed interest rate underlying the contract for the OIS, and the spot exchange rate and forward points for the FX swaps). Reporting agents also have to provide details of the counterparty involved in the transaction (or of the tri-party agent in the case of tri-party repos in the secured segment). Where available, the counterparty has to be identified by its unique legal entity identifier (LEI).[26] Otherwise, reporting agents report the sector and country of residence of the counterparty. Some segment-specific information is also available, such as the security employed as collateral in a secured transaction, identified by its international securities identification number (ISIN). Table A.2 provides a summary of the main information available in the MMSR data.
Reporting agents contributing to MMSR
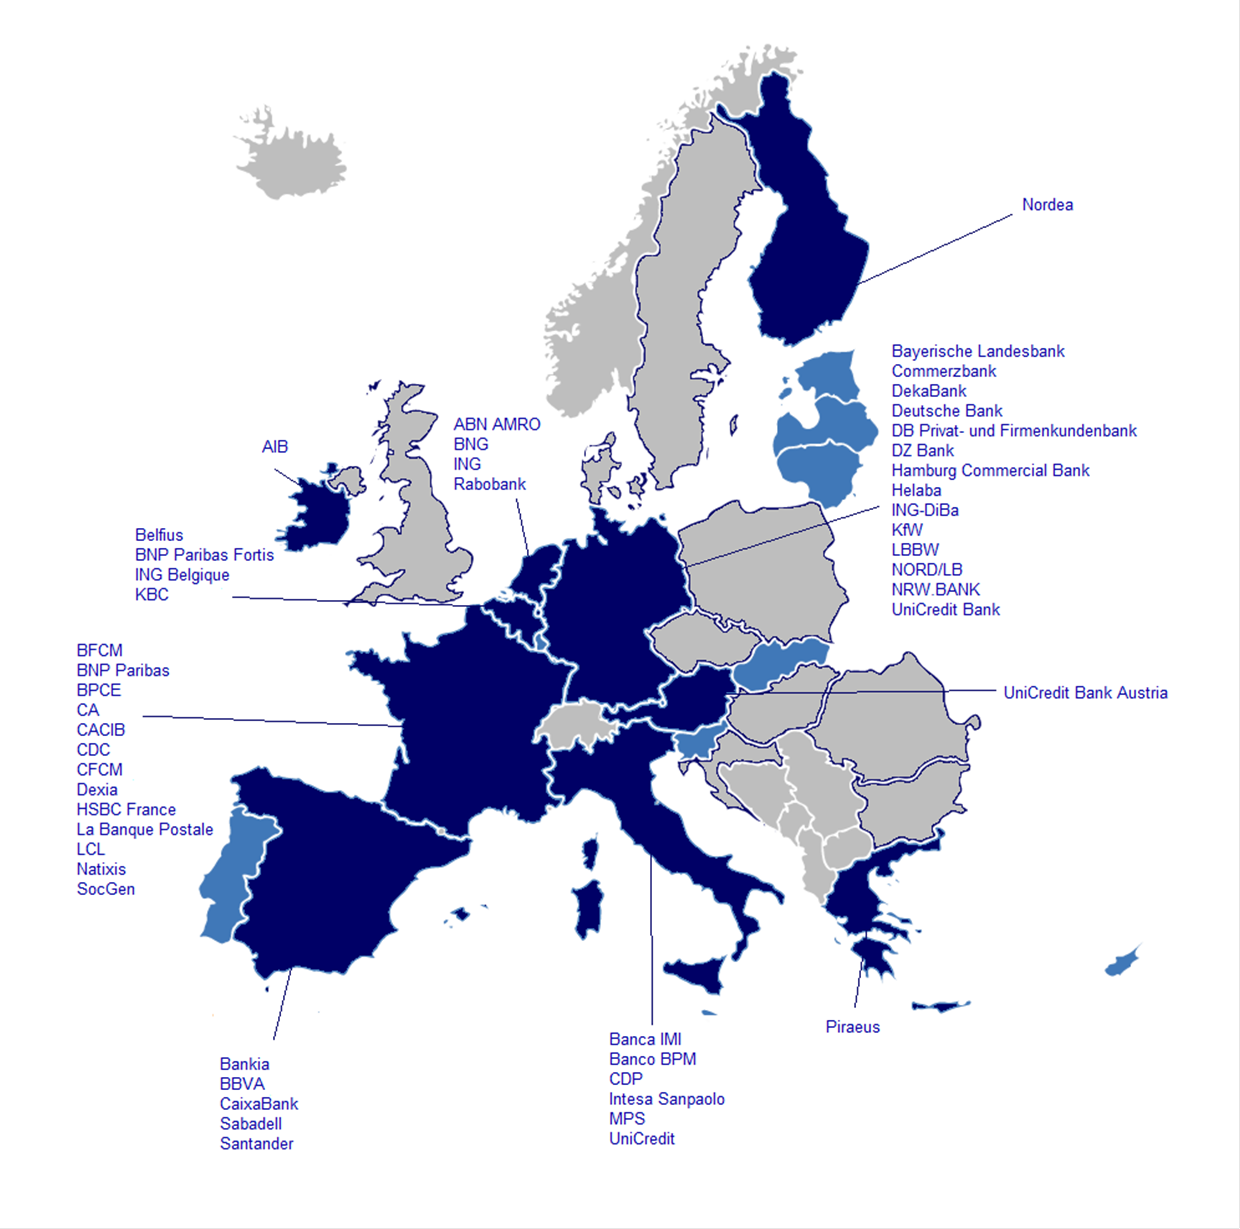
Source: ECB.Note: Further information is available on the ECB’s website.
Scope of reporting for the four market segments included in MMSR
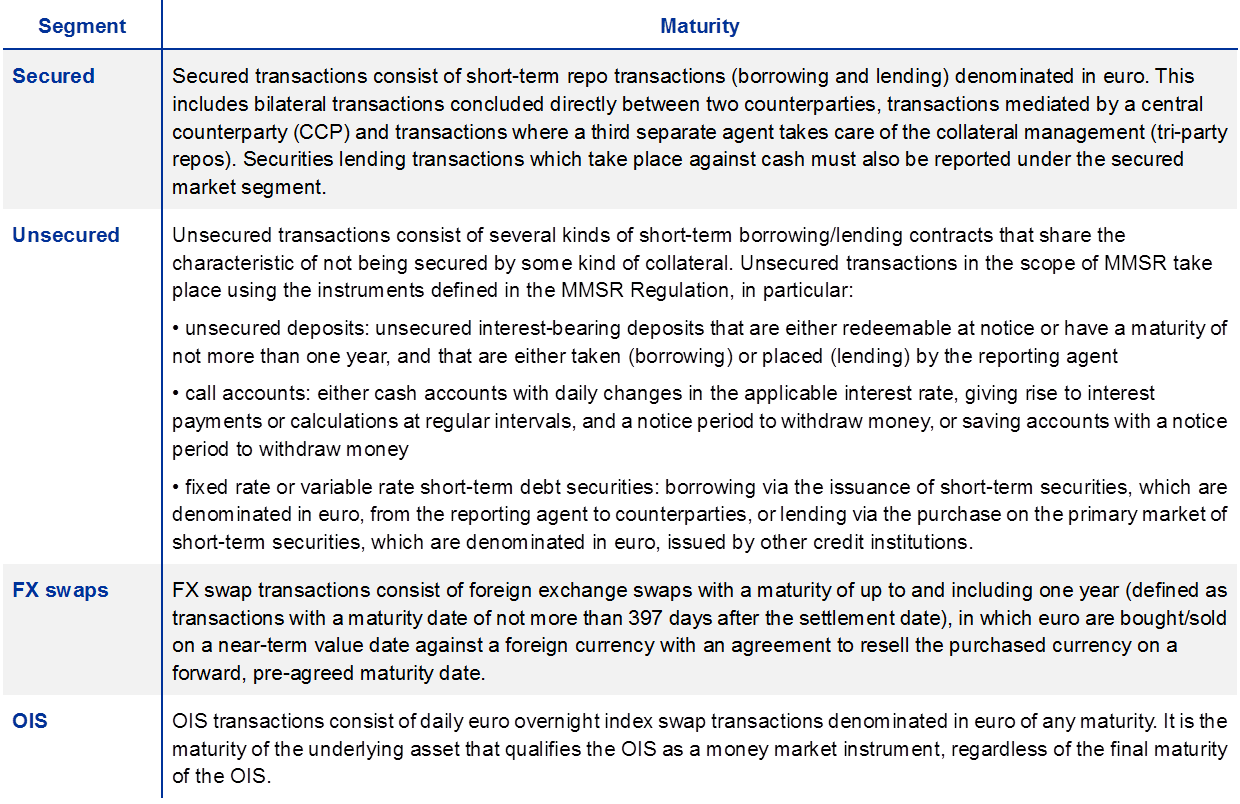
Main information available in MMSR
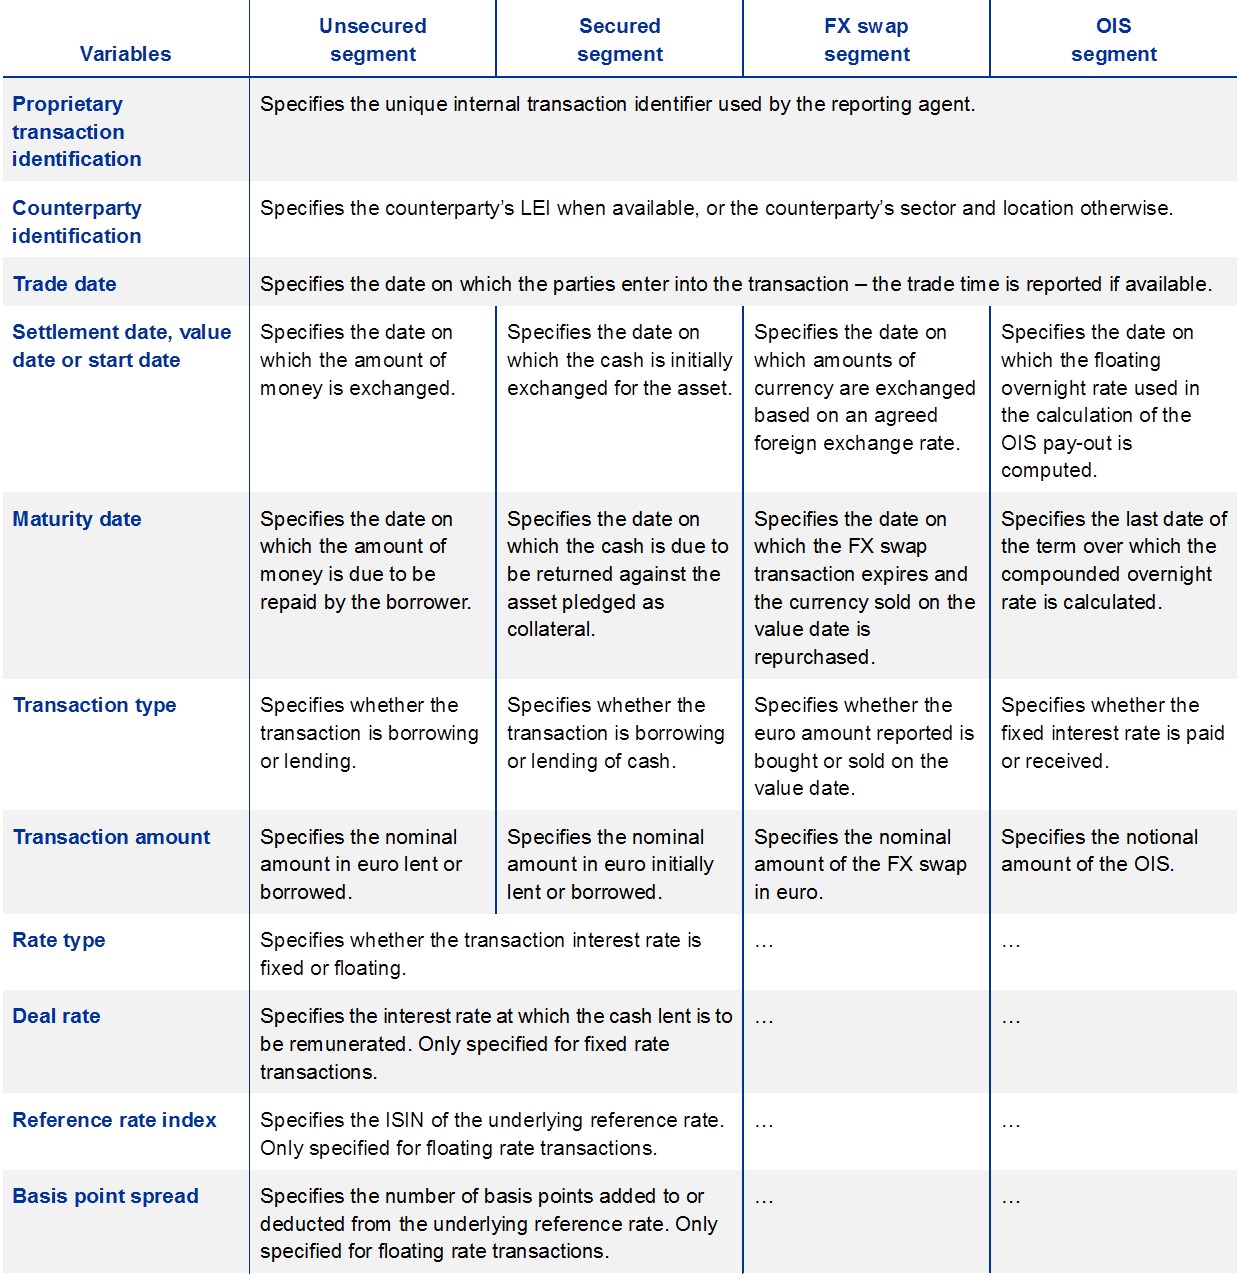
Source: ECB.Note: The above table is a selective and abbreviated overview of the variables reported to the ECB in the context of MMSR. For a comprehensive overview, please refer to the MMSR reporting instructions, available on the ECB’s website.
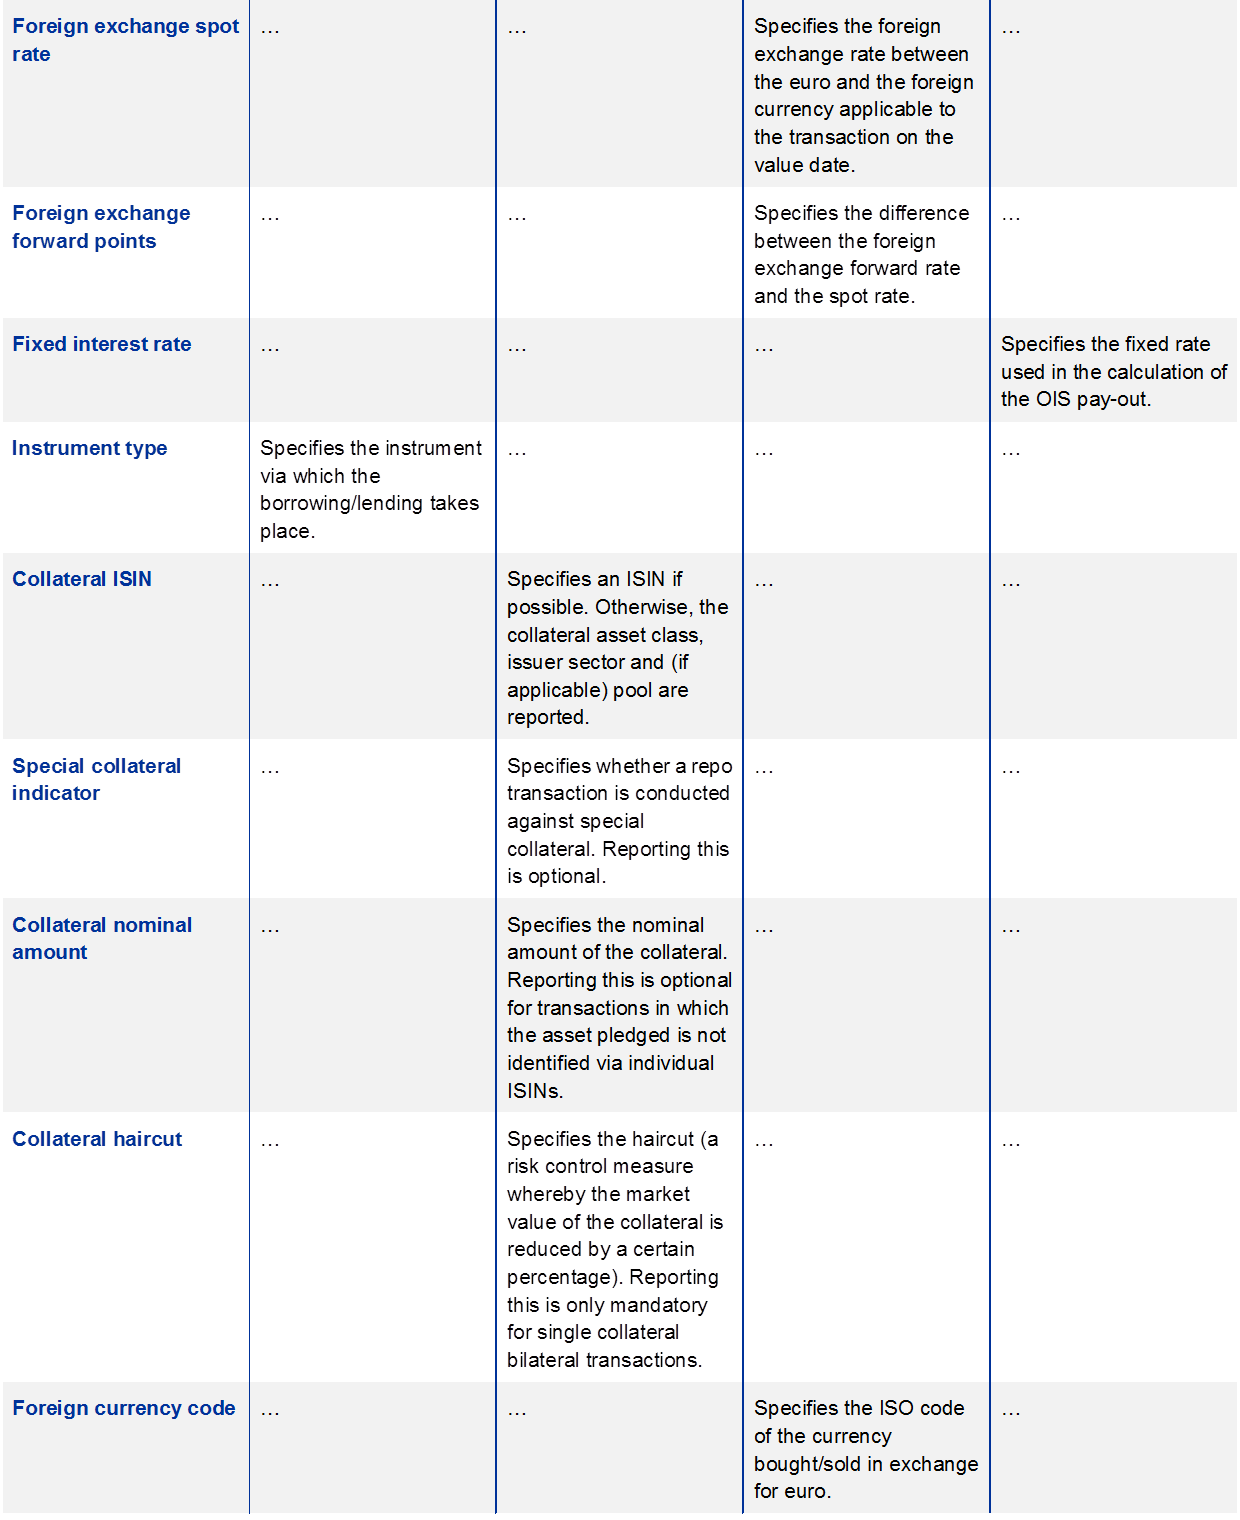
Box 1 The EONIA and OIS markets
This box describes recent developments in the euro overnight index average (EONIA) and overnight index swap (OIS) markets. Unsecured money market volumes underlying EONIA have gradually decreased as a result of the abundant availability of central bank liquidity since 2008 amid cuts in policy rates to unprecedented levels and a decline in the number of EONIA panel banks. The derivatives segment (OIS) also experienced a decline in volumes, reflecting lower interest rate volatility as a result of the ECB’s forward guidance and the abundant excess liquidity which brought overnight money market rates close to the Eurosystem’s deposit facility rate (DFR). However, despite the lower activity in the OIS market as well as in the EONIA’s underlying market, episodes of volatility in the EONIA rate in late 2017, which were followed by prompt adjustments in the OIS curve, demonstrated that the link with the derivatives market remains robust.
The EONIA is among the main interest rate benchmarks for the euro and is used not only as a reference rate in a great number of spot and derivative contracts in the euro area but also for valuations and remuneration of collateral. It is computed as a volume-weighted average of all overnight unsecured lending transactions in the interbank market undertaken within the EU and EFTA. The panel of contributors currently consists of 28 banks from 13 EU countries.[27] MMSR data provided by the 50 largest euro area banks indicate significant market exposure to EONIA: the outstanding amount of unsecured money market instruments indexed to EONIA is estimated at around €450 billion at the end of 2017, while the use of EONIA in the OIS market exceeds €5.2 trillion. In the light of the significance of the rate for the euro area money markets, EONIA was designated as a critical benchmark[28] on 28 June 2017.[29]
EONIA developments
The overnight unsecured lending activity reported by EONIA panel banks reached its historical high just before the onset of the global financial crisis (see Chart A). On 9 October 2007 the EONIA reported volumes were €82 billion; at that time the excess liquidity in the euro area banking system was close to zero and the EONIA rate was ranging in the middle of the monetary policy corridor, anchored to the ECB’s main refinancing operations (MRO) rate, as is typically the case in neutral liquidity conditions. The chart summarises developments in EONIA volumes and the evolution of excess liquidity in the Eurosystem.
Chart A
Evolution of excess liquidity and EONIA volumes
(EUR billions)

Sources: EMMI and Bloomberg.Note: The period under review is indicated by a light blue background.
After the start of the 2008 financial crisis, the activity underpinning EONIA gradually declined as a result of increased risk aversion, which shifted unsecured interbank activity to the secured segment, the changing regulatory environment, and the ample liquidity made available by the ECB to the banking system, which reduced the need for overnight funds. The daily average EONIA volume decreased from €48 billion in 2007 to slightly above €38 billion between January 2008 and December 2011. The EONIA contributors further reduced their activity to a daily average of €24 billion between 2012 and the end of 2014 as the ECB injected more than €1 trillion of liquidity into the banking system via the three-year longer-term refinancing operations (LTROs) (conducted in December 2011 and February 2012), making it no longer necessary for some banks to source liquidity in the interbank market.
In 2018 EONIA volumes reached a historical low as excess liquidity grew above €1.9 trillion, provided through the ECB’s targeted longer-term refinancing operations (TLTROs) and the APP. The large supply of central bank reserves (combined with the ongoing lack of trust between market participants and increasing regulatory restrictions) resulted in a reduction in unsecured market activity; EONIA volumes dropped significantly from a daily average of €7.2 billion in 2017 to a historical daily low of €488 million in October 2018.
Low cash market volatility and OIS volume contraction
Since September 2014 the decline in the activity underlying EONIA has coincided with a shift in the EONIA rate towards the floor of the ECB monetary policy corridor and a substantial reduction in its volatility (see Chart B).[30] The chart shows the evolution of the EONIA since January 2010, together with the ECB monetary policy corridor and the evolution of the one-year/one-year forward EONIA swap rate – the expected yearly average benchmark in one year’s time. Following the ECB’s first TLTRO in September 2014, EONIA started to move towards the DFR; at the same time its volatility gradually declined to historically low levels during 2018.
Chart B
Evolution of spot and forward EONIA compared to the ECB corridor
(percentages)

Sources: EMMI, Bloomberg and ECB.Note: MLF – marginal lending facility; MRO – main refinancing operations.
Market expectations for the evolution of the EONIA rate, captured by the OIS market, remained well anchored to the ECB’s forward guidance (see Chart C). The ECB began issuing forward guidance in July 2013 when the ECB’s Governing Council said that it expected interest rates to remain low for an extended period of time. As a consequence, medium and longer-term OIS rates declined. The degree of decrease was such that the OIS curve became flat, or at times inverted (i.e. negative slope), correctly anticipating cuts in the DFR.[31]
Chart C
Evolution of EONIA OIS market
(left-hand scale: percentages; right-hand scale: EUR billions)
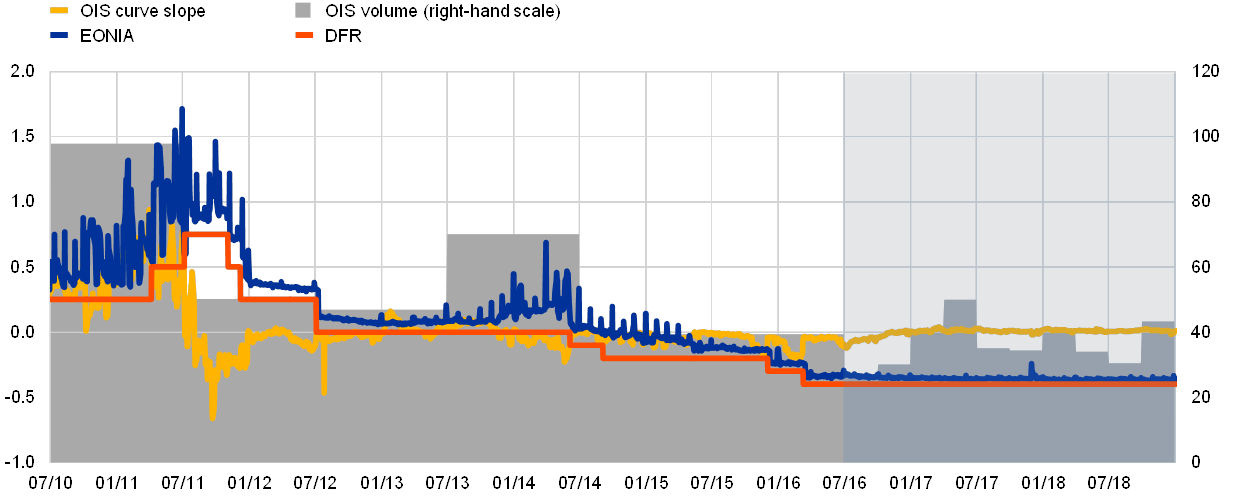
Sources: ECB (EMMS and MMSR) and Bloomberg.Notes: The OIS curve slope is calculated as the difference between the one-week and one-year EONIA OIS contracts. The shaded areas approximate the volumes exchanged in the OIS market based on the quarterly information in the EMMS until 2015 and MMSR from the third quarter of 2016 onwards (indicated by a light blue background). The quarterly volumes are transformed into daily equivalents assuming constant activity over the relevant periods. An overlapping sample of 38 banks was used.
Activity in the EONIA OIS market declined in response to the low volatility in the unsecured market and very stable expectations on the future path of short-term money market rates (owing to forward guidance) which, in turn, decreased the need to hedge interest rate risk (see Chart C). The market share of the OIS segment peaked in 2003 with volumes above €10 trillion in the second quarter.[32] Despite a temporary decline over the subsequent two years, the nominal amount of EONIA OIS contracts still remained above €8 trillion in the second quarters of 2006 and 2007. Over the following decade, activity in the OIS market gradually declined again, reaching a historical low in the second quarter of 2016. Although information on the nominal amount exchanged in the OIS market prior to the introduction of MMSR is limited, the chart shows that the spikes in OIS activity broadly coincided with periods in which expectations were revised and markets exhibited higher volatility.
OIS market response to EONIA volatility events
On 29 November 2017, the EONIA rate was set at -30.1 bps, 6.1 bps higher than the previous day,[33] amid broadly stable volumes of €7.2 billion. The next day, the benchmark rate further increased by 6 bps, fixing at -24.1 bps.[34] Thereafter the rate fluctuated around -32 bps until 12 December 2017, when it set at -34.5 bps, closer to the 2017 historical average.
Chart D
EONIA OIS curve reaction to EONIA spike in late 2017
(left panel: percentages; right panel: basis points)
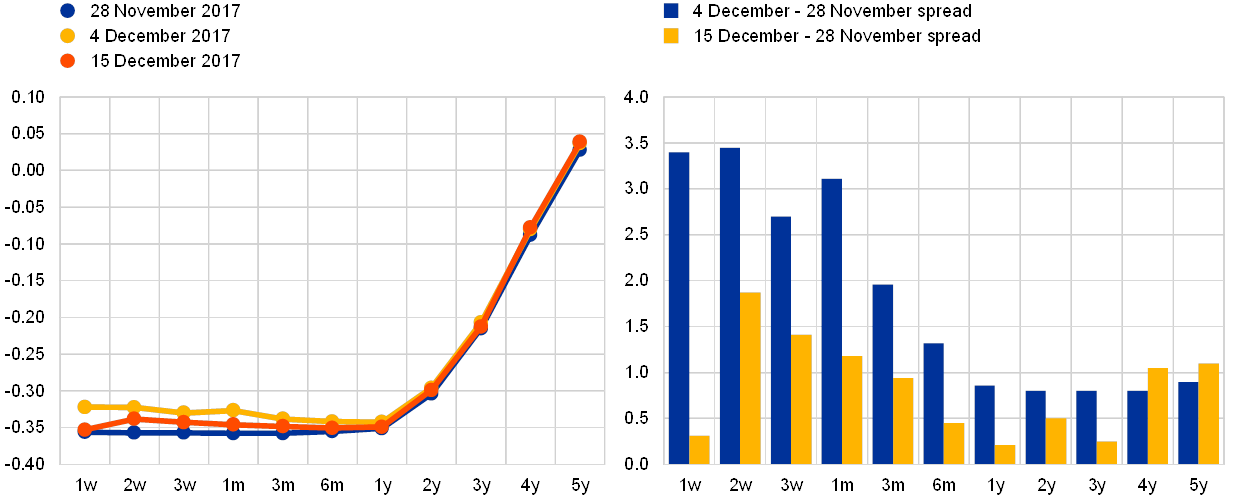
Source: Bloomberg.
The responsiveness of EONIA OIS activity to changes in the EONIA rate shows that the link between the derivatives and cash markets remained robust, despite the low EONIA volume, the high excess liquidity and the forward guidance (see Charts D and E). Chart D compares the EONIA OIS spot curve on 28 November 2017, one day before the EONIA spike, with the curves on 4 and 15 December 2017. The sharp increase in the benchmark affected short-term expectations most, producing a sizeable upward shift (about 3.5 bps) in the EONIA OIS curve for tenors of up to three months. The milder impact for longer tenors indicates that the market expected the increase in the EONIA rate to be short lived. As previously mentioned, the longer part of the curve does not respond to changes in the cash market perceived as temporary, but only to changes in monetary policy expectations. As the EONIA began to return towards the levels seen in mid-December 2017, the OIS rate also moved lower, re-aligning with the previous market conditions. The movement in the EONIA OIS curve coincided with a sharp increase in the volume of contracts exchanged, probably driven by a desire to hedge against the movement of EONIA. Chart E shows the total nominal amount of OIS transactions reported by MMSR banks. On 30 November and 1 December 2017 – the days following the first two spikes in the EONIA fixing – activity increased to €110 billion and €185 billion, respectively. This compares with average daily activity of €27 billion in the month of November 2017.
Chart E
Daily EONIA evolution and OIS market activity
(left-hand scale: EUR billions, right-hand scale: percentages)
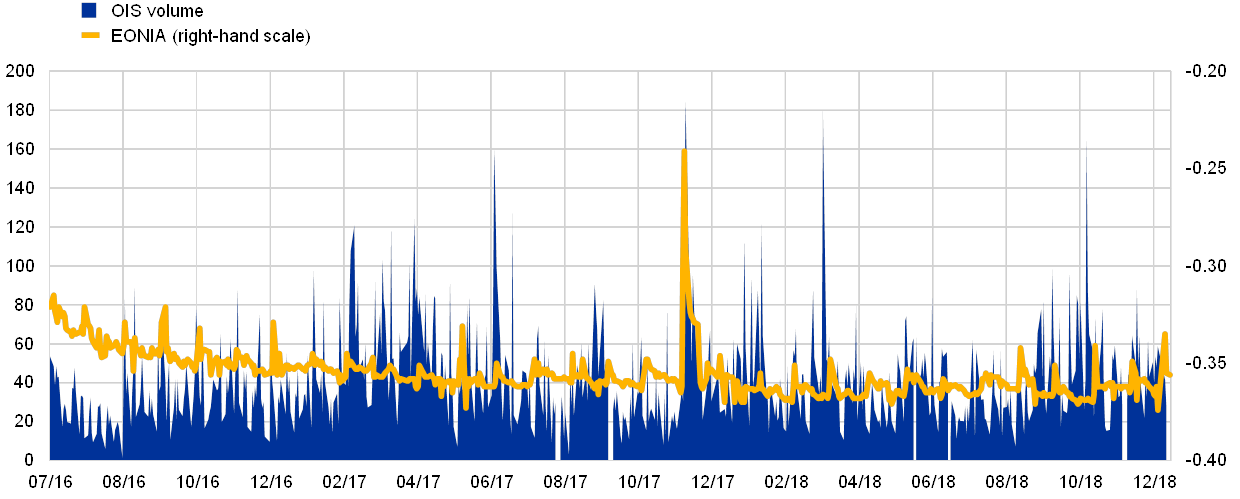
Source: ECB (MMSR).
Conclusion
Following the 2008 financial crisis, volumes in the unsecured interbank market decreased as risk aversion shifted bank activity toward the secured segment. In addition, liquidity injected by the ECB through its non-standard measures further contributed to the decline in EONIA volumes, which reached a historical low in 2018. Activity in the EONIA OIS market also declined in response to the low volatility in unsecured cash market rates and stable expectations for the future path of short-term rates. Nevertheless, the responsiveness of EONIA OIS activity to spikes in the EONIA rate indicates that, despite the low underlying volume for EONIA, high excess liquidity and forward guidance, the link between the derivatives and cash markets remains robust.
© European Central Bank, 2019
Postal address 60640 Frankfurt am Main, GermanyTelephone +49 69 1344 0Website www.ecb.europa.eu
All rights reserved. Reproduction for educational and non-commercial purposes is permitted provided that the source is acknowledged.
The tables and graphs included in this study abide by the statistical confidentiality rules laid down in European legislation.
For specific terminology please refer to the ECB glossary (available in English only).
PDF ISBN 978-92-899-3398-8, ISSN 1830-3781, doi:10.2866/927342, QB-XX-18-001-EN-NHTML ISBN 978-92-899-3963-8, ISSN 1830-3781, doi:10.2866/950959, QB-XX-18-001-EN-Q
- [1]For further details, see Eisenschmidt, J., Kedan, D., Schmitz, M., Adalid, R. and Papsdorf, P., “The Eurosystem’s asset purchase programme and TARGET balances”, Occasional Paper Series, No 196, ECB, 2017.
- [2]Non-operational deposits below 30 days require a 40% buffer of liquid assets and operational deposits require 25%.
- [3]For further details, see Baldo, L., Hallinger, B., Helmus, C., Herrala, N., Martins, D., Mohing, F., Petroulakis, F., Resinek, M., Vergote, O., Usciati, B. and Wang, Y., “The distribution of excess liquidity in the euro area”, Occasional Paper Series, No 200, ECB, 2017.
- [4]Regulation (EU) No 648/2012 of the European Parliament and of the Council of 4 July 2012 on OTC derivatives, central counterparties and trade repositories (OJ L 201, 27.7.2012, p. 1).
- [5]The period considered runs from July 2016 to November 2018. The month of December is excluded owing to year-end effects.
- [6]See the special feature entitled “Cross-border banking in the euro area since the crisis: what is driving the great retrenchment?” in Financial Stability Review, ECB, November 2017.
- [7]See the appendix on MMSR data description for definitions of maturity buckets.
- [8]See the relevant BIS statistics.
- [9]Under the reform, prime funds would no longer guarantee the traditional USD 1 per share and would need to temporarily suspend withdrawals or impose withdrawal fees if liquid assets declined sizeably.
- [10]Forward points are the number of basis points added to or subtracted from the current spot rate of a currency pair to determine the forward rate for delivery on a specific value date. These points are mathematically derived from interest rate differentials for the currencies and maturity involved. When points are added to the spot rate (expressed usually in units of 1 out of 10,000) this is called a forward premium and it indicates that the currency sought is more expensive in relative terms; when points are subtracted from the spot rate it is a forward discount, and it indicates that currency sought is less expensive in relative terms. The forward rate is based on the difference between the interest rates of the two currencies involved in a deal and the time until the maturity of the deal.
- [11]It is worth noting that there was also a sharp rise in the middle of December 2017, but that the market had somewhat normalised again by the year-end.
- [12]Covered interest parity (CIP) implies that the interest rates priced in cash/bond markets correspond to the interest rates implicit in FX swap markets for the respective currencies. In the event that these rates do not correspond to the FX forward rate, an opportunity would exist for a party to generate a risk-free profit.
- [13]The fact that there are banks who participate in the operation in circumstances where it is not economically beneficial to do so (and in fact it is more favourable to resort to the FX swap market) suggests that a limited number of banks do not participate on the basis of economic considerations. Other considerations for participating in the operation, in addition to market funding costs, may be related to convenience owing to lack of infrastructure, testing the facility, lack of relationships with FX swap dealers, balance sheet implications of the operation format (US dollar repo, with balance sheet enlargement effects), or simply an inability to source relatively small amounts of US dollars at competitive prices. However, it is worth noting that counterparties occasionally refer to stigma preventing them taking recourse to this operation, including at times when it would be more economically beneficial than market pricing.
- [14]See Draghi, M., “Accompanying the economic recovery”, speech at the ECB Forum on Central Banking, Sintra, 27 June 2017.
- [15]See “Account of the monetary policy meeting”, account of the Governing Council meeting held on 13-14 December 2017, published 11 January 2018.
- [16]See Praet, P., “Monetary policy in a low interest rate environment”, speech at the Congress of Actuaries, Berlin, 6 June 2018.
- [17]See Monetary policy decisions, 14 June 2018, in particular the statement “The Governing Council expects the key ECB interest rates to remain at their present levels at least through the summer of 2019”.
- [18]See “Clearing obligation (under art. 4 of EMIR)”, EMIR Reporting Ready.
- [19]In June 2016 the French TCN market was replaced by the NEU CP and NEU MTN markets.
- [20]Regulation (EU) No 1333/2014 of the European Central Bank of 26 November 2014 concerning statistics on the money markets (ECB/2014/48) (OJ L 359, 16.12.2014, p. 97), as amended by Regulation (EU) 2015/1599 (ECB/2015/30) (OJ L 248, 24.09.2015, p. 45) and Regulation (EU) 2019/113 (ECB/2018/33) (OJ L 23, 25.1.2019, p. 19).
- [21]Please note that, while originally 53, the current number of reporting agents is 50.
- [22]Largest in terms of total balance sheet assets.
- [23]A full list of reporting agents is available on the ECB’s website.
- [24]More precisely, 397 days, in line with the ESMA definition of short-term financial instruments. For the OIS segment only, all swaps contracts tied to the unsecured overnight rate are considered as short-term irrespective of their maturity.
- [25]More precisely, transactions are reported when conducted with financial corporations (except central banks where the transaction is not for investment purposes), general government or NFCs classified as “wholesale” according to the Basel III LCR framework. Lending transactions in the unsecured segment are only reported when the counterparty is a credit institution.
- [26]The LEI is a 20-digit, alpha-numeric code that connects to key reference information and allows clear and unique identification of companies participating in global financial markets.
- [27]The number of contributors has fallen in recent years. In 2012 the EONIA panel consisted of 44 banks from EU countries, as well as large international banks from non-EU countries with important euro area operations. In 2015 the number of contributors declined to 36. Since July 2017 the EONIA panel has included 28 credit institutions from EU countries. For a list of contributors, see the European Money Markets Institute (EMMI) website.
- [28]In accordance with Article 20(1) of Regulation (EU) 2016/1011, a benchmark is considered to be a critical benchmark if it is used directly or indirectly within a combination of benchmarks as a reference for financial instruments or financial contracts or for measuring the performance of investment funds, having a total value of at least €500 billion on the basis of all the ranges of maturities or tenors of the benchmark.
- [29]Commission Implementing Regulation (EU) 2017/1147 amended, by including EONIA, Commission Implementing Regulation (EU) 2016/1368, which established the list of critical benchmarks used in financial markets pursuant to Regulation (EU) 2016/1011.
- [30]The same happened after the introduction of the three-year LTROs in 2011. The EONIA rate movements dis-anchored from the main refinancing rate as excess liquidity exceeded €400 billion in the autumn of 2011. In the following three years the benchmark moved back towards the main refinancing rate ahead of the first series of TLTROs in 2014.
- [31]In fact, the series of DFR cuts since 2011 have always been foreshadowed in a change in the shape of the EONIA OIS curve ahead of the ECB action. On such occasions the slope of the curve (defined as the difference between the one-year and the one-week EONIA swap rates) turned negative to reflect the downward revision of expectations for the future EONIA rate.
- [32]The volumes referred to here are those reported by the common sample of banks participating in both the EMMS and MMSR.
- [33]The fluctuation in the EONIA rate was the highest recorded since March 2016, when the DFR was set at -40 bps.
- [34]The ECB, as calculating agent, has confirmed that the EONIA rate was correct and had been calculated according to the input received. The EMMI, in its capacity as benchmark administrator, has performed an independent follow up with members of the EONIA panel to understand the movements in the rate.