


Published as part of the ECB Economic Bulletin, Issue 5/2022.
The ECB Consumer Expectations Survey (CES) asked households in 2020 and 2021 about their saving behaviour and the underlying motives. Some special-purpose questions were fielded asking households whether in 2020 they saved or dissaved, by how much and why they did so. The answers to these questions provide information about the drivers of the increase in savings recorded in euro area aggregate data.[1]
The data show that during the coronavirus (COVID-19) pandemic most households were not able to increase their savings. Chart A (panel a) shows that most households did not change the amount of savings they held in the course of 2020, while about 20% increased and around 16% decreased their stock of savings. The drivers of households’ saving behaviour differed across savers and dissavers (Chart A, panel b). On one hand, for those who saved, COVID-19-related restrictions/fear of infection and precautionary motives were the most important reasons.[2] On the other hand, among those who dissaved, an unexpected income loss was cited as the most important reason. Many dissavers also referred to COVID-19-related reasons (e.g. the incurrence of additional expenses) for having to draw on their savings. Overall, these findings are in line with earlier evidence suggesting that the surge in the aggregate saving ratio was driven mostly by involuntary savings due to COVID-19 restrictions and the fear of getting infected but that precautionary motives also played a significant role.[3]
Chart A
Savers/dissavers and motives for saving/dissaving
a) Savers and dissavers
(left-hand scale: percentages of respondents; right-hand scale: percentages of respondents within specific group)
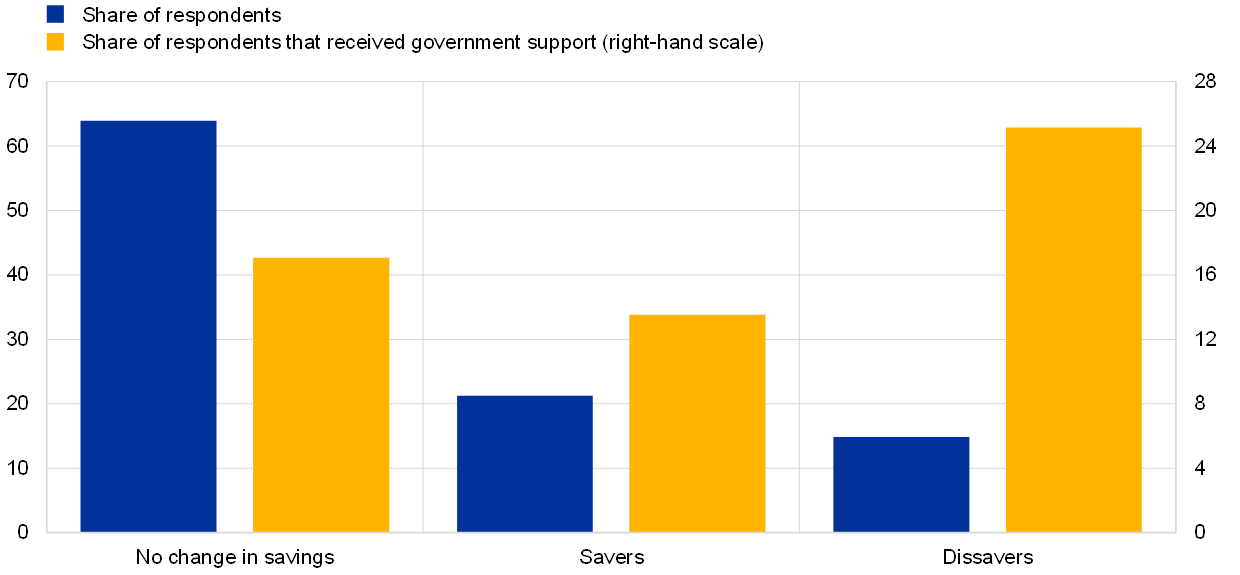
b) Motives for saving/dissaving
(percentages of savers/dissavers)

Source: ECB (CES).
Notes: Weighted data. Panel b shows the share of respondents reporting that (one or more) specific reasons were the most important for their saving behaviour.
Dissavers generally received more government support, were more often liquidity-constrained and had a higher marginal propensity to consume (MPC) than savers. Combining the information above with information from regular CES survey modules allows an economic profile of saving/dissaving households to be sketched. This confirms that COVID-19-related government support was mainly targeted at households that had to draw on their savings, as they were adversely affected by the pandemic. At the same time, households who saved tended to be less liquidity-constrained and had a lower MPC. This arguably limited the upward pressure on consumption from the expected unwinding of household savings as the pandemic started to subside.
The bulk of accumulated COVID-19-induced savings were not expected to be spent until at least the spring of 2022. In March 2021 the survey asked respondents two specific questions about their savings: (i) how much have you saved (dissaved) since January 2020; and (ii) how, over the next twelve months, do you plan to use (react to) the (reduced) amount of savings or financial investments you have accumulated since the start of 2020? Combining the replies to these questions allowed the share of accumulated net savings that households planned to consume in the following year to be computed (Chart B). The results may also capture some savings that are being spent on regular planned consumption, in particular on big-ticket items. Chart B indicates that respondents in March 2021 expected at least 74% of excess net savings accumulated since January 2020 not to be spent within the next 12 months, thus tempering expectations of widespread pent-up demand.
Chart B
Allocation of net savings in the next 12 months
(percentages of net savings)
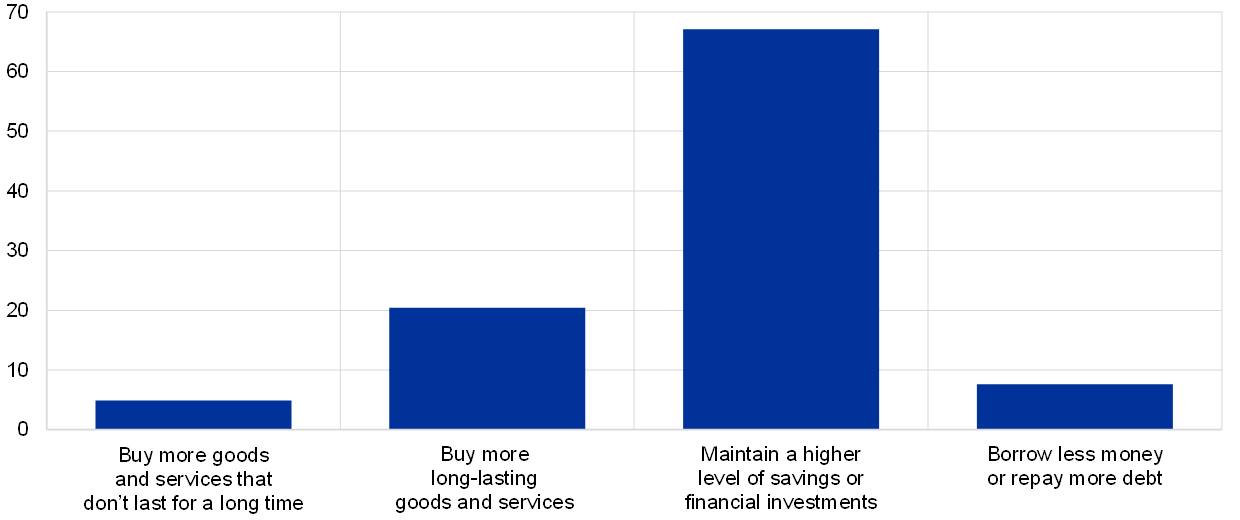
Source: ECB (CES, March 2021).
Notes: Weighted data. Net savings are the difference between the amount saved and dissaved since January 2020. The bars represent the share of net savings allocated to each of the options.
Households were also asked about their consumption compared to the pre-COVID-19 period. In July 2021 the CES asked respondents how their past (future) consumption compared (would compare) to pre-pandemic levels.[4] The majority of households reported that their consumption in the 12 months preceding July 2021 was similar to their typical consumption before the pandemic (Chart C, panel a).[5] More than 30% of households reported that their consumption had been lower than in the pre-COVID-19 period, while less than 15% reported that their consumption had been higher than before the pandemic. These responses were in line with the observed drop in aggregate consumption relative to the pre-pandemic period. The downward adjustment in spending relative to pre-pandemic levels was more evident among households that had saved (“savers”), and even more so among households reporting that COVID-19-related reasons, such as government restrictions or the fear of infection, had been the most important reason for saving during the pandemic (“COVID-19 savers”) (Chart C, panel a). This corroborated the finding that a significant part of additional savings had been driven by households who had to reduce their consumption due to restrictions on various types of consumption (“involuntary savings”).
Chart C
Consumption compared to the pre-COVID-19 period
a) Consumption in past 12 months
(percentages of respondents within specific group)

b) Consumption in next 12 months
(percentages of respondents within specific group)

Source: ECB (CES, July 2021).
Notes: Weighted data. To distinguish different types of savers, questions on savings from the July 2021 CES have been used.
When asked about their future spending plans, most consumers expected to return to their pre-COVID-19 levels of consumption. In addition, the share of consumers reporting that they would consume less than in the pre-pandemic period exceeded the share of consumers that expected to consume more (Chart C, panel b). While the evidence shows that government restrictions/fear of infection contributed to savings, such motives were expected to diminish in importance, especially after the summer of 2021 when a significant part of the population started to be vaccinated and lockdowns became less severe. Nevertheless, the finding that households remained cautious about increasing their spending after the summer of 2021 suggests that households continued to have a strong precautionary motive driven mainly by pandemic-induced financial concerns and surrounding uncertainty.[6] Overall, the results from the July 2021 CES did not suggest that widespread pent-up demand would provide an immediate boost to aggregate consumption, especially if household concerns about their finances did not diminish.[7] As the survey was conducted in mid-2021, this may also have reflected expectations of a further wave of COVID-19, which to a large extent has taken place.
The concentration of pandemic-related savings among specific households limits the extent to which these savings can buffer the recent surge in energy prices. As documented before, the households that managed to save during the COVID-19 pandemic represent only about 20% of the population. Moreover, these households are less exposed to energy-intensive consumption items than the average of all households (Chart D). This applies even more to COVID-19 savers. This is in line with other evidence from the CES that higher-income households tend to spend a lower share of their income on energy-intensive consumption.[8] The distribution of savings accumulated during the COVID-19 pandemic may thus limit the extent to which these savings can shield the ongoing recovery of consumption from the adverse impact of the recent surge in energy prices.
Chart D
Exposure to energy-intensive consumption
(share of income)
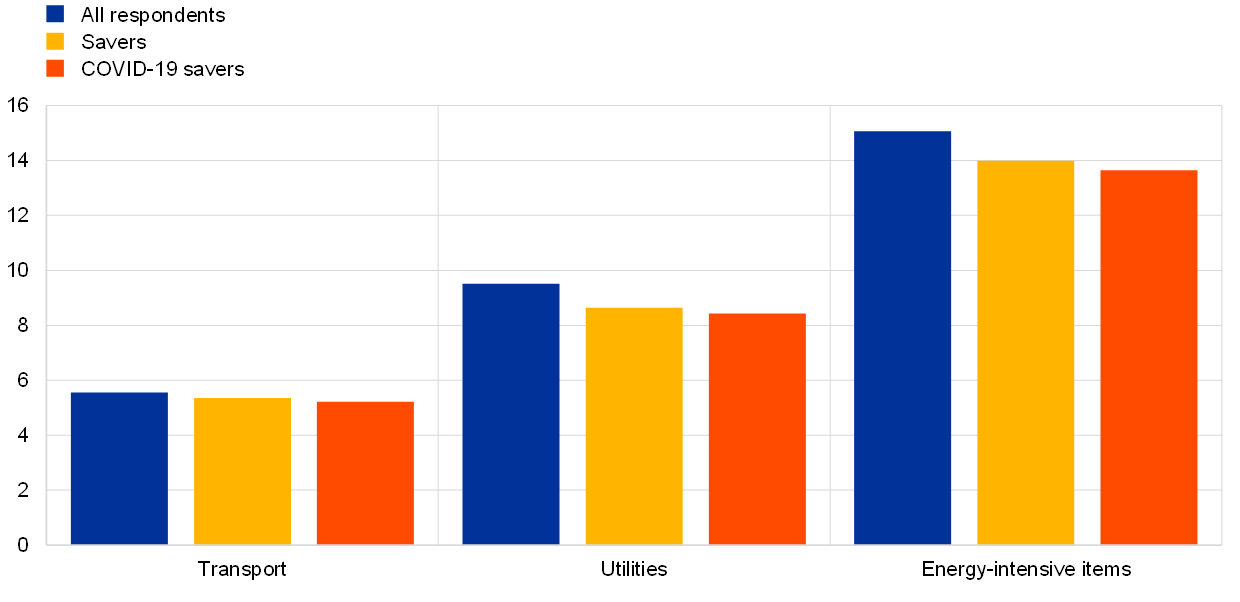
Source: ECB (CES).
Notes: Weighted data. Energy exposure is computed as the ratio of average expenditure on transport and/or utilities to household total net income in January and April 2022.
The analysis is based on responses from households in Germany, France, Italy, Spain, the Netherlands and Belgium.
Note that the importance of the precautionary motive in Chart A (panel b) should be seen as an upper bound in explaining the increase in the aggregate saving ratio, as this motive is likely to have already existed before the pandemic (unlike COVID-19-related reasons).
See Dossche, M. and Zlatanos, S., “COVID-19 and the increase in household savings: precautionary or forced?”, Economic Bulletin, Issue 6, ECB, 2020.
The backward-looking question was: “Which of the following best describes your household’s total consumption of all goods and services over the past twelve months? Your consumption was higher than / about as much as / lower than what your household used to consume on average prior to COVID-19 pandemic.” The forward-looking version referred to the next twelve months.
Aggregate analyses also did not signal much scope for an additional boost to the ongoing recovery in consumption from widespread pent-up demand. See Dossche, M., Krustev, G. and Zlatanos, S., “COVID-19 and the increase in household savings: an update”, Economic Bulletin, Issue 5, ECB 2021.
See Christelis, D., Georgarakos, D., Jappelli, T. and Kenny, G., “The Covid-19 crisis and consumption: survey evidence from six EU countries”, Working Paper Series, No 2507, ECB, December 2020.
The more limited scope for widespread pent-up demand providing an immediate boost to aggregate consumption in the euro area since the summer of 2021 is also evident from a comparison of national accounts data for the euro area and the United States that have become available since July 2021. See, for example, Lane P.R., “The euro area outlook and monetary policy”, presentation given at “The ECB and its Watchers XXII” conference, 17 March 2022.
See Battistini, N., Di Nino, V., Dossche, M. and Kolndrekaj, A., “Energy prices and private consumption: what are the channels?”, Economic Bulletin, Issue 3, ECB, 2022.