
Recent developments in pipeline pressures for non-energy industrial goods inflation in the euro area
Published as part of the ECB Economic Bulletin, Issue 5/2021.
Pronounced rises in input costs on a global level have led to marked increases in import and producer prices for intermediate goods in the euro area (Chart A). Surging commodity price inflation, substantial increases in shipping costs and insufficient supply of some raw materials and intermediate products have led to input cost pressures for the euro area.[1] Such input cost shocks create “pipeline” price pressures at the early stages of the production and distribution chain. Recent developments in input costs have pushed up core producer prices (essentially producer prices in the manufacturing sector), in which intermediate goods have a large weight, with the latter reflecting price increases observed for, especially, basic metals, chemicals and chemical products. How much of these pressures ultimately feeds through to later stages and goods prices at the consumer level depends on many factors, including their duration and firms’ scope and willingness to absorb them by reducing profit margins. In the consumption basket underlying the Harmonised Index of Consumer Prices (HICP) in the euro area, these consumer goods prices are reflected in the category “non-energy industrial goods” (NEIG).
Chart A
Pipeline pressures at earlier stages of the pricing chain
(annual percentage changes)
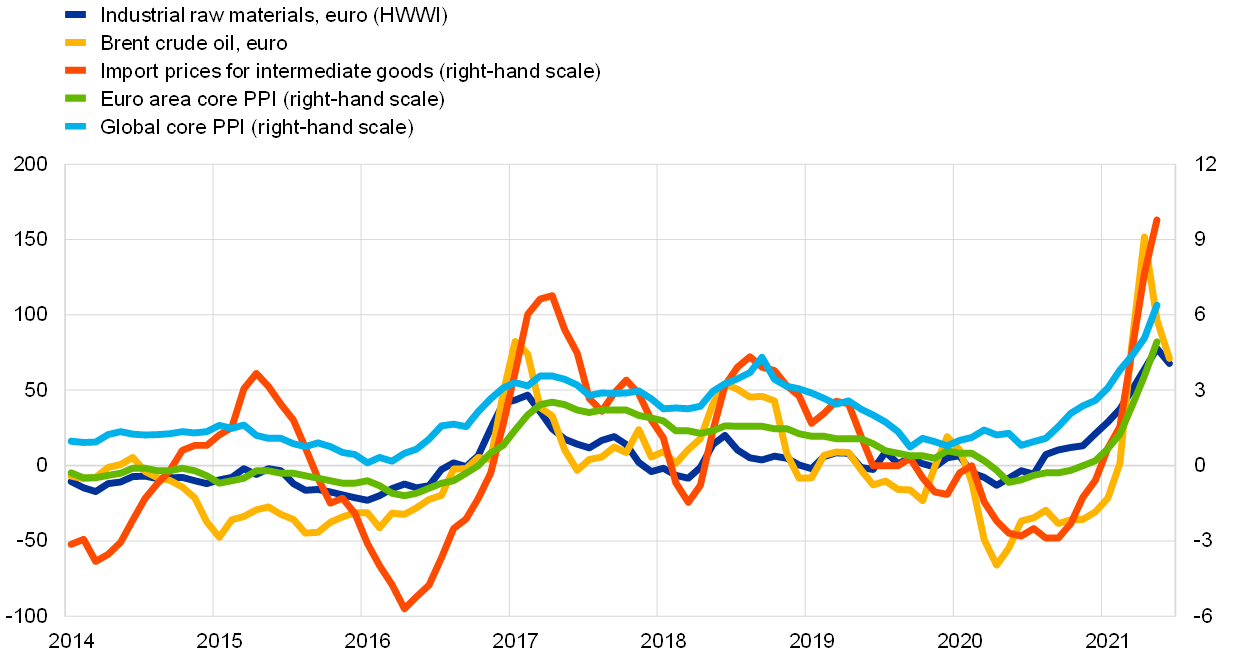
Sources: Eurostat, Bloomberg, Hamburg Institute of International Economics (HWWI) and ECB calculations.
Notes: Core PPI is the producer price index (PPI) for domestic sales excluding the energy and construction sectors. The latest observations are for June 2021 for HWWI industrial raw materials and Brent crude oil (in euro), and May 2021 for the rest.
Price pressures have so far been smaller at later stages of the pricing chain than at the earlier stages (Chart B). Domestic producer price inflation for non-food consumer goods – a key measure of pipeline pressures for HICP NEIG inflation – stood at 1.0% in April 2021, up from 0.9% in March and 0.6% in February. While these rates of change and their development appear subdued relative to those for intermediate goods, the latest outcome was well above its long-term average of 0.6% and at a level seen during the late-cycle phase in 2019. At the same time, the annual rate of change in import prices for non-food consumer goods (imports of final goods account for around 12% of the HICP NEIG basket)[2] remained negative in May, at -0.9%. The magnitude and movement of this rate is closely linked to developments in the euro exchange rate and continues to be affected by the appreciation of the euro compared with its level a year ago.
Chart B
Later stage pipeline pressures
(annual percentage changes)

Sources: Eurostat and ECB calculations.
Notes: The nominal effective exchange rate is shown on an inverted scale – negative numbers hence reflect an appreciation. The latest observations are for June 2021 for NEIG inflation (flash estimate) and for the nominal effective exchange rate, and May 2021 for the rest. The developments in NEIG inflation in the second half of 2020 were strongly affected by the temporary cut in VAT rates in Germany (from July to December) and, in addition, in July and August by the changes in summer sale periods in a number of euro area countries.
Looking ahead, upward pressures from recent input cost developments may still affect NEIG inflation, as the pass-through to consumer prices usually takes more than one year. As production takes time, there are often substantial lags in the speed at which cost pressures affect different stages of the pricing chain. Additional factors that can prolong the pass-through to prices include long-term pricing contracts, a high proportion of fixed prices and (especially larger) firms seeking to stabilise their input costs through hedging. Correlation analysis indicates that it takes around one year for changes in intermediate goods prices to pass through to NEIG inflation.[3] A simple reduced-form regression analysis, which also takes demand considerations into account, finds a somewhat longer time lag: around half a year for changes in intermediate goods prices to pass through to producer prices for non-food consumer goods (with a relatively low pass-through of around one-quarter) followed by at least another year and a half for the complete pass-through (close to one) of these pressures to NEIG inflation (Chart C).[4]
Chart C
Time profile for the impact of changes in producer price indices
(cumulated percentage impact after a 1% change in the shock variable with 95% confidence bands)

Sources: Eurostat and ECB calculations.
Notes: The dotted lines indicate 95% confidence bands. The horizontal axis shows quarters after the impact. The reduced form equation is estimated using the local projections method following Jordà, Ò., “Estimation and Inference of Impulse Responses by Local Projections”, American Economic Review, Vol. 95, No 1, 2005, pp. 161-182. This method allows a time profile to be obtained for the impact of the variable of interest. The panel a regression equation includes the intermediate goods PPI (an autoregressive term), the consumer goods PPI and total manufacturing industrial production excluding energy and construction; the panel b regression equation includes NEIG (an autoregressive term), the non-food consumer goods PPI and the output gap. The estimation sample is 1999 to the fourth quarter of 2019, with all variables seasonally adjusted and lagged by one period. The output gap is in levels; all other variables are in log differences.
However, the pass-through is not automatic and is also likely to vary over time. At each stage pricing decisions depend upon a range of other factors (including capacity utilisation, the stock of inventories, profit absorption and the competitive environment). It could well be, therefore, that a visible cost-push shock emerging at the early stage is absorbed along the various subsequent production and retail stages and no longer appears at the stage of final consumer prices. Using the time profile of the impact shown in Chart C, the cumulative upward pressures on NEIG resulting from producer price developments for non-food consumer goods over the last few years appear essentially to reflect the producer price developments up to 2019; thereafter, they have been partially offset by other factors (Chart D). The impact of the upward movements in producer price inflation in recent months is then yet to come. However, assessing this pass-through may be complicated by the recent strong volatility in NEIG inflation due to changes in sale periods in the summer of 2020 and first quarter of 2021. More generally, the unique situation related to the coronavirus (COVID-19) pandemic could imply some deviation from normal pass-through patterns, and does not exclude the possibility of a stronger than usual pass-through from rising input costs to consumer prices if, for instance, firms’ margins are squeezed and consumers may have some pent-up demand and unexpected savings to finance it.[5]
Chart D
Cumulated pressure from producer price developments on NEIG
(annual percentage changes; percentage point contributions; quarterly data)
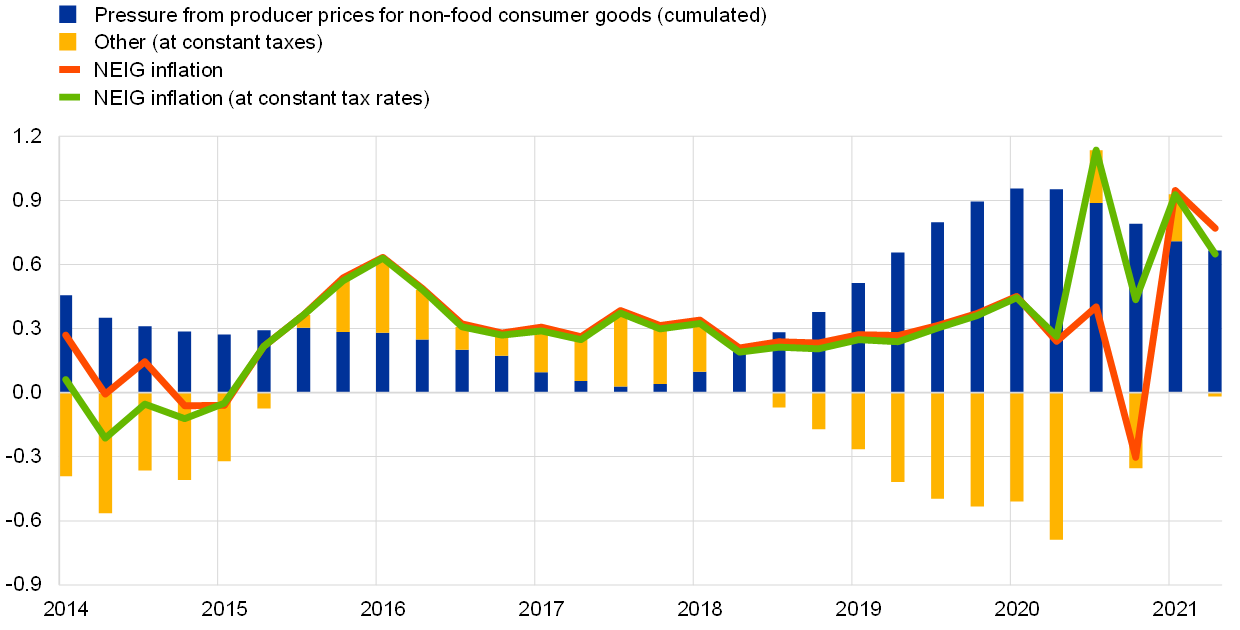
Sources: Eurostat and ECB calculations.
Notes: Effects based on the profile shown in Chart C, calculated using NEIG inflation at constant tax rates (to net out the changes resulting from e.g. the temporary VAT reduction in Germany in the second half of 2020). “Other” is calculated as the difference between NEIG inflation at constant tax rates and the contribution from the cumulated impact of changes in the non-food consumer goods PPI. The latest observations are for the second quarter of 2021, which for the non-food consumer goods PPI and NEIG inflation at constant tax rates reflects the average of April and May, and for NEIG inflation also includes the flash estimate for June.
Overall, even somewhat stronger developments in NEIG inflation would not lead to a substantial strengthening of underlying inflation developments in the euro area. NEIG inflation has tended to be relatively subdued in the euro area, averaging 0.6% from 1999 to 2019, compared with average HICP inflation excluding energy and food of 1.4% over the same period.[6] While the pandemic has temporarily reduced the consumption of services relative to goods somewhat, underlying inflation dynamics continue to be predominantly driven by services inflation (with a weight of around two-thirds in the HICP excluding energy and food), for which wages, and not intermediate products or raw materials, represent the lion’s share of input costs.
- See also the boxes entitled “What is driving the recent surge in shipping costs?”, Economic Bulletin, Issue 3, ECB, 2021 and “The semiconductor shortage and its implication for euro area trade, production and prices”, Economic Bulletin, Issue 4, ECB, 2021.
- See the box entitled “Monitoring the exchange rate pass‑through to inflation”, Economic Bulletin, Issue 4, ECB, 2018.
- See also the box entitled “What can recent developments in producer prices tell us about pipeline pressures?”, Economic Bulletin, Issue 3, ECB, 2017.
- The general pattern of a relatively quick pass-through to producer prices for non-food consumer goods and a longer lag for the pass-through to final consumer prices (of around one year in total) is also supported by earlier ECB studies. See for example Landau, B. and Skudelny, F., “Pass-through of external shocks along the pricing chain – a panel estimation approach for the euro area“, Working Paper Series, No 1104, ECB, Frankfurt am Main, November 2009.
- See also the box entitled “COVID-19 and the increase in household savings: precautionary or forced?”, Economic Bulletin, Issue 6, ECB, 2020.
- See also the box entitled “What is behind the change in the gap between services price inflation and goods price inflation?”, Economic Bulletin, Issue 5, ECB, 2019.