
Sources of economic policy uncertainty in the euro area: a machine learning approach
Published as part of the ECB Economic Bulletin, Issue 5/2019.
Global policy uncertainty has recently increased and remains relatively high. Uncertainty about global trade disputes, the economic challenges stemming from climate change and geopolitical factors are contributing to increased levels of policy-related uncertainty in Europe. Understanding the sources and dynamics of uncertainty which hits the economy is valuable for policymakers, including central banks. Firms are particularly sensitive to uncertainty when making their investment decisions.[1] In response to uncertainty shocks, they may reduce their investment, hiring or orders for foreign intermediates, leading to a deceleration in trade and aggregate investment. Consumers, in turn, may react to increased uncertainty by postponing consumption and increasing precautionary savings, as reflected in the rise in the household saving rate in 2018. This can lead to a contraction in international trade and domestic economic activity.[2]
In this box, an indicator of economic policy uncertainty (EPU) is presented which applies unsupervised machine learning techniques to newspaper articles. While there has been a recent rise in uncertainty measures, conventional techniques fail to fully capture country-specific characteristics. The economic policy uncertainty index developed by Baker, Bloom and Davis (2016)[3] (the BBD approach) is produced by counting the number of press articles describing policy uncertainty issues using a list of keywords. However, individual components of policy uncertainty are not identified with this method, since the list of keywords retrieves all articles without regard to the specific source of uncertainty (i.e. fiscal, monetary or trade policy uncertainty). To dig into the different sources of uncertainty, the approach described in Azqueta-Gavaldón (2017a, 2017b)[4] is used. This approach applies a machine learning algorithm (latent Dirichlet allocation, LDA)[5] to all news articles containing words related to “economy” and “uncertainty”.[6] LDA is unsupervised in the sense that the algorithm infers the themes in the set of documents without any labelling of the articles or training of the model before the articles are classified. LDA analyses a set of documents and allocates words to topics on the basis of how often they occur together in the same document. In other words, a topic is a set of related words that frequently occur together. Each document, in turn, can be represented as a “mixture of topics”, where the topics are those defined by the allocation of words.[7] LDA is more robust than other techniques because it is not dependent on the ex ante choice of specific keywords. In addition, words that frequently occur together in a document are assigned to the same topic, which is what makes the results of LDA more intuitive than those of similar techniques. The only choice the modeller needs to make is the number of topics into which to divide the corpus of documents.
Topics framed by the LDA characterise sub-components of policy uncertainty in an intuitive and language-independent manner. The LDA algorithm is run on a total of 171,107 news articles collected from the most popular newspapers in Germany, France, Italy and Spain during the period from January 2000 to May 2019. Table A shows the most representative words per category retrieved by the algorithm for each country. As can be seen, the lists of words that form each topic seem coherent in the sense that it is not difficult to infer the topic from the words, even across different languages. One caveat of the analysis is that the LDA algorithm used is static, i.e. the selected words are the same over the whole sample period.[8]
The EPU index series built using unsupervised machine learning closely resembles the BBD EPU index series in the euro area, although the levels of some peaks differ. In order to validate this method, Chart A compares the aggregate euro area uncertainty index (built by aggregating each individual EPU category across each country)[9] with the BBD EPU index. The indices are highly correlated (at 0.85), and both spike during the Iraq War (March 2003), the European sovereign debt crisis (2010-2014) and the announcement of the results of the referendum on Britain’s membership of the EU (Brexit) (June 2016). While the similarities are strong, the most significant spike in the BBD index occurs during the month of the Brexit referendum (June 2016), while in the LDA-based index it takes place during the sovereign debt crisis (August 2011).
Table A
Most relevant words identified by the LDA in each category

Source: ECB staff calculations.
Note: Before running the algorithm, articles were pre-processed: stopwords (e.g. “me”, “or”, “the” “a”) and punctuation were removed; each word was converted into lower case; and all the words were converted into their root (stemming). This table shows whole words instead of the root.
Chart A
Euro area LDA-based EPU index and BBD EPU index
(index: mean = 100)
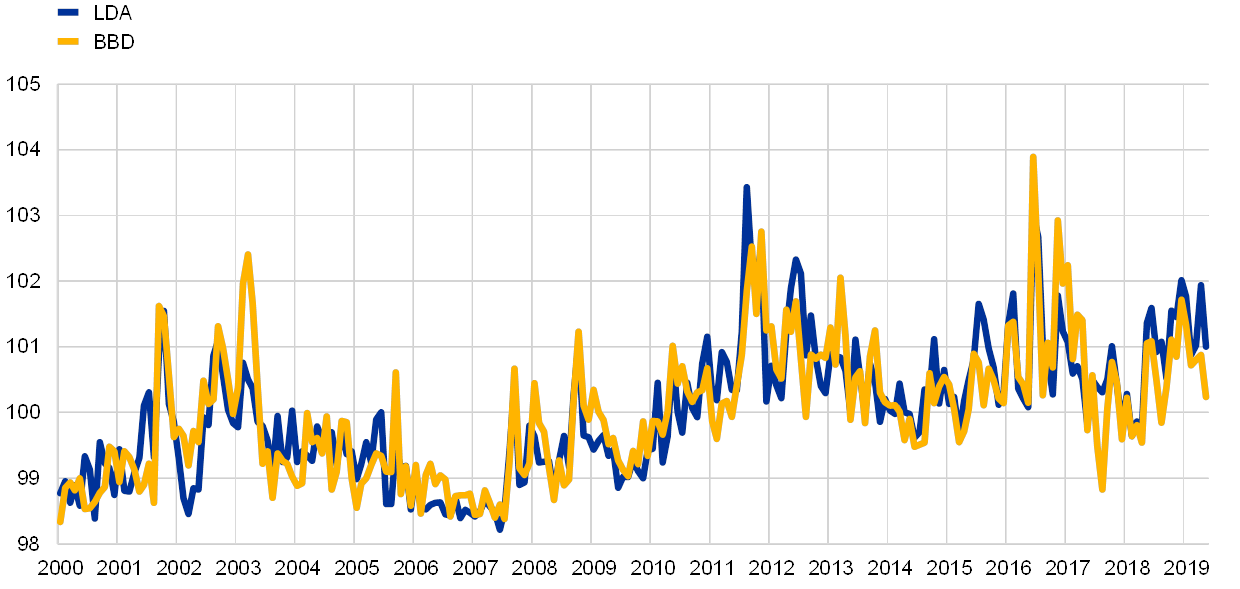
Sources: Economic Policy Uncertainty website (www.policyuncertainty.com) and ECB staff calculations.
Notes: The euro area LDA-based EPU index is composed of the four country EPU indices (equally weighted). Each individual index is derived from the number of news articles whose most representative topic is one of the eight categories listed in Table A divided by the total number of news articles containing the word “today” (“heute”, “aujourd’hui”, “oggi”, “hoy”). The BBD EPU index corresponds to the average EPU index for Germany, France, Italy and Spain taken from the Economic Policy Uncertainty website. Each final time series is standardised with a mean of 100 and one standard deviation.
The sub-components of the index suggest that since 2016, trade, domestic regulation and fiscal policy have been the main sources of policy uncertainty (see Chart B). The contributions of individual uncertainty components to overall economic policy uncertainty have been quite dynamic since 2016. In the year of the Brexit referendum (2016), the main drivers of policy uncertainty in the euro area were related to monetary policy, European regulation and trade. By contrast, in 2017 a reduction in policy uncertainty was explained by a big drop in uncertainty related to monetary policy. The last time the ECB cut interest rates was in 2016, when it also stated that rates would remain at current or lower levels for an extended period, thereby clarifying future interest rate policy for a relatively long time ahead. As for 2018, and so far in 2019, a steady and pronounced increase in the euro area EPU index can be observed, driven in particular by trade-related uncertainty, but also to some extent by uncertainties related to domestic regulation (e.g. uncertain effects of new emission standards) and fiscal policy (e.g. enforcement of EU budget rules in some Member states). These appear mainly to reflect (i) global trade disputes involving the United States and China that are likely to affect euro area exports/imports; (ii) uncertainties surrounding the Brexit negotiations; and (iii) concerns regarding domestic and fiscal policies in some euro area countries. They do not appear to reflect uncertainties associated with the conduct of monetary policy.
Chart B
Contributions by topic to changes in economic policy uncertainty in the euro area
(average annual percentage changes and percentage point contributions)
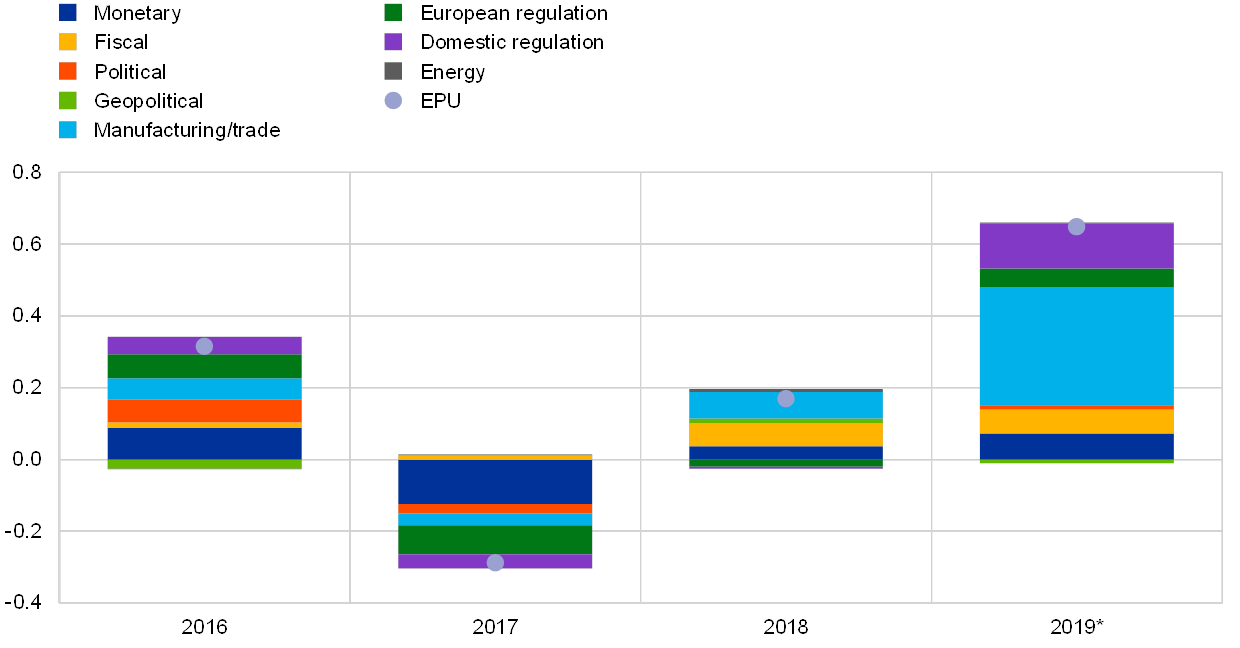
Source: ECB staff calculations.
Note: * For 2019 the annual contribution is based on the period from January to May 2019.
- See Gulen, H. and Ion, M., “Policy Uncertainty and Corporate Investment”, The Review of Financial Studies, Vol. 29(3), 2016, pp. 523-564.
- See Handley, K. and Limão, N., “Trade and Investment under Policy Uncertainty: Theory and Firm Evidence”, American Economic Journal: Economic Policy, Vol. 7(4), 2015, pp. 189-222, and the article entitled “The impact of uncertainty on activity in the euro area”, Economic Bulletin, Issue 8, ECB, 2016.
- See Baker, S., Bloom, N. and Davis, S., “Measuring Economic Policy Uncertainty”, Quarterly Journal of Economics, Vol. 131, No 4, 2016, pp. 1593-1636.
- See Azqueta-Gavaldón, A., “Developing news-based Economic Policy Uncertainty index with unsupervised machine learning”, Economics Letters, Vol. 158, 2017a, pp. 47-50; and Azqueta-Gavaldón, A., “Financial investment and economic policy uncertainty in the UK”, IML '17 Proceedings of the 1st International Conference on Internet of Things and Machine Learning, 2017b.
- See Blei, D.M., Ng, A.Y. and Jordan, M.I., “Latent Dirichlet Allocation”, Journal of Machine Learning Research, Vol. 3, 2003, pp. 993-1022.
- To come up with words related to “uncertainty” and “economy” the word2vec algorithm was used: a two-layer neural net for parsing text that turns each word into a vector. The words most similar in the vector space to the words “uncertainty” and “economy” are then selected. See Mikolov, T., Sutskever, I., Chen, K., Corrado, G.S. and Dean, J., “Distributed Representations of Words and Phrases and their Compositionality”, in Burges, C.J.C., Bottou, L., Welling, M., Ghahramani, Z. and Weinberger, K.Q. (eds.), Advances in Neural Information Processing Systems 26 (NIPS 2013), 2013, pp. 3111-3119.
- The prior distributions for the weights of each topic within a document and for the probability of each word being assigned to a topic are drawn from a Dirichlet probability distribution.
- Given that the set of words that characterise a topic might change over time, a dynamic LDA algorithm would be more suitable for categorising new data (i.e. future news articles).
- Building the EPU indices for each country required several steps. First, each article was labelled according to its most representative topic (the topic with the highest percentage in the article). Second, a raw count of the number of articles on each topic in each month was produced. Since the number of articles is not constant over time, each raw time series was divided by the total number of articles.