
Purchases of green bonds under the Eurosystem’s asset purchase programme
Published as part of the ECB Economic Bulletin, Issue 7/2018.
This box analyses the impact of the Eurosystem’s asset purchase programme (APP) on the growing market for green bonds[1]. It describes the composition of the Eurosystem’s green bond holdings and assesses developments in prices and outstanding volumes of green bonds, before discussing the extent to which these may have been affected by the APP.
The APP aims to support a sustained adjustment in the path of inflation that is consistent with the ECB’s primary objective of price stability, defined as an inflation rate below, but close to, 2% over the medium term. Eligibility criteria for the APP are deliberately broad in order to provide a large range of purchasable securities. This supports the effectiveness of the programme and avoids distortions of specific market segments. The implementation of the APP is guided by the principle of market neutrality and does not positively or negatively discriminate on the basis of environmental or any other criteria. In the specific case of the corporate sector purchase programme (CSPP), which aims to further strengthen the pass-through of the benefits of the asset purchases to financing conditions in the real economy, the purchases of securities issued by non-bank corporations reflect proportionally the market value of all eligible bonds in terms of sectors of economic activity and rating groups.
Despite the absence of an explicit environmental target in the APP, ECB has purchased green bonds under both the CSPP and the public sector purchase programme (PSPP). These purchases have contributed to the establishment of a well-diversified portfolio.
The term “green bond” refers to debt securities whose proceeds are used to finance investment projects with an environmental benefit. There are different approaches to defining and certifying green bonds, and no global market standard has emerged so far.[2] While many green bonds are self-labelled, some jurisdictions have developed their own certification framework and others rely on various different guidelines.[3] As well as reducing transparency for investors, it is believed that the lack of standardised definitions and reporting requirements and the varying granularity of the underlying classifications are holding back supply,[4] inter alia because issuers face reputational risks and potential accusations of “greenwashing” if proceeds are not used for their declared purposes.[5] The ECB supports current EU initiatives under the European Commission’s action plan on sustainable finance to create a harmonised definition of “green” assets (taxonomy), which could improve transparency and facilitate the supply of green debt instruments.
The market for green bonds has developed rapidly in recent years, with global issuance rising from less than €1 billion in 2008 to more than €120 billion in 2017 (see Chart A, panel b). Euro-denominated net green bond issuance has increased ten-fold since 2013 (see Chart A, panel a). During the period 2013-2018, total net euro-denominated green investment grade issuance in the euro area represented around 24% of global net green issuance. However, despite the recent growth, in the same period green bonds still accounted for only 1% of the overall bond supply denominated in euro. Green bonds are not unlike other bonds in that they tend to price tighter than the initial price guidance and tend to be oversubscribed. They generally offer similar yields to comparable conventional bonds, but there is evidence that in some market segments issuers can borrow at lower rates than via conventional bonds, which is consistent with the interpretation that investors are prepared to forgo some income as a result of their self-imposed investment constraints.[6]
Chart A
Net issuance of euro-denominated green bonds
(EUR billions)

Sources: Bloomberg and ECB calculations.
Note: Data for 2018 refer to issuance from January to August.
Green bond purchases under the CSPP are broadly in line with the growing share of green bonds in the eligible universe. The CSPP-eligible green corporate bond universe currently has an outstanding volume of €31 billion (see Chart B, right panel), of which the Eurosystem holds close to 20% – in line with the 20% holding of the Eurosystem in the entire CSPP-eligible universe. In the overall CSPP-eligible universe, green bonds represent a small but growing segment, contributing around 4% to the total (see Chart B, left panel). Looking more closely at the distribution by economic sector, green bond issuance is not evenly spread across industries and shows a significant concentration in carbon-intensive sectors, such as utilities, infrastructure, transportation and construction.[7] Companies in these sectors issue green bonds to finance the adoption of more efficient technologies, reduce their carbon footprints and reorient their energy portfolios towards renewable sources. While these sectors jointly account for 35% of overall bond issuance in the CSPP-eligible universe, they account for 94% of the CSPP-eligible green bond issuance. The concentration of green bonds in these sectors is also reflected in the CSPP portfolio.
Chart B
CSPP and PSPP-eligible universe and eligible green bonds – amounts outstanding
(EUR billions)

Sources: Bloomberg and ECB calculations.
Notes: Based on amounts outstanding in nominal terms. The latest observation is for 31 August 2018.
Since the CSPP announcement on 10 March 2016, green corporate bond spreads have steadily declined, and a significant part of this effect can be attributed to the Eurosystem’s purchases. In the industrial sector, the evolution of the average corporate bond spread for CSPP-eligible green bonds mirrors that for other CSPP-eligible bonds (see Chart C). The change in spreads for eligible green bonds in the period after the CSPP announcement (from 10 March 2016 to the end of December 2017) was compared with that in the period prior to the announcement (1 April 2015 to 9 March 2016), controlling for other determinants that may affect corporate bond spreads, such as bond-specific credit risk. The CSPP accounted for an average decline in spreads for eligible green bonds of 25 basis points, which was almost the entire drop recorded after the announcement of the programme. Since the end of 2016, in conjunction with the simultaneous rapid growth in bond supply and the increase in green bond spreads globally, the gap between spreads of green bonds and those of the overall industrial sector have gradually closed, and the yields of green and conventional bonds have tightly co-moved since the end of 2017.[8]
Chart C
CSPP-eligible bond spreads in the industrial sector and global green bond spreads
(Z-spread, basis points)
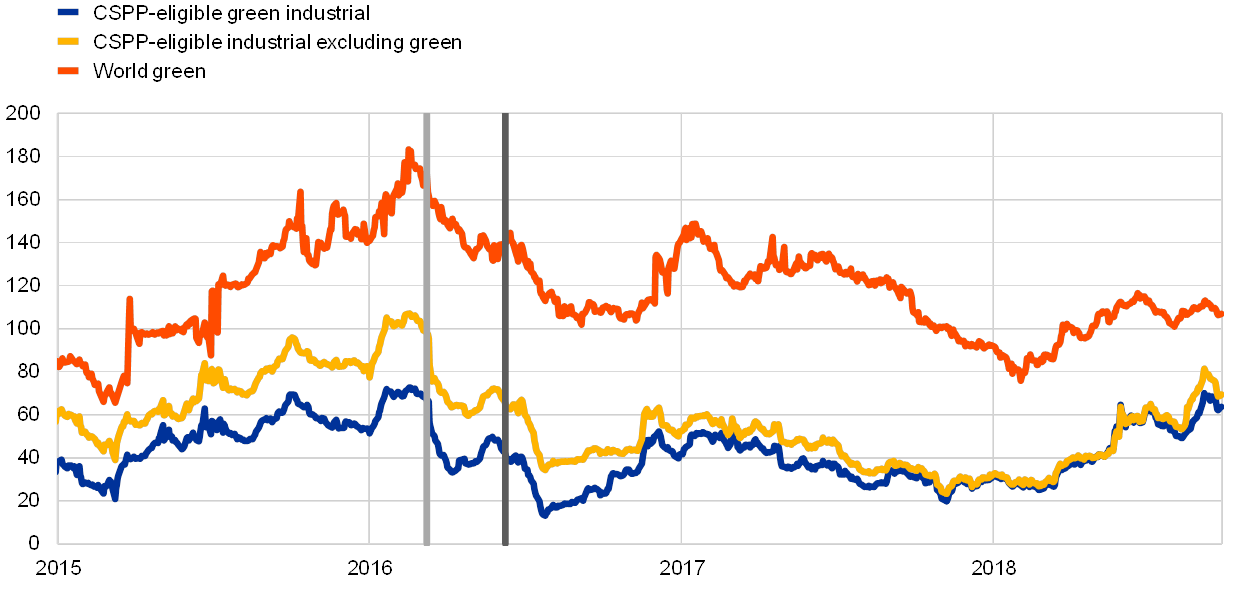
Sources: Bloomberg and ECB calculations.
Notes: Z-spread volume-weighted averages based on bonds with (i) issued amounts above €250,000, (ii) rating buckets ranging from A to BBB and (iii) residual maturity ranging from 3 to 11 years for CSPP-eligible bonds or from 1.5 to 20 years for global green bonds. Extreme outliers for global green bond spreads were removed. The vertical lines denote the announcement of the CSPP on 10 March 2016 (light grey line) and the start of purchases under the CSPP on 8 June 2016 (dark grey line). The latest observation is for 27 September 2018.
Issuance of green bonds picked up immediately after the announcement of the CSPP in March 2016 and has been rising ever since. The ratio of the amount outstanding of green bonds to the total amount outstanding in the industrial sector, including utilities, infrastructure, transportation and construction, has increased steadily since the announcement of the CSPP, from under 4% in March 2016 to over 9% at the end of September 2018 (see Chart D). These results are consistent with previous findings on the impact of the CSPP on overall bond issuance by non-financial corporations, which increased after the announcement of the programme, particularly among eligible issuers.[9] These findings are corroborated by an analysis of the more homogenous utilities sector as well as for specific maturities. It should be noted, however, that this positive trend partly reflects a world-wide phenomenon, as green bond issuance has increased globally, from less than €10 billion in 2013 to almost €120 billion in 2017.
Chart D
Volume of CSPP-eligible green bonds relative to total CSPP-eligible bonds in the industrial sector
(percentages)

Sources: Bloomberg and ECB calculations.
Notes: Based on amounts outstanding in nominal terms. The latest observation is for 27 September 2018.
The Eurosystem has also purchased green bonds issued by sovereigns, agencies and supranational institutions since the start of the PSPP, with a growing presence over time. The volume of eligible green bonds issued by such public sector entities is small relative to the PSPP-eligible universe (less than 1%). While multilateral development banks such as the European Investment Bank and agencies like Kreditanstalt für Wiederaufbau have a long history of issuing green bonds and account for a relative large share of the total issuance of PSPP-eligible green bonds (see Chart E, panel a), governments entered the green bond market only recently, with the French Treasury becoming the first euro area sovereign to issue a green bond in January 2017. Governments, however, show a tendency to tap the market on a large scale, exceeding the amounts that are issued by corporates in the same jurisdiction (see Chart E, panel b). Overall, green bonds issued by public sector entities contribute a volume of €48 billion to the PSPP-eligible universe, out of which the Eurosystem currently holds 24%, which is broadly in line with its total PSPP holdings of the entire PSPP universe and compares with a share of 15% in 2015.
Overall, while the amount of green bonds held by the Eurosystem remains relatively small, evidence suggests that through its purchases the Eurosystem has reduced yields of green bonds and supported their issuance by non-financial corporations.
Chart E
Public and corporate sector green bond issuance by jurisdiction (amounts outstanding)
(EUR billions)

Sources: Bloomberg and ECB calculations.
Notes: SNAT stands for supranational entities, which includes multilateral development banks. Data refer to the period from January 2012 to August 2018.
(percentages)

- In this box, “green bonds” are defined on the basis of the Bloomberg classification of the bonds’ use of proceeds, where proceeds are exclusively applied to new and existing green projects, defined as projects and activities that promote climate or other environmental sustainability purposes.
- For an overview of existing definitions and certifications, see Ehlers, T. and Packer, F., “Green bond finance and certification”, BIS Quarterly Review, September 2017.
- See, for example, “Green Bond Principles”, International Capital Market Association, 2018.
- See “Green Bonds: Country Experiences, Barriers and Options”, input report prepared for the G20 Green Finance Study Group, 2016.
- See Wang, E.K., “Financing Green: Reforming Green Bond Regulation in the United States”, Brooklyn Journal of Corporate, Financial & Commercial Law, Vol. 12, No 2, 2017, pp. 467-491.
- See Ehlers, T. and Packer, F., op. cit.; and Baker, M., Bergstresser, D., Serafeim, G. and Wurgler, J., “Financing the Response to Climate Change: The Pricing and Ownership of U.S. Green Bonds”, NBER Working Paper, No 25194, October 2018.
- Based on internal ECB classifications. According to Eurostat data, utilities, infrastructure, transportation and construction accounted for 67% of total greenhouse gas emissions in the EU in 2015.
- The increase in green corporate bond spreads at the end of 2016 was due in part to technical factors. On 10 October 2016 a new €1.75 billion issue from Electricité de France increased the volume-weighted average of green corporate bond spreads by six basis points from 25 to 31 basis points.
- For an overview of the of the CSPP impact, see the article entitled “The impact of the corporate sector purchase programme on corporate bond markets and the financing of euro area non-financial corporations”, Economic Bulletin, Issue 3, ECB, 2018.