
- PRESS RELEASE
- Transmission embargo until 10:00 CET on Wednesday, 20 November 2019
Euro area investment fund statistics: third quarter of 2019
20 November 2019
- In the third quarter of 2019 the outstanding amount of shares/units issued by investment funds other than money market funds was €12,537 billion, €446 billion higher than in the second quarter of 2019.
- The outstanding amount of shares/units issued by exchange-traded funds (ETFs) stood at €781 billion, which was €47 billion higher than in the second quarter of 2019.
- The outstanding amount of shares/units issued by money market funds was €1,247 billion, €92 billion higher than in the second quarter of 2019.
Chart 1
Investment fund shares/units issued
(EUR billions; not seasonally adjusted)
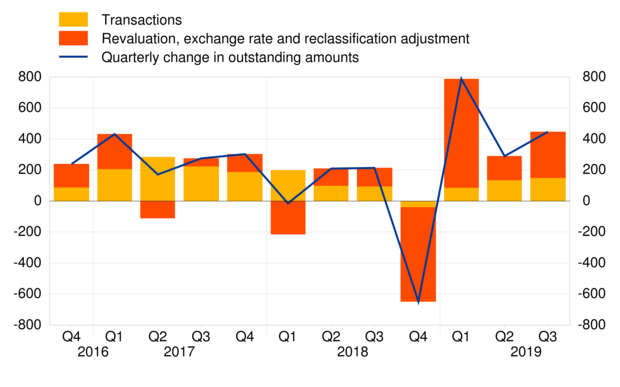
In the third quarter of 2019 the outstanding amount of shares/units issued by investment funds other than money market funds was €446 billion higher than in the second quarter of 2019 (see Chart 1). This development was accounted for by €150 billion in net issuance of shares/units and €296 billion in other changes (including price changes). The annual growth rate of shares/units issued by investment funds other than money market funds, calculated on the basis of transactions, was 2.8% in the third quarter of 2019.
Chart 2
Investment funds' holdings of debt securities
(quarterly transactions in EUR billions; not seasonally adjusted)

Chart 3
Investment funds' holdings of equity and investment fund shares/units
(quarterly transactions in EUR billions; not seasonally adjusted)
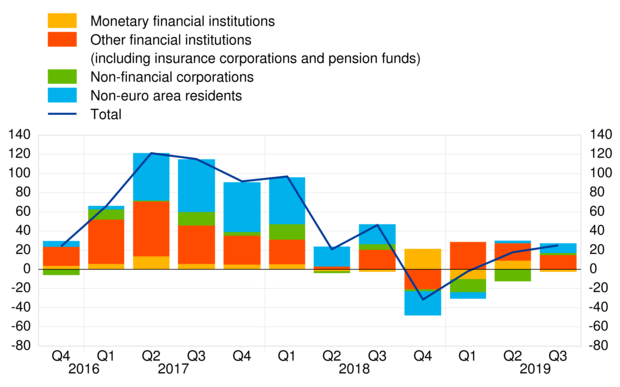
Within the assets of investment funds other than money market funds, the annual growth rate of debt securities was 5.2% in the third quarter of 2019, with transactions amounting to €126 billion during this period (see Chart 2). The annual growth rate of equity and investment fund shares/units was 0.1% in the third quarter of 2019, with transactions amounting to €25 billion during this period (see Chart 3). In the case of equity, the corresponding annual growth rate was -0.5%, with transactions totalling €19 billion. For holdings of investment fund shares/units, the annual growth rate was 1.3% and transactions amounted to €6 billion.
In terms of holdings by issuing sector, the annual growth rate of debt securities issued by euro area general government was -0.4% in the third quarter of 2019. In the same period, the net purchases of debt securities issued by the euro area general government amounted to €1 billion (see Chart 2). In the case of debt securities issued by the private sector, the annual growth rate was 7.0%, whereby the net purchases amounted to €36 billion. For debt securities issued by non-euro area residents, the corresponding annual growth rate was 6.4%, with net purchases of €89 billion.
Chart 4
Investment fund shares/units issued by type of investment fund
(quarterly transactions in EUR billions; not seasonally adjusted)

In terms of the type of investment fund, the annual growth rate of shares/units issued by bond funds was 5.9% in the third quarter of 2019. In the same period, transactions in shares/units issued by bond funds amounted to €80 billion (see Chart 4). In the case of equity funds, the corresponding annual growth rate was -0.6%, with transactions of €9 billion. For mixed funds, the corresponding figures were 2.4% and €38 billion.
Chart 5
Investment fund shares/units issued by ETFs and underlying assets
(quarterly transactions in EUR billions; not seasonally adjusted)

The shares/units issued by exchange-traded funds (ETFs), which are presented as a separate category within total investment funds, recorded an annual growth rate of 10.8% in the third quarter of 2019, with an outstanding amount of €781 billion (see Chart 5). In terms of assets held by ETFs, in the third quarter of 2019, 60% were equity, 26% were debt securities and 14% were other assets (including financial derivatives, deposit and loan claims and investment fund shares/units).
The outstanding amount of shares/units issued by money market funds was €92 billion higher than in the second quarter of 2019. This development was accounted for by €71 billion in net issuance of shares/units and €22 billion in other changes (including price changes). The annual growth rate of shares/units issued by money market funds, calculated on the basis of transactions, was 8.0% in the third quarter of 2019.
Within the assets of money market funds, the annual growth rate of debt securities holdings was 10.1% in the third quarter of 2019, with transactions amounting to €80 billion, which reflected net purchases of €39 billion related to debt securities issued by euro area residents and net purchases of €41 billion in debt securities issued by non-euro area residents. For deposits and loan claims, the annual growth rate was 6.2% and transactions during the third quarter of 2019 amounted to -€8 billion.
Annex
Table: Annex to the press release on euro area investment fundsStatistical Data Warehouse:
All money market funds time seriesAll investment funds other than money market funds time series
For media queries, please contact Stefan Ruhkamp, tel.: +49 69 1344 5057.
Notes:
- Money market funds are presented separately in this press release since they are classified in the monetary financial institutions sector within the European statistical framework.
- "Euro area private sector" refers to total euro area excluding general government.
- Hyperlinks in the main body of the press release and in annex tables lead to data that may change with subsequent releases as a result of revisions. Figures shown in annex table are a snapshot of the data as at the time of the current release.
Banco Central Europeo
Dirección General de Comunicación
- Sonnemannstrasse 20
- 60314 Frankfurt am Main, Alemania
- +49 69 1344 7455
- media@ecb.europa.eu
Se permite la reproducción, siempre que se cite la fuente.
Contactos de prensa